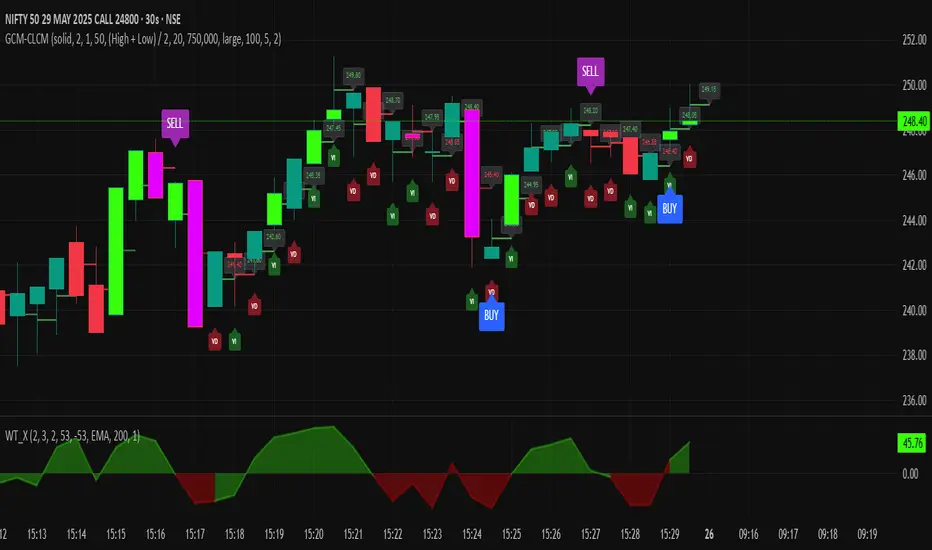
GCM Centre Line Candle MarkerGCM Centre Line Candle Marker (GCM-CLCM) - Descriptive Notes
Indicator Overview:
The "GCM Centre Line Candle Marker" is a versatile TradingView overlay indicator designed to enhance chart analysis by drawing short horizontal lines at user-defined "centre" points of candles. These lines provide a quick visual reference to key price levels within each candle, such as midpoints, open, close, or typical prices. The indicator offers extensive customization for line appearance, positioning, and conditional display, including an option to highlight only bullish engulfing patterns.
Key Features:
1. Customizable Line Position:
o Users can choose from various methods to calculate the "centre" price for the line:
(High + Low) / 2 (Default)
(Open + Close) / 2
Close
Open
(Open + High + Low + Close) / 4 (HLCO/4)
(Open + High + Close) / 3 (Typical Price HLC/3 variation)
(Open + Close + Low) / 3 (Typical Price OCL/3 variation)
2. Line Appearance Customization:
o Visibility: Toggle lines on/off.
o Style: Solid, dotted, or dashed lines.
o Width: Adjustable line thickness (1 to 5).
o Length: Defines how many candles forward the line extends (1 to 10).
o Color: Lines are colored based on candle type (bullish/bearish), with user-selectable base colors.
o Dynamic Opacity: Line opacity is dynamically adjusted based on the candle's size relative to recent candles. Larger candles produce more opaque lines (up to the user-defined maximum opacity), while smaller candles result in more transparent lines. This helps significant candles stand out.
3. Price Labels:
o Show Labels: Option to display price labels at the end of each center line.
o Label Background Color: Customizable.
o Dynamic Text Color: Label text color can change based on the movement of the center price:
Green: Current center price is higher than the previous.
Red: Current center price is lower than the previous.
Gray: No change or first label.
o Static Text Color: Alternatively, a fixed color can be used for all labels.
4. Conditional Drawing - Bullish Engulfing Filter:
o Users can enable an option to Only Show Bullish Engulfing Candles. When active, center lines will only be drawn for candles that meet bullish engulfing criteria (current bull candle's body engulfs the previous bear candle's body).
5. Performance Management:
o Max Lines to Show: Limits the number of historical lines displayed on the chart to maintain clarity and performance. Older lines are automatically removed as new ones are drawn.
6. Alert Condition:
o Includes a built-in alert: Big Bullish Candle. This alert triggers when a bullish candle's range (high - low) is greater than the 20-period simple moving average (SMA) of candle ranges.
How It Works:
• For each new candle, the script calculates the "center" price based on the user's Line Position selection.
• If showLines is enabled and (if applicable) the bullish engulfing condition is met, a new line is drawn from the current candle's bar_index at the calculated _center price, extending lineLength candles forward.
• The line's color is determined by whether the candle is bullish (close > open) or bearish (close < open).
• Opacity is calculated dynamically: scaledOpacity = int((100 - maxUserOpacity) * (1 - dynamicFactor) + maxUserOpacity), where dynamicFactor is candleSize / maxSize (current candle size relative to the max size in the last 20 candles). This means maxUserOpacity is the least transparent the line will be (for the largest candles), and smaller candles will have lines approaching full transparency.
• Optional price labels are added at the end of these lines.
• The script manages an array of drawn lines, removing the oldest ones if the maxLines limit is exceeded.
Potential Use Cases:
• Visualizing Intra-Candle Levels: Quickly see midpoints or other key price points without manual drawing.
• Short-Term Reference Points: The extended lines can act as very short-term dynamic support/resistance or points of interest.
• Pattern Recognition: Highlight bullish engulfing patterns or simply emphasize candles based on their calculated center.
• Volatility Indication: The dynamic opacity can subtly indicate periods of larger or smaller candle ranges.
• Confirmation Tool: Use in conjunction with other indicators or trading strategies.
User Input Groups:
• Line Settings: Controls all aspects of the line's appearance and calculation.
• Label Settings: Manages the display and appearance of price labels.
• Other Settings: Contains options for line management and conditional filtering (like Bullish Engulfing).
This indicator provides a clean and customizable way to mark significant price levels within candles, aiding traders in their technical analysis.
在脚本中搜索"20年美元汇率"
Adaptive Multi-TF Indicator Table with Presets giua64📌 Script Name:
Adaptive Multi-Timeframe Indicator Table with Presets — giua64
📄 Description:
This script displays an adaptive multi-timeframe dashboard that summarizes the signals of three key technical indicators:
Moving Averages (MAs), Relative Strength Index (RSI), and MACD.
It provides a fast and visually intuitive overview of market conditions across five timeframes (5m, 15m, 30m, 1h, 4h), helping traders quickly identify potential directional biases (e.g., bullish, bearish, or neutral) based on either predefined presets or fully manual settings.
🧰 Preset Configurations:
You can choose between four trading styles, each with optimized indicator parameters:
Scalping
• MAs: 5 / 10 (Fast), 20 / 50 (Slow)
• RSI: 7 periods | Overbought: 70 | Oversold: 30
• MACD: 5 / 13 | Signal: 3
Intraday
• MAs: 9 / 21 (Fast), 50 / 100 (Slow)
• RSI: 14 periods | Overbought: 60 | Oversold: 40
• MACD: 12 / 26 | Signal: 9
Swing
• MAs: 10 / 20 (Fast), 50 / 200 (Slow)
• RSI: 14 periods | Overbought: 65 | Oversold: 35
• MACD: 12 / 26 | Signal: 9
Manual
• Full custom control over all indicator settings.
🛠️ All settings can be customized manually from the options panel, including the exact MA periods, RSI thresholds, and MACD structure.
🧠 How It Works:
For each timeframe, the script evaluates:
MA crossover status (two levels):
The first symbol refers to the crossover of the fast MAs
The second symbol refers to the crossover of the slow MAs
🟢 = Bullish crossover
🔴 = Bearish crossover
➖ = Flat or no clear signal
RSI Direction:
↑ = RSI above upper threshold (potential overbought)
↓ = RSI below lower threshold (potential oversold)
→ = RSI in neutral range
MACD Line vs Signal Line:
↑ = MACD line is above signal line (bullish)
↓ = MACD line is below signal line (bearish)
→ = Flat or neutral signal
Each signal is assigned a numerical score. These are aggregated per timeframe to compute a combined score that reflects the directional bias for that specific time window.
🧠 Adaptive Logic by Asset:
This script is designed to be universally compatible across all asset types — including forex, crypto, stocks, indices, and commodities.
Thanks to its multi-timeframe nature and flexible indicator presets, the script automatically adjusts its behavior based on the asset selected, ensuring relevant analysis without requiring manual recalibration.
🧾 Summary Table Output:
At the bottom of the dashboard, a combined sentiment is displayed for:
3TF → 5m, 15m, 30m
4TF → Adds 1h
5TF → Adds 4h
Each row shows:
Signal → LONG / SHORT / NEUTRAL
Confidence (%) → Based on score aggregation and signal consistency
📌 Customization Options:
Table Position: Left, Right, or Center
Text Size: Small, Normal, or Large
Full Manual Configuration: All MA, RSI, and MACD parameters can be adjusted as needed
⚠️ Disclaimer:
This script is for educational and analytical purposes only.
It does not constitute financial advice or guarantee any trading results.
Always do your own research and apply responsible risk management.

Killzones (UTC+3) by Roy⏰ Time-Based Division – Trading Quarters:
The trading day is divided into four main quarters, each reflecting distinct market behaviours:
Opo Finance Blog
Quarter Time (Israel Time) Description
Q1 16:30–18:30 Wall Street opening; highest volatility.
Q2 18:30–20:30 Continuation or correction of the opening move.
Q3 20:30–22:30 Quieter market; often characterized by consolidation.
Q4 22:30–24:00 Preparation for market close; potential breakouts or sharp movements.
This framework assists traders in anticipating market dynamics within each quarter, enhancing decision-making by aligning strategies with typical intraday patterns.

Stoch Quad Oscillator📘 Stoch Quad Oscillator – User Guide
✅ Purpose
The Stoch Quad Oscillator is a multi-timeframe stochastic oscillator tool that helps traders detect oversold and overbought conditions, momentum shifts, and quad rotation signals using four distinct stochastic configurations. It includes visual cues, customizable parameters, and background highlights to improve decision-making during trend reversals or momentum surges.
🛠️ Inputs & Parameters
⏱ Timeframe
Timeframe for Stochastic Calculation: Defines which chart timeframe to use for stochastic calculations (default is "1" minute). This enables multi-timeframe analysis while on a lower timeframe chart.
📈 Stochastic Parameters
Four different stochastic configurations are used:
Label %K Length %D Smoothing Notes
K9 D3 9 3 Fastest, short-term view
K14 D3 14 3 Moderately short-term
K40 D4 40 4 Medium-term trend view
K60 D10 60 10 Long-term strength
Smoothing Type: Choose between SMA or EMA to control how smoothed the %D line is.
🎯 Levels
Overbought Level: Default 80
Oversold Level: Default 20
These are used to indicate overextended price conditions on any of the stochastic plots.
🔄 Quad Rotation Detection Settings
When enabled, the script detects synchronized oversold/overbought conditions with strong momentum using all 4 stochastic readings.
Enable Quad Rotation: Toggles detection on or off
Slope Calculation Bars: Number of bars used to calculate slope of %D lines
Slope Threshold: Minimum slope strength for signal (higher = stronger confirmation)
Oversold Quad Level: Total of all four stochastic values that define a quad oversold zone
Overbought Quad Level: Total of all four stochastic values that define a quad overbought zone
Oversold Quad Highlight Color: Background color when oversold quad is triggered
Overbought Quad Highlight Color: Background color when overbought quad is triggered
Slope Averaging Method: Either Simple Average or Weighted Average (puts more weight on higher timeframes)
Max Signal Bar Window: Defines how recent the signal must be to be considered valid
📊 Plots & Visual Elements
📉 Stochastic %D Lines
Each stochastic is plotted separately:
K9 D3 – Red
K14 D3 – Orange
K40 D4 – Fuchsia
K60 D10 – Silver
These help visualize short to long-term momentum simultaneously.
📏 Horizontal Reference Lines
Overbought Line (80) – Red
Oversold Line (20) – Green
These help you identify threshold breaches visually.
🌈 Background Highlighting
The indicator provides background highlights to mark potential signal zones:
✅ All Oversold or Overbought Conditions
When all four stochastics are either above overbought or below oversold:
Bright Red if all are overbought
Bright Green if all are oversold
🚨 Quad Rotation Signal Zones (if enabled)
Triggered when:
The combined sum of all four stochastic levels is extremely low/high (below/above oversoldQuadLevel or overboughtQuadLevel)
The average slope of the 4 %D lines is sharply positive (> slopeThreshold)
Highlights:
Custom Red Tint = Strong overbought quad signal
Custom Green Tint = Strong oversold quad signal
These zones can indicate momentum shifts or reversal potential when used with price action or other tools.
⚠️ Limitations & Considerations
This indicator does not provide trade signals. It visualizes conditions and potential setups.
It is best used in confluence with price action, support/resistance levels, and other indicators.
False positives may occur in ranging markets. Reduce reliance on slope thresholds during low volatility.
Quad signals rely on slope strength, which may lag slightly behind sudden reversals.
🧠 Tips for Use
Combine with volume, MACD, or PSAR to confirm direction before entry.
Watch for divergences between price and any of the stochastics.
Use on higher timeframes (e.g., 5m–30m) to filter for swing trading setups; use shorter TFs (1m–5m) for scalping signals.
Adjust oversoldQuadLevel and overboughtQuadLevel based on market conditions (e.g., in trending vs ranging markets).

Combo RSI + MACD + ADX MTF (Avec Alertes)✅ Recommended Title:
Multi-Signal Oscillator: ADX Trend + DI + RSI + MACD (MTF, Cross Alerts)
✅ Detailed Description
📝 Overview
This indicator combines advanced technical analysis tools to identify trend direction, capture reversals, and filter false signals.
It includes:
ADX (Multi-TimeFrame) for trend and trend strength detection.
DI+ / DI- for directional bias.
RSI + ZLSMA for oscillation analysis and divergence detection.
Zero-Lag Normalized MACD for momentum and entry timing.
⚙️ Visual Components
✅ Green/Red Background: Displays overall trend based on Multi-TimeFrame ADX.
✅ DI+ / DI- Lines: Green and red curves showing directional bias.
✅ Normalized RSI: Blue oscillator with orange ZLSMA smoothing.
✅ Zero-Lag MACD: Violet or fuchsia/orange oscillator depending on the version.
✅ Crossover Points: Colored circles marking buy and sell signals.
✅ ADX Strength Dots: Small black dots when ADX exceeds the strength threshold.
🚨 Included Alert System
✅ RSI / ZLSMA Crossovers (Buy / Sell).
✅ MACD / Signal Line Crossovers (Buy / Sell).
✅ DI+ / DI- Crossovers (Buy / Sell).
✅ Double Confirmation DI+ / RSI or DI+ / MACD.
✅ Double Confirmation DI- / RSI or DI- / MACD.
✅ Trend Change Alerts via Background Color.
✅ ADX Strength Alerts (Above Threshold).
🛠️ Suggested Configuration Examples
1. Short-Term Reversal Detection:
RSI Length: 7 to 14
ZLSMA Length: 7 to 14
MACD Fast/Slow: 5 / 13
ADX MTF Period: 5 to 15
ADX Threshold: 15 to 20
2. Long-Term Trend Following:
RSI Length: 21 to 30
ZLSMA Length: 21 to 30
MACD Fast/Slow: 12 / 26
ADX MTF Period: 30 to 50
ADX Threshold: 20 to 25
3. Scalping / Day Trading:
RSI Length: 5 to 9
ZLSMA Length: 5 to 9
MACD Fast/Slow: 3 / 7
ADX MTF Period: 5 to 10
ADX Threshold: 10 to 15
🎯 Why Use This Tool?
Filters false signals using ADX-based background coloring.
Provides multi-source alerting (RSI, MACD, ADX).
Helps identify true market strength zones.
Works on all markets: Forex, Crypto, Stocks, Indices.

Trailing Cumulative Volume DeltaShort Description:
A dynamic volume delta indicator that calculates a trailing sum of net buying/selling pressure over a user-defined number of recent bars, offering a more adaptive view of order flow momentum compared to fixed-anchor CVD.
Overview:
The Trailing Cumulative Volume Delta (TCVD) indicator provides a powerful way to analyze market sentiment by tracking the net difference between buying and selling volume. Unlike traditional Cumulative Volume Delta (CVD) indicators that typically reset at fixed intervals (e.g., daily, weekly), the TCVD calculates a rolling sum of volume delta over a specified number of recent bars. This "trailing" approach offers a more fluid and responsive measure of recent order flow dynamics.
How it Works:
Per-Bar Delta Calculation: For each bar on your chart, the indicator first calculates the net Volume Delta. This is done by looking at a finer, user-configurable Lower Timeframe (e.g., 1-minute data for a 15-minute chart bar) to determine the aggressive buying vs. selling volume within that bar.
Trailing Sum: The indicator then sums these individual per-bar net deltas over a user-defined Trailing Bars lookback period. For example, if "Trailing Bars" is set to 20, the TCVD value will represent the cumulative net delta of the last 20 bars.
Visualization:
The TCVD is plotted in a "MACD-Columns-Style" in a separate pane.
Teal: When the TCVD value is increasing (suggesting growing net buying pressure or diminishing net selling pressure over the trailing period).
Red: When the TCVD value is decreasing (suggesting growing net selling pressure or diminishing net buying pressure over the trailing period).
White: When it is returning to the mean.
How to Interpret and Use TCVD:
Trend Strength & Momentum:
A rising TCVD suggests that, on average over the trailing period, buying pressure is dominant or strengthening. This can confirm bullish price action or indicate underlying strength.
A falling TCVD suggests that selling pressure is dominant or strengthening, potentially confirming bearish price action or indicating weakness.
Divergences:
Unlike other Divergences, the CVD has two different types of Divergences: a) Absorption and b) Exhaustion. You only want to trade the Absorption pattern.
Zero Line Crossovers:
TCVD crossing above the zero line can indicate a shift towards net positive buying pressure over the lookback period.
TCVD crossing below the zero line can indicate a shift towards net positive selling pressure.
Confirmation: Use TCVD to confirm breakouts or breakdowns. A price breakout accompanied by a strongly rising TCVD is generally more reliable.
Key Settings:
Trailing Bars: (Default: 10)
Determines the number of recent bars to include in the cumulative delta sum.
Shorter periods make the TCVD more responsive to immediate changes.
Longer periods provide a smoother, longer-term view of order flow.
Use custom timeframe: (Checkbox, Default: false)
Allows you to override the automatic selection of the lower timeframe for delta calculation.
Timeframe for Delta Calculation: (Default: "1" - 1 minute)
Specifies the lower timeframe data used to calculate the volume delta for each individual chart bar.
Choosing a very fine timeframe (e.g., seconds) can provide high precision but may be limited by data availability or processing load.
If "Use custom timeframe" is unchecked, the script attempts to choose a sensible default based on your chart's timeframe (e.g., "1S" for second charts, "1" for intraday, "5" for daily, "60" for weekly+).
Examples:
Confirming Breakout Strength:
Price breaks out above a significant resistance level.
If the TCVD is also sharply rising and has perhaps crossed above its zero line, it provides confirmation that strong buying interest is fueling the breakout, increasing confidence in its validity.
Important Notes:
This indicator requires reliable volume data from your broker/data feed to function correctly. If your chart does not have volume, or if the volume data is unreliable, the TCVD will not be accurate.
Like all indicators, TCVD is best used as part of a comprehensive trading strategy, in conjunction with price action analysis and other indicators or tools.
Experiment with the Trailing Bars and Timeframe for Delta Calculation settings to find what best suits your trading style, the asset you are analyzing, and the chart timeframe you are using.
Feel free to modify this, add your personal touch, or include specific screenshots when you publish!

Livermore-Seykota Breakout StrategyStrategy Name: Livermore-Seykota Breakout Strategy
Objective: Execute breakout trades inspired by Jesse Livermore, filtered by trend confirmation (Ed Seykota) and risk-managed with ATR (Paul Tudor Jones style).
Entry Conditions:
Long Entry:
Close price breaks above recent pivot high.
Price is above main EMA (EMA50).
EMA20 > EMA200 (uptrend confirmation).
Current volume > 20-period SMA (volume confirmation).
Short Entry:
Close price breaks below recent pivot low.
Price is below main EMA (EMA50).
EMA20 < EMA200 (downtrend confirmation).
Current volume > 20-period SMA.
Exit Conditions:
Stop-loss: ATR × 3 from entry price.
Trailing stop: activated with offset of ATR × 2.
Strengths:
Trend-aligned entries with volume breakout confirmation.
Dynamic ATR-based risk management.
Inspired by principles of three legendary traders.

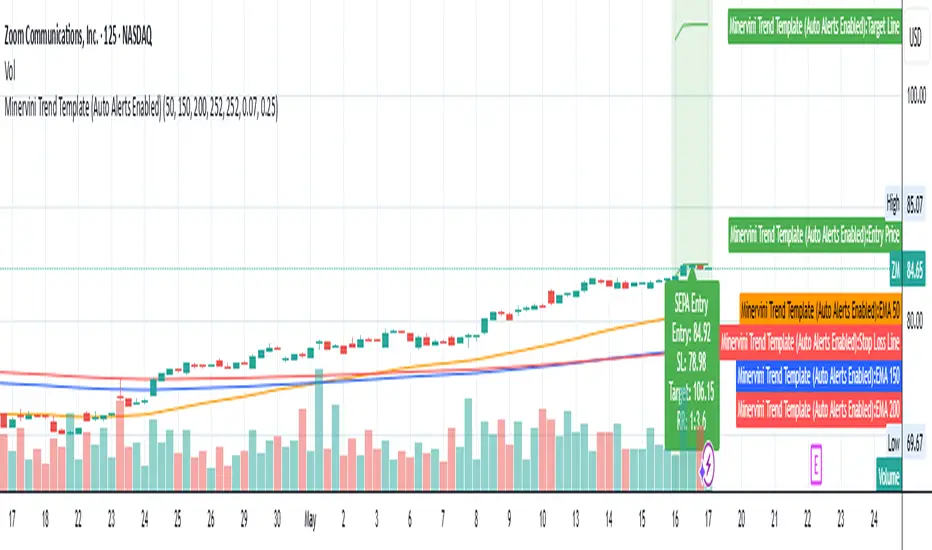
Minervini Trend Template (EMA)📄 Description:
This script is inspired by Mark Minervini’s SEPA (Specific Entry Point Analysis) strategy and adapts his famous Trend Template using Exponential Moving Averages (EMAs). It helps traders visually identify technically strong stocks that are in ideal buy conditions based on Minervini's rules.
📈 Strategy Logic:
This script scans for momentum breakouts by filtering stocks with the following characteristics:
✅ Buy Criteria (All Conditions Must Be Met):
Price above 50-day EMA
Price above 150-day EMA
Price above 200-day EMA
50-day EMA above 150-day EMA
150-day EMA above 200-day EMA
200-day EMA trending upward (greater than it was 20 days ago)
Price within 25% of its 52-week high
Price at least 30% above its 52-week low
If all 8 conditions are satisfied, the script triggers a SEPA Setup Signal. This is visually indicated by:
✅ A green background on the chart
✅ A label saying “SEPA Setup” under the bar
🛒 When to Buy:
Wait for the stock to break out above a recent base or consolidation pattern (like a cup-with-handle or flat base) on strong volume.
The ideal entry is within 5% of the breakout point.
Confirm that the SEPA conditions are met on the breakout day.
📉 When to Sell:
Place a stop-loss 5–8% below your entry price.
Exit if the breakout fails and price falls back below the pivot or the 50-day EMA.
Take partial profits after a 20–25% gain, and move your stop-loss up to breakeven or trail it using moving averages like the 21 or 50 EMA.
Exit fully if price closes below the 50-day or 150-day EMA on volume.
🧠 Why EMAs?
EMAs react faster to recent price action than SMAs, helping you catch earlier signals in fast-moving markets. This makes it especially useful for growth and momentum traders following Minervini’s high-performance approach.
📊 How to Use:
Apply the script to any stock chart (daily timeframe recommended).
Look for a green background + SEPA Setup label.
Combine with price/volume analysis, base patterns, and market context to time your entries.
🚨 Optional Alerts:
You can set an alert on the condition minerviniPass == true to notify you when a SEPA-compliant setup appears.
📚 This tool is meant for educational and research purposes. Always validate with your own due diligence and consult your risk plan before making any trades.
Stochastic RainbowThe Stochastic Rainbow indicator is a multi-layered momentum oscillator designed to provide a comprehensive view of market dynamics by combining multiple stochastic oscillators of varying periods. This approach allows traders to analyze both short-term and long-term momentum within a single visual framework, enhancing decision-making for entries and exits.
🔧 Indicator Settings and Customization
Select from various moving average methods (e.g., SMA, EMA, DEMA, TEMA, WMA, VWMA, RMA, T3) to smooth the stochastic lines. Different methods can affect the responsiveness of the indicator.
The indicator computes five sets of stochastic oscillators with Fibonacci values.
Each %K line is smoothed using the selected moving average type, and a corresponding %D line is plotted for each %K.
🎨 Visual Interpretation
The Stochastic Rainbow indicator plots multiple %K and %D lines, each with distinct colors for easy differentiation.
Additionally, horizontal dotted lines are drawn at levels 80 (Upper Band), 50 (Midline), and 20 (Lower Band) to indicate overbought, neutral, and oversold conditions, respectively.
📈 Trading Strategies Using Stochastic Rainbow
The multi-layered structure of the Stochastic Rainbow allows for nuanced analysis.
Trend Confirmation:
When all %K lines are above 50 and aligned in ascending order (short-term above long-term), it suggests a strong uptrend.
Conversely, when all %K lines are below 50 and aligned in descending order, it indicates a strong downtrend.
Overbought/Oversold Conditions:
If the shorter-term %K lines (e.g., %K 5,3 and %K 8,3) enter the overbought zone (>80) while longer-term lines remain below, it may signal a potential reversal.
Similarly, if shorter-term lines enter the oversold zone (<20) while longer-term lines remain above, it could indicate an upcoming bullish reversal.
Crossovers:
A bullish signal occurs when a %K line crosses above its corresponding %D line.
A bearish signal occurs when a %K line crosses below its corresponding %D line.
Divergence Analysis:
If price makes a new high while the %K lines do not, it may indicate bearish divergence and a potential reversal.
If price makes a new low while the %K lines do not, it may indicate bullish divergence and a potential reversal.
⚙️ Adjusting Settings for Optimal Use
The Stochastic Rainbow's flexibility allows traders to adjust settings to match their trading style and the specific asset's behavior:
Short-Term Trading: Use shorter periods (e.g., 5 for %K) and more responsive moving averages (e.g., WMA, VWMA, EMA, DEMA, TEMA, HMA) to capture quick market movements.
Long-Term Trading: Opt for longer periods (e.g., 55 for %K) and smoother moving averages (e.g., SMA, RMA, T3) to filter out noise and focus on broader trends.
Volatile Markets: Consider using the T3 moving average for its smoothing capabilities, helping to reduce false signals in choppy markets.
By experimenting with different settings, traders can fine-tune the indicator to better suit their analysis and improve decision-making.

Stochastic XThe "Stochastic X" script is a customizable momentum oscillator designed to help traders identify potential overbought and oversold conditions, as well as trend reversals, by analyzing the relationship between a security's closing price and its price range over a specified period. This indicator is particularly useful for traders looking to fine-tune their entry and exit points based on momentum shifts.
🔧 Indicator Settings and Customization
The script offers several user-configurable settings to tailor the indicator to specific trading strategies:
In addition to the source type, %K Period, %D Period, and Signal line periods you can now change moving average calculation for the stochastic and signal lines.
This script allows selection among various moving average methods (e.g., SMA, EMA, WMA, T3) for smoothing the %K and signal lines. Different methods can affect the responsiveness of the indicator.
🎨 Interpreting Background Colors
The script enhances visual analysis by changing the background color of the indicator panel based on the %K line's value:
Green Background: Indicates that the %K line is above 50, suggesting bullish momentum.
Red Background: Signifies that the %K line is below 50, pointing to bearish momentum.
Light Green Overlay: Appears when the %K line exceeds 80, highlighting overbought conditions.
Light Red Overlay: Shows up when the %K line falls below 20, indicating oversold conditions.
These visual cues assist traders in quickly assessing market momentum and potential reversal.
📈 Trading Strategies Using Stochastic X
Traders can utilize the Stochastic X indicator in various ways:
Overbought/Oversold Conditions:
A %K value above 80 may suggest that the asset is overbought, potentially signaling a price correction.
A %K value below 20 could indicate that the asset is oversold, possibly leading to a price rebound.
Signal Line Crossovers:
When the %K line crosses above the signal line, it may be interpreted as a bullish signal.
Conversely, a %K line crossing below the signal line might be seen as a bearish signal.
Divergence Analysis:
If the price makes a new high while the %K line does not, this bearish divergence could precede a price decline.
If the price hits a new low but the %K line forms a higher low, this bullish divergence might signal an upcoming price increase.
Trend Confirmation:
Sustained %K values above 50 can confirm an uptrend.
Persistent %K values below 50 may validate a downtrend.
In this chart, observe how the background colors change in response to the %K line's value, providing immediate visual feedback on market conditions. The crossovers between the %K and signal lines offer potential entry and exit points, while the overbought and oversold overlays help identify possible reversal zones.
⚙️ Adjusting Settings for Optimal Use
The Stochastic X indicator's flexibility allows traders to adjust settings to match their trading style and the specific asset's behavior:
Short-Term Trading: Use shorter periods (e.g., 5 for %K) and more responsive moving averages (e.g., WMA, VWMA, EMA, DEMA, TEMA, HMA) to capture quick market movements.
Long-Term Trading: Opt for longer periods (e.g., 14 for %K) and smoother moving averages (e.g., SMA, RMA, T3) to filter out noise and focus on broader trends.
Volatile Markets: Consider using the T3 moving average for its smoothing capabilities, helping to reduce false signals in choppy markets.
By experimenting with different settings, traders can fine-tune the indicator to better suit their analysis and improve decision-making.

15-Min Opening Range Breakout STEP-BY-STEP RULES
1. Define the Opening Range (OR)
Mark the high and low of the first 15-minute candle of the session.
This creates your Opening Range.
Example: London session opens at 08:00 GMT. Use the 08:00–08:15 candle.
2. Set Entry Triggers
Buy Breakout: Place a Buy Stop order 1 pip above the Opening Range high.
Sell Breakout: Place a Sell Stop order 1 pip below the Opening Range low.
⚠️ Only one side should be triggered. Cancel the opposite order once one is active.
3. Set Stop Loss (SL)
For Buy trades:
SL = Opening Range Low - 2 pips
For Sell trades:
SL = Opening Range High + 2 pips
This ensures you give the price enough space, while keeping risk controlled.
4. Set Take Profit (TP)
Use either of these two approaches:
✅ Fixed Risk-Reward (Preferred)
Target 1: TP = 2R (i.e., 2 × SL distance)
Target 2 (optional): Leave runner for 3R or trail stop behind minor S/R
✅ Fixed Pip Target (alternative)
TP = +50 pips
SL = -20 pips
Matches your preferred risk model of 20 SL / 50 TP
5. Trade Management
If no breakout occurs within 1 hour, cancel the pending orders. No trade that day.
If trade triggers but fails to move, consider time-based exit after 2 hours.
Optional: Move SL to breakeven once price moves 1R in your favor.

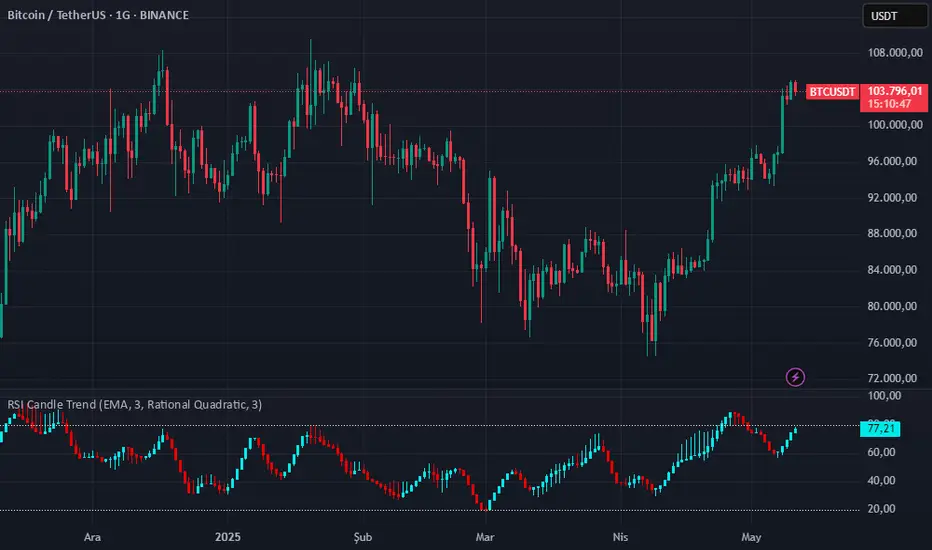
RSI Candle Trend🎯 Purpose:
This TradingView script is designed to visualize trend strength using RSI values as candle data, instead of traditional price candles. It transforms RSI data into custom candles using various smoothing and filtering methods (like Heikin-Ashi, Linear Regression, Rational Quadratic Filter, or McGinley Dynamic). It allows traders to:
📌Track RSI-based momentum using visual candle representation
📌Apply advanced smoothing/filters to the RSI to reduce noise
📌Highlight candle trend strength using dynamic coloring
📌Identify overbought/oversold zones using reference lines (RSI 80 and 20)
🧩 How It Works:
It calculates RSI values for open, high, low, close prices.
These RSI values are then optionally smoothed with user-selected moving averages (EMA, SMA, etc.).
Depending on the selected mode (Normal, Heikin-Ashi, Linear, Rational Quadratic), the RSI values are transformed into synthetic candles.
Candles are colored cyan (uptrend) or red (downtrend) based on RSI movement.
⚙️ Key Inputs:
Method: Type of moving average to smooth the RSI (e.g. EMA, SMA, VWMA, etc.)
Length: Length for RSI and smoothing filters
Candle: Type of candle transformation (Normal, Heikin-Ashi, Linear, Rational Quadratic)
Rational Quadratic: Parameter for the Rational Quadratic smoothing method
📊 Outputs:
Custom candles plotted using RSI-transformed values
Candle colors based on RSI strength:
Cyan for strong bullish RSI movement
Red for strong bearish RSI movement
Horizontal lines at RSI levels 80 and 20 (overbought/oversold)
🧠 Why Use This Indicator?
Unlike traditional RSI indicators that show a line, this tool:
Converts RSI into candle-style visualization
Helps traders visually interpret trend strength, reversals, or continuation patterns
Offers more refined control over RSI behavior and filtering
Provides a unique blend of momentum and candle analysis
❗Important Note:
This script is provided for educational purposes and does not constitute financial advice. Traders and investors should conduct their research and analysis before making any trading decisions.
Money Flow: In & Out Detector[THANHCONG]Indicator Name:
Money Flow: In & Out Detector
Indicator Description:
The Money Flow: In & Out Detector indicator uses technical indicators such as RSI (Relative Strength Index), MFI (Money Flow Index), and volume analysis to determine money inflow and outflow in the market.
This indicator helps traders identify changes in money flow, allowing them to detect buy and sell signals based on the combination of the following factors:
RSI > 50 and MFI > 50: Money inflow, indicating a buy signal.
RSI < 50 and MFI < 50: Money outflow, indicating a sell signal.
Volume increase/decrease relative to the average: Identifies strong market behavior changes.
Adjustable Parameters:
RSI Length: The number of periods to calculate the RSI (default is 14).
MFI Length: The number of periods to calculate the MFI (default is 14).
Volume MA Length: The number of periods to calculate the moving average of volume (default is 20).
Volume Increase/Decrease (%): The percentage threshold for volume change compared to the moving average (default is 20%).
Look Back Period: The number of periods used to identify peaks and troughs (default is 20).
How to Use the Indicator:
Money Inflow: When both RSI and MFI are above 50, and volume increases significantly relative to the moving average, the indicator shows a Buy signal.
Money Outflow: When both RSI and MFI are below 50, and volume decreases significantly relative to the moving average, the indicator shows a Sell signal.
Identifying Peaks and Troughs: The indicator also helps identify market peaks and troughs based on technical conditions.
Note:
This indicator assists in decision-making, but does not replace comprehensive market analysis.
Use this indicator in conjunction with other technical analysis methods to increase the accuracy of trade signals.
Steps for Publishing the Indicator on TradingView:
Log in to TradingView:
Go to TradingView and log into your account.
Access Pine Script Editor:
Click on Pine Editor from the menu under the chart.
Paste your Pine Script® code into the editor window.
Check the Source Code:
Ensure your code is error-free and running correctly.
Review the entire source code and add the MPL-2.0 license notice if necessary.
Save and Publish:
After testing and confirming the code works correctly, click Add to Chart to try the indicator on your chart.
If satisfied with the result, click Publish Script at the top right of the Pine Editor.
Provide a name for the indicator and then enter the detailed description you’ve prepared.
Ensure you specify the MPL-2.0 license in the description if required.
Choose the Access Type:
You can choose either Public or Private access for your indicator depending on your intention.
Submit for Publication:
Wait for TradingView to review and approve your indicator. Typically, this process takes a few working days for verification and approval.
User Guide:
You can share detailed instructions for users on how to use the indicator on TradingView, including how to adjust the parameters and interpret the signals. For example:
Set RSI Length: Experiment with different RSI Length values to find the sensitivity that suits your strategy.
Interpreting In/Out Signals: When there is strong money inflow (In), consider entering a buy order. When there is strong money outflow (Out), consider selling.

IBD Style Candles [tradeviZion]IBD Style Candles - Visualize Price Bars Like the Pros
Transform your chart with institutional-grade IBD-style bars and customizable moving averages for both daily and weekly timeframes. This indicator helps you visualize price action the way professionals at Investors Business Daily do.
What This Indicator Offers:
IBD-style bar visualization (clean, professional appearance)
Customizable coloring based on price movement or previous close
Automatic timeframe detection for appropriate moving averages
Four customizable moving averages for daily timeframes (10, 21, 50, 200)
Four customizable moving averages for weekly timeframes (10, 20, 30, 40)
Options to use SMAs or EMAs with adjustable colors and line widths
"The IBD-style bars provide a cleaner view of price action, allowing you to focus on market structure without the visual noise of traditional candles."
How to Apply the IBD-Style Bars:
On your TradingView chart, select "Bars" as the chart type from the main chart type selection menu (next to the time interval options).
Right-click on the chart and select "Settings".
Go to the "Symbol" tab.
Uncheck the "Thin Bars" option to display thicker bars.
Set the "Up Color" and "Down Color" opacity to 0 for a clean IBD-style appearance.
Enable "IBD-style Candles" from the script's settings.
To revert to the original chart style, repeat the above steps and restore the default settings.
Moving Average Configuration:
The indicator automatically detects your timeframe and displays the appropriate moving averages:
Daily Timeframe Moving Averages:
10-day moving average (SMA/EMA)
21-day moving average (SMA/EMA)
50-day moving average (SMA/EMA)
200-day moving average (SMA/EMA)
Weekly Timeframe Moving Averages:
10-week moving average (SMA/EMA)
20-week moving average (SMA/EMA)
30-week moving average (SMA/EMA)
40-week moving average (SMA/EMA)
Usage Tips:
Enable "Color bars based on previous close" to identify momentum shifts based on prior candle closes
Customize colors to match your chart theme or preference
Enable only the moving averages relevant to your trading strategy
For cleaner charts, reduce the number of visible moving averages
For stock trading, the 10/21/50/200 daily and 10/40 weekly MAs are most commonly used by institutions
// Example configuration for different timeframes
if timeframe.isweekly
// Weekly configuration
showSMA1_Weekly = true // 10-week MA
showSMA4_Weekly = true // 40-week MA
else
// Daily configuration
showMA2_Daily = true // 21-day MA
showMA3_Daily = true // 50-day MA
showMA4_Daily = true // 200-day MA
While the IBD style provides clarity, remember that no visualization method guarantees trading success. Always combine with proper analysis and risk management.
If you found this indicator helpful, please consider leaving a comment or suggestion for future improvements. Happy trading!

SMPivot Gaussian Trend Strategy [Js.K]This open-source strategy combines a Gaussian-weighted moving average with “Smart Money” swing-pivot breaks (BoS = Break-of-Structure) to capture trend continuations and early reversals. It is intended for educational and research purposes only and must not be interpreted as financial advice.
How the logic works
-------------------
1. Gaussian Moving Average (GMA)
• A custom Gaussian kernel (length = 30 by default) smooths price while preserving turning points.
• A second pass (“Smoothed GMA”) further filters noise; only its direction is used for bias.
2. Swing-Pivot detection
• High/Low pivots are found with a symmetric look-back/forward window (Pivot Length = 20).
• The most recent confirmed pivot creates a dynamic structure level (UpdatedHigh / UpdatedLow).
3. Entry rules
Long
• Price closes above the most recent pivot high **and** above Smoothed GMA.
Short
• Price closes below the most recent pivot low **and** below Smoothed GMA.
4. Exit rules
• Fixed stop-loss and take-profit in percent of current price (user-defined).
• Separate parameters and on/off switches for longs and shorts.
5. Visuals
• GMA (dots) and Smoothed GMA (line).
• Structure break lines plus “BoS PH/PL” labels at the midpoint between pivot and break.
Inputs
------
Gaussian
• Gaussian Length (default 30) – smoothing window.
• Gaussian Scatterplot – toggle GMA dots.
Smart-Money Pivot
• Pivot Length (default 20).
• Bull / Bear colors.
Risk settings
• Long / Short enable.
• Individual SL % and TP % (default 1 % SL, 30 % TP).
• Strategy uses percent-of-equity sizing; initial capital defaults to 10 000 USD.
Adjust these to reflect your own account size, realistic commission and slippage.
Best practice & compliance notes
--------------------------------
• Test on a data sample that yields ≥ 100 trades to obtain statistically relevant results.
• Keep risk per trade below 5–10 % of equity; the default values comply with this guideline.
• Explain any custom settings you publish that differ from the defaults.
• Do **not** remove the code header or licence notice (MPL-2.0).
• Include realistic commission and slippage in your back-test before publishing.
• The script does **not** repaint; orders are processed on bar close.
Usage
-----
1. Add the script to any symbol / timeframe; intraday and swing timeframes both work—adjust lengths accordingly.
2. Configure SL/TP and position size to match your personal risk management.
3. Run “List of trades” and the performance summary to evaluate expectancy; forward-test before live use.
Disclaimer
----------
Trading involves substantial risk. Past performance based on back-testing is not necessarily indicative of future results. The author is **not** responsible for any financial losses arising from the use of this script.

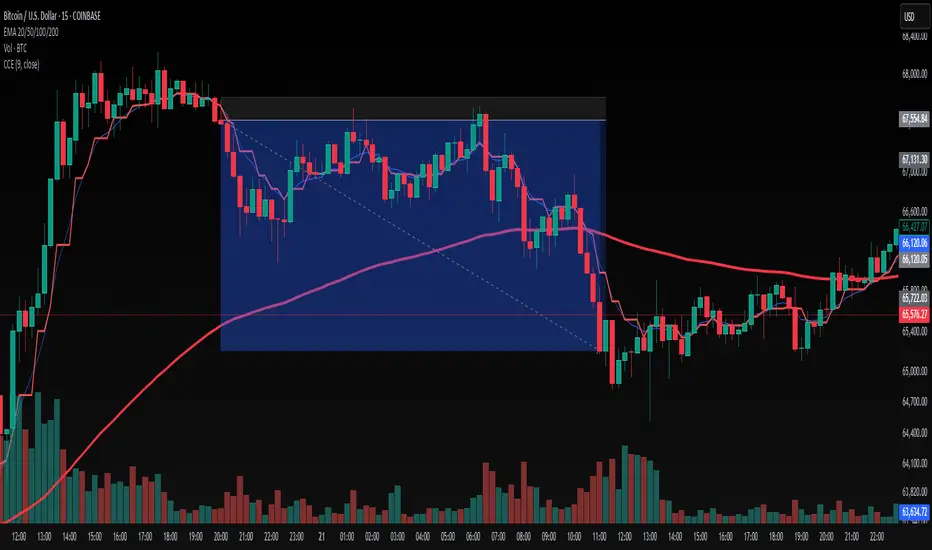
Closest Candle to EMA (CCE)🔍 Closest Candle to EMA (CCE)
The Closest Candle to EMA (CCE) indicator is a visual analytical tool designed to identify the historical price (candle close) that is closest to the current Exponential Moving Average (EMA) over a user-defined period. This allows traders to easily detect how price has interacted with the trend line recently, providing insights into potential mean reversion, support/resistance, and price convergence behavior.
📌 Key Features
✅ Highlights the candle with a closing price closest to the current EMA
✅ Customizable EMA length for various trading styles and timeframes
✅ Helps detect potential zones of trend interaction
✅ Supports analysis of price behavior near dynamic support/resistance
✅ Lightweight and non-intrusive visual overlay (red = closest price, blue = EMA)
🧠 How It Works
The script calculates the EMA using the user-defined length (default: 20).
It then scans the last N candles (equal to the EMA length) and finds the one whose closing price is closest to the current EMA value.
That close is highlighted in red, while the EMA is shown in blue.
This comparison helps traders understand the proximity of past price action to the current trend level.
💡 Use Cases
Mean Reversion Strategies – Spot when price historically reverts to the trend
Dynamic Support/Resistance Identification – Find levels where price respected or returned to the EMA
Consolidation Zone Analysis – Identify areas where price hovered around trend lines
Backtesting Trend Sensitivity – See how price reacted to EMA over time
⚙️ Settings
EMA Length – Set the number of periods used for EMA and comparison window (default: 20)
📊 Example Strategy Setup – EMA Touch with Reversal Candle
This indicator can be incorporated into a price-action strategy that combines candlestick patterns, EMA proximity, and volume confirmation. Here's a practical use case:
🔧 Note: This setup is designed specifically with the EMA length set to 9.
🔁 Bullish Setup – Hammer + EMA (in uptrend)
The market is in an uptrend, confirmed by EMA(9) sloping upward
A Hammer candlestick forms
The EMA (blue) must touch the lower shadow (wick) of the Hammer
It must not touch the candle body
Candle volume is above average
→ ✅ This may signal a bullish continuation opportunity
🔁 Bearish Setup – Shooting Star + EMA (in downtrend)
The market is in a downtrend, confirmed by EMA(9) sloping downward
A Shooting Star candlestick forms
The EMA (blue) must touch the upper shadow (wick) of the candle
It must not touch the candle body
Candle volume is above average