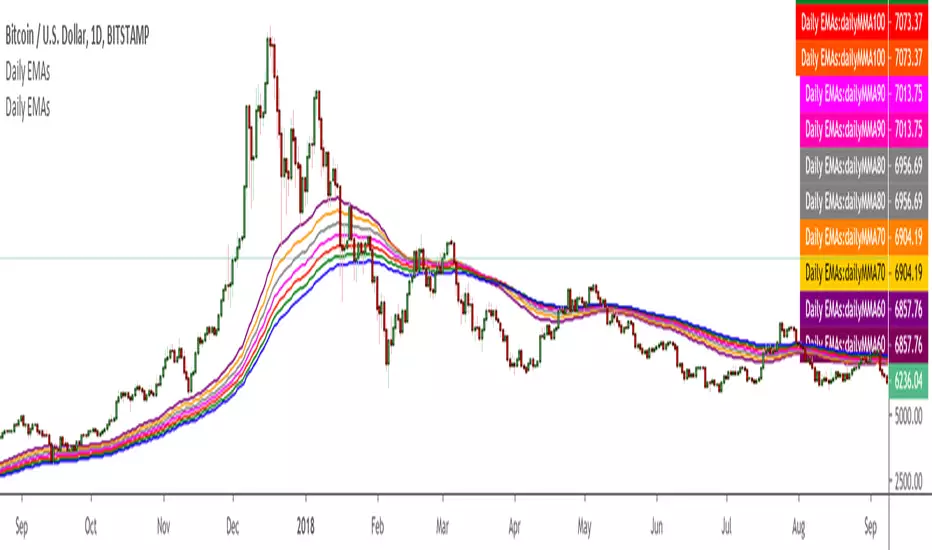
[BA] Multi Time Frame Moving Averages for BTCThis is a multi time frame moving average script. It includes 7 moving averages. Most of them are SMAs and WMAs but EMA were also used. Time frame was set to 1 day. It means that you can change the time frame of your chart freely without losing your lines. Levels will not change.
I wrote this script just to trade BTC. I prefer daily and weekly charts with this script but lower time frames are also preferable.
Since some of the lengths are too high; older exchanges are recommended due to their relatively deep historical data.
While MA1 is for taking actions like 'take profit' or 'stop loss' or just to follow 'price action' easily, other MAs are for seeing supports and resistances.
MA6 and MA7 are disabled by default in order to minimize the confusion but you can enable them from settings if you need to.
Since some newer exchanges have less historical data, you may not see MA4 and MA5 on the daily chart. In such circumstances MA6 and MA7 might be helpful to use as substitution. Some may like to use all of them.
I am using this script just for BTC but it can be useful for other coins as well.
在脚本中搜索"BTC"

VBF Trader PRO for BTC and altcoins with LONG and SHORT alertsThis script allows you to catch trend moves between BB critical levels (red and green zones on the chart) and very good for daily scalping ether for bitcoin or any altcoins to USDT or BTC trading pairs. Probability is very HIGH.

Cruzamento de MM para BTC 5MSão 3 médias móveis simples.
- 9 períodos
- 21 períodos
-105 períodos
A intenção desse estudo é me dar sinais para compra quando ocorre um cruzamento da média de 9 períodos com a de 21, somente dando o sinal se o cruzamento ocorrer acima da média de 105 períodos. Para sinais de venda segue-se o mesmo raciocínio, quando a média de 9 períodos cruzar com a de 21 e estiver nesse caso abaixo da média de 105 períodos.
O que eu tenho usado e tem dado bons resultados com o BTC 5M desde o início de julho, principalmente naquelas bart formations, é utilizar apenas o primeiro sinal de venda ou de compra após o cruzamento da média de 105
O sinal que se dá para compra seria o círculo verde
O sinal que se dá para vendas seria o círculo vermelho
Este indicador tem o propósito de eu testar a efetividade de um sistema desses.

Fully Adjustable BTC Longs/ShortsThis indicator shows you Bitfinex Longs&Shorts charts in one handy indicator. It's fully adjustable to your own prefference.
Tipjar : 38uGQJDDZDL6wX48x4gYTccPeQ3ZHVYmY4 (btc)

CME & XBT - BTC Futures Settlement DatesHi everyone
This in an indicator inspired by Scarrff
I added the XBT quarterly and yearly settlement dates
Enjoy
David

Multiple EMA Daily (60->120) - BTC bull market supportThis script shows areas of strong support during a BTC bull market.
Total Volume for BTC or ETHBITMEX:ETHUSD BITSTAMP:BTCUSD Script includes cumulative Bitcoin volume from exchanges such as Binance, Bitfinex, Bithumb, Coinbase and more
As default, volume is shown based on the number of Bitcoin moved
If volume increases day over day the color will be blue, if it dereases the color will be red. This is not related to price
You can currently switch between ETH or BTC by putting those abbreviations in on the settings inputs
You can also switch to a USD output
You can remove Bitmex data as this exchange is highly leveraged contracts, default includes Bitmex data
Some delays in loading as the indicator pulls data from multiple exchanges
Future updates may include availability of other coins or additional exchanges added

Coinpirate Channels BTCFrom a request to simplify the chart, here we have an easy to read map. It's built on calculated price forecast, math, geometry, historical movement, and fundamentals. Enjoy and invest wisely.
NOT INVESTMENT ADVICE. For educational and learning purposes only. BTCUSD -0.30% Bitcoin -0.30% BTC -0.30%


BTC Volume IndexBTC volume index for all BFX, GDAX, Stamp, Kraken, and Bitflyer. Also includes an overlay of the volume of the underlying asset (assumed to be BTC at whichever exchange you're viewing.
Happii Trades

Volume in BTCThis is an experimental script i made for tracking volume in BTC on poloniex pairs. I am not a developer, i hardly even know how to code, so im sure there is a better way! I shared the script on request from someone else. I made the line 100% transparant because i only want the number in the top left. Have a nice day.

BTC Halving Cycle SignalsBTC Halving Cycle Signals
What signals does this script give in real history (2011-2025):
2015 → BUY (bear market bottom)
2019 → BUY (post-2018 bottom)
October 2020 → BUY
November 2023 → BUY
And right now (Nov 2025) → green bottom + price above weekly EMA200 → about to give a buy signal if it breaks $72k strongly.
BUY signal: ~500 days pre-halving + price > weekly EMA200 + monthly RSI <60 (accumulation).
SELL signal: ~1064 days post-halving + RSI >75 or close < SuperTrend (distribution).
Hardcoded halving dates (can be edited). Works on BTCUSD weekly/monthly, gives 1-2 signals per cycle.

BTC Power-Law Support 2025BTC Power-Law Calculation by Robert.
Shaded area resembles an uncertainty calculation.
Extrapolated data (in the future) only works in the daily chart.
Disclaimer: This is my own calculation and no investing advice! Use at your own risk.

BTC LL->HH Liquidity Sweep / BOS / Retest / 4H Bias v6_8BTC LL->HH Liquidity Sweep / BOS / Retest / 4H Bias v6_8

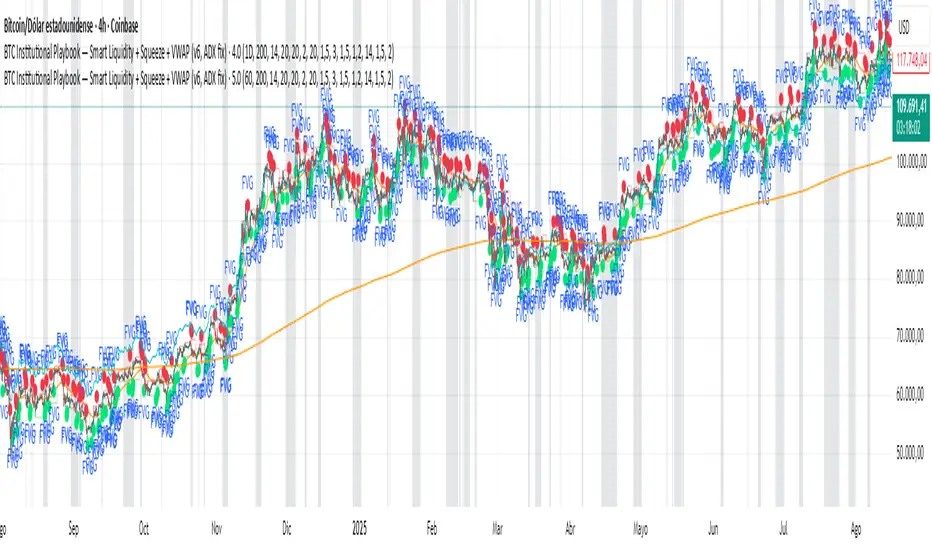
BTC Institutional Playbook Smart Liquidity + SqueezeBTC Institutional Playbook — Smart Liquidity + Squeeze + VWAP (v6, ADX fix)
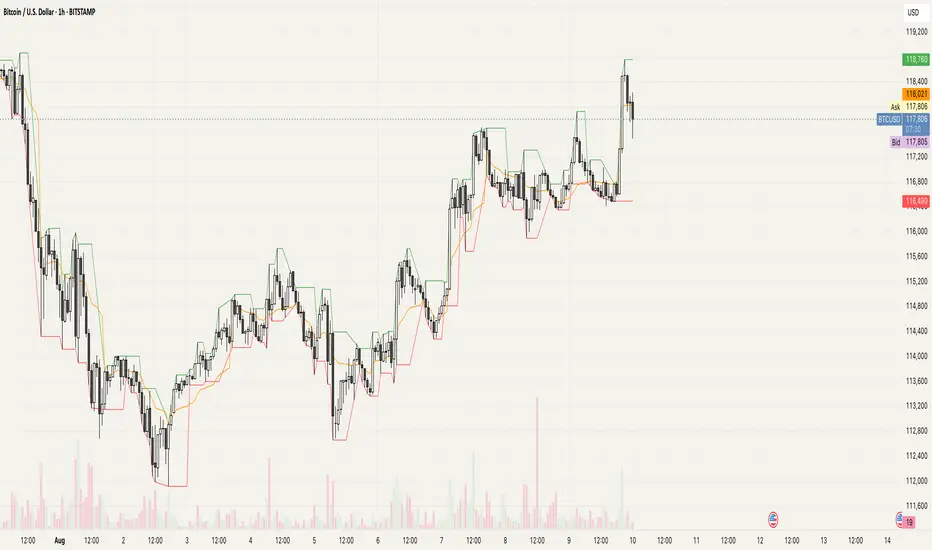
BTC Multi-Session Open Breakout with Dynamic Sensitivitybtc tool using algo detection and a dynamic sensitivity tool to avoid breakouts and see-saw action. First draft.
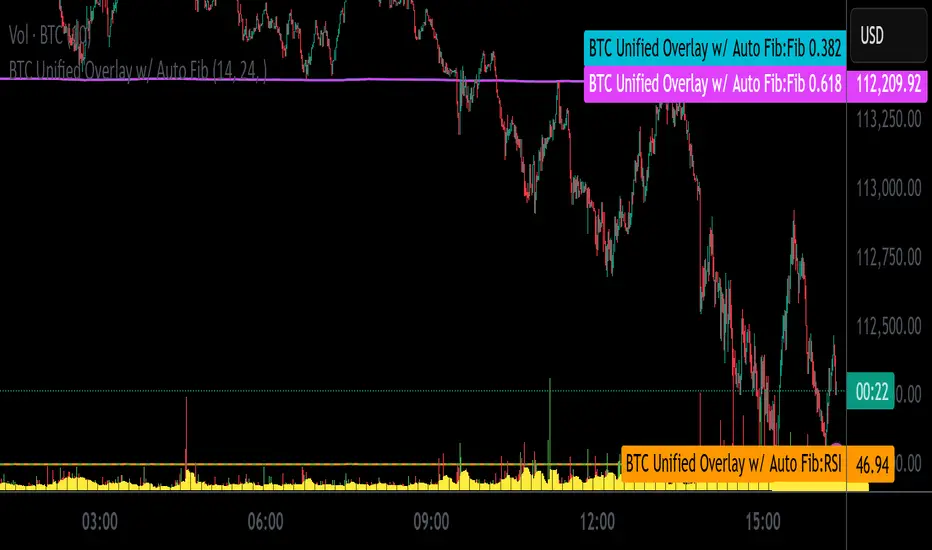
BTC Unified Overlay w/ Auto FibBTC Unified Overlay w/ Auto Fib, RSI, VWAP & Volume
This overlay combines essential indicators into one visual script designed for Bitcoin (BTCUSD) trading on lower timeframes:
🔁 Auto Fibonacci Zones – Auto-detects 0.382 and 0.618 retracement levels using recent price swings
🎯 RSI(14) – Includes cluster and crossover tagging for overbought/oversold zones
📊 Volume Histogram with 10-bar Moving Average – Highlights breakout bars
📏 VWAP with ±1SD and ±2SD Bands – Shows dynamic fair value range
🟢 Breakout Signal Tagging – Detects high-volume breakout opportunities
Ideal for traders who want a unified, color-coded visualization of key momentum and structure indicators.
Script optimized for screenshot automation and compatible with external webhook pipelines.
BTC Momentum Detector 1h# BTC Momentum Detector 1h
This indicator is designed to detect significant momentum movements in Bitcoin price on the 1-hour timeframe. It identifies candles with percentage changes within a specific range, which often precede larger price movements.
## How It Works
The indicator analyzes price movements to detect potential momentum shifts:
- Identifies candles with percentage changes between configurable thresholds (default: 1.7% - 2.8%)
- Requires neutral or inverse movement in the prior candle to avoid false signals
- Optional volume filter ensures signals are confirmed by above-average trading activity
- Tracks price continuation to calculate success rates and average returns
## Key Features
- **Signal Detection**: Green triangles below price bars indicate upward momentum signals; red triangles above price bars indicate downward momentum signals
- **Continuation Tracking**: Dashed horizontal lines show the entry price levels of active signals being tracked
- **Statistics Panel**: Displays real-time metrics including signal counts, success rates, and average returns
- **Current Status**: Shows the current price change percentage and active signals being monitored
## Parameters
- **Minimum Percentage Threshold**: Minimum price change to trigger a signal (default: 1.7%)
- **Maximum Percentage Threshold**: Maximum price change to filter out extreme moves (default: 2.8%)
- **Continuation Periods**: Number of periods to track after signal (default: 2)
- **Require Prior Neutral/Inverse**: Filters signals by requiring neutral or opposite prior movement
- **Neutral Threshold**: Defines what's considered a neutral movement (default: 0.1%)
- **Volume Filter**: Option to require above-average volume for confirmation
- **Volume Multiplier**: Volume must exceed average by this factor (default: 2x)
## Strategy Concept
The underlying strategy is based on the concept that when Bitcoin makes a controlled, significant move (not too small, not too large) after a period of neutral or opposite movement, it often continues in that direction for the next few periods. This pattern reflects the early stages of momentum development in the market.

BTC Trendline Patterns with Signals BTC Trendline Patterns with Signals
This custom Pine Script indicator automatically detects key pivot points in Bitcoin price action and draws support and resistance trendlines. The indicator provides buy (long) and sell (short) signals when these trendlines are broken. This can help traders identify potential breakout opportunities and trend reversals based on established price levels.
Features:
Pivot Point Detection: Automatically identifies pivot highs and lows in the price chart, based on customizable parameters (Pivot Left and Pivot Right).
Support and Resistance Trendlines: Draws trendlines based on the identified pivot points. These lines represent significant price levels where price may experience support or resistance.
Breakout Signals: Provides buy (long) and sell (short) signals when the price breaks above the resistance trendline (for buy signals) or below the support trendline (for sell signals).
Customizable Pivot Lengths: Adjust the number of bars considered for determining pivot points using the Pivot Left and Pivot Right input parameters.
How it Works:
Pivot Detection: The script identifies the highest high (pivotHigh) and the lowest low (pivotLow) within a specific range of bars (defined by Pivot Left and Pivot Right).
Trendline Plotting: Once pivots are detected, the script draws resistance (red) and support (green) trendlines connecting the most recent pivots. These trendlines act as dynamic support and resistance levels.
Breakout Signals: The script generates signals:
BUY (Long): Triggered when the price breaks above the most recent resistance trendline.
SELL (Short): Triggered when the price breaks below the most recent support trendline.
Parameters:
Pivot Left: Number of bars to the left of the pivot point to consider.
Pivot Right: Number of bars to the right of the pivot point to consider.
Line Width: Customizable line width for drawing trendlines.
Ideal Use:
Timeframes: This indicator works well on timeframes ranging from 1-minute to daily charts. For best results, use it on 1-hour, 4-hour, or daily charts.
Strategy: Ideal for breakout traders or trend-following strategies. Use it to identify potential entry points when price breaks key levels of support or resistance.
Example Use Case:
Swing Traders: Traders looking for potential breakouts can use this script to identify key levels in the market and wait for the price to break through resistance for a long trade or support for a short trade.
Day Traders: For those looking to enter and exit trades in a single day, this indicator can help pinpoint areas of support and resistance, and provide actionable signals when price breaks those levels.
Disclaimer:
This script is not a guarantee of success and should be used in conjunction with other technical analysis tools. Always perform additional research and backtesting before live trading.
Important Notes:
The pivot points and trendlines may adjust dynamically as the price evolves. Adjust the pivot settings to suit the volatility and timeframe of the market you're trading.
This indicator works best when combined with other indicators such as volume, RSI, or MACD for confirmation.
How to Use:
Add the indicator to your chart.
Adjust the Pivot Left and Pivot Right parameters to fine-tune the pivot point detection.
Monitor for trendline breakouts. When the price breaks above the resistance line, a BUY signal will appear. When the price breaks below the support line, a SELL signal will appear.
Use the signals to enter trades at the right moment.
Final Notes:
If you're submitting to TradingView for publishing, keep your description clear and informative, but also concise. Traders need to quickly understand how your indicator works, what parameters they can adjust, and how it might fit into their trading strategy.
