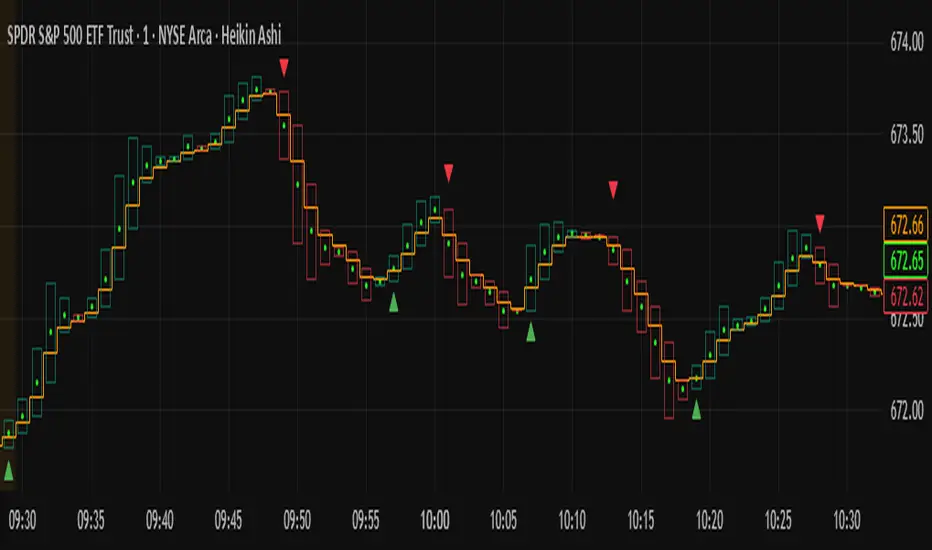
Trend Structure ★★ with Buy/Sell Signals (offset labels)Got it — here’s a more **expanded, publication‑ready description** for your *Trend Structure ★★ with Buy/Sell Signals (offset labels)* indicator. I’ve kept it professional, clear, and engaging so it works well on TradingView’s public library:
---
**Trend Structure ★★ with Buy/Sell Signals (offset labels)**
This indicator is designed to give traders a structured view of market momentum by combining **short‑term (25 EMA)** and **long‑term (90 EMA)** exponential moving averages. It plots dual EMA bands on the chart, with shaded zones that visually highlight when price is trading outside of these ranges — making it easier to identify periods of strength, weakness, or potential exhaustion.
Beyond simple trend tracking, the script automatically generates **BUY** and **SELL** labels at key crossover points between price and the short‑term EMAs. These signals are intelligently offset using ATR‑based spacing, ensuring labels remain clear and uncluttered, even during volatile price action. This makes the chart more readable while still delivering actionable insights.
The indicator also includes a **title marker** for quick reference and a clean, color‑coded design that distinguishes short‑term and long‑term structures at a glance. By combining visual clarity with practical signal generation, this tool helps traders:
- Spot emerging trends early through EMA crossovers
- Confirm longer‑term momentum with dual EMA bands
- Receive uncluttered, offset Buy/Sell signals for better decision‑making
- Maintain a clean chart layout without sacrificing detail
Whether you’re a trend‑follower looking for confirmation, or a swing trader seeking timely entries and exits, this indicator provides a balanced mix of **structure, clarity, and actionable signals** to support your trading workflow.
在脚本中搜索"Buy sell"

LEGEND IsoPulse Fusion Universal Volume Trend Buy Sell RadarLEGEND IsoPulse Fusion • Universal Volume Trend Buy Sell Radar
One line summary
LEGEND IsoPulse Fusion reads intent from price and volume together, learns which features matter most on your symbol, blends them into a single signed Fusion line in a stable unit range, and emits clear Buy Sell Close events with a structure gate and a liquidity safety gate so you act only when the tape is favorable.
What this script is and why it exists
Many traders keep separate windows for trend, volume, volatility, and regime filters. The result can feel fragmented. This script merges two complementary engines into one consistent view that is easy to read and simple to act on.
LEGEND Tensor estimates directional quality from five causally computed features that are normalized for stationarity. The features are Flow, Tail Pressure with Volume Mix, Path Curvature, Streak Persistence, and Entropy Order.
IsoPulse transforms raw volume into two decaying reservoirs for buy effort and sell effort using body location and wick geometry, then measures price travel per unit volume for efficiency, and detects volume bursts with a recency memory.
Both engines are mapped into the same unit range and fused by a regime aware mixer. When the tape is orderly the mixer leans toward trend features. When the tape is messy but a true push appears in volume efficiency with bursts the mixer allows IsoPulse to speak louder. The outcome is a single Fusion line that lives in a familiar range with calm behavior in quiet periods and expressive pushes when energy concentrates.
What makes it original and useful
Two reservoir volume split . The script assigns a portion of the bar volume to up effort and down effort using body location and wick geometry together. Effort decays through time using a forgetting factor so memory is present without becoming sticky.
Efficiency of move . Price travel per unit volume is often more informative than raw volume or raw range. The script normalizes both sides and centers the efficiency so it becomes signed fuel when multiplied by flow skew.
Burst detection with recency memory . Percent rank of volume highlights bursts. An exponential memory of how recently bursts clustered converts isolated blips into useful context.
Causal adaptive weighting . The LEGEND features do not receive static weights. The script learns, causally, which features have correlated with future returns on your symbol over a rolling window. Only positive contributions are allowed and weights are normalized for interpretability.
Regime aware fusion . Entropy based order and persistence create a mixer that blends IsoPulse with LEGEND. You see a single line rather than two competing panels, which reduces decision conflict.
How to read the screen in seconds
Fusion area . The pane fills above and below zero with a soft gradient. Deeper fill means stronger conviction. The white Fusion line sits on top for precise crossings.
Entry guides and exit guides . Two entry guides draw symmetrically at the active fused entry level. Two exit guides sit inside at a fraction of the entry. Think of them as an adaptive envelope.
Letters . B prints once when the script flips from flat to long. S prints once when the script flips from flat to short. C prints when a held position ends on the appropriate side. T prints when the structure gate first opens. A prints when the liquidity safety flag first appears.
Price bar paint . Bars tint green while long and red while short on the chart to mirror your virtual position.
HUD . A compact dashboard in the corner shows Fusion, IsoPulse, LEGEND, active entry and exit levels, regime status, current virtual position, and the vacuum z value with its avoid threshold.
What signals actually mean
Buy . A Buy prints when the Fusion line crosses above the active entry level while gates are open and the previous state was flat.
Sell . A Sell prints when the Fusion line crosses below the negative entry level while gates are open and the previous state was flat.
Close . A Close prints when Fusion cools back inside the exit envelope or when an opposite cross would occur or when a gate forces a stop, and the previous state was a hold.
Gates . The Trend gate requires sufficient entropy order or significant persistence. The Avoid gate uses a liquidity vacuum z score. Gates exist to protect you from weak tape and poor liquidity.
Inputs and practical tuning
Every input has a tooltip in the script. This section provides a concise reference that you can keep in mind while you work.
Setup
Core window . Controls statistics across features. Scalping often prefers the thirties or low fifties. Intraday often prefers the fifties to eighties. Swing often prefers the eighties to low hundreds. Smaller responds faster with more noise. Larger is calmer.
Smoothing . Short EMA on noisy features. A small value catches micro shifts. A larger value reduces whipsaw.
Fusion and thresholds
Weight lookback . Sample size for weight learning. Use at least five times the horizon. Larger is slower and more confident. Smaller is nimble and more reactive.
Weight horizon . How far ahead return is measured to assess feature value. Smaller favors quick reversion impulses. Larger favors continuation.
Adaptive thresholds . Entry and exit levels from rolling percentiles of the absolute LEGEND score. This self scales across assets and timeframes.
Entry percentile . Eighty selects the top quintile of pushes. Lower to seventy five for more signals. Raise for cleanliness.
Exit percentile . Mid fifties keeps trades honest without overstaying. Sixty holds longer with wider give back.
Order threshold . Minimum structure to trade. Zero point fifteen is a reasonable start. Lower to trade more. Raise to filter chop.
Avoid if Vac z . Liquidity safety level. One point two five is a good default on liquid markets. Thin markets may prefer a slightly higher setting to avoid permanent avoid mode.
IsoPulse
Iso forgetting per bar . Memory for the two reservoirs. Values near zero point nine eight to zero point nine nine five work across many symbols.
Wick weight in effort split . Balance between body location and wick geometry. Values near zero point three to zero point six capture useful behavior.
Efficiency window . Travel per volume window. Lower for snappy symbols. Higher for stability.
Burst percent rank window . Window for percent rank of volume. Around one hundred to three hundred covers most use cases.
Burst recency half life . How long burst clusters matter. Lower for quick fades. Higher for cluster memory.
IsoPulse gain . Pre compression gain before the atan mapping. Tune until the Fusion line lives inside a calm band most of the time with expressive spikes on true pushes.
Continuation and Reversal guides . Visual rails for IsoPulse that help you sense continuation or exhaustion zones. They do not force events.
Entry sensitivity and exit fraction
Entry sensitivity . Loose multiplies the fused entry level by a smaller factor which prints more trades. Strict multiplies by a larger factor which selects fewer and cleaner trades. Balanced is neutral.
Exit fraction . Exit level relative to the entry level in fused unit space. Values around one half to two thirds fit most symbols.
Visuals and UX
Columns and line . Use both to see context and precise crossings. If you present a very clean chart you can turn columns off and keep the line.
HUD . Keep it on while you learn the script. It teaches you how the gates and thresholds respond to your market.
Letters . B S C T A are informative and compact. For screenshots you can toggle them off.
Debug triggers . Show raw crosses even when gates block entries. This is useful when you tune the gates. Turn them off for normal use.
Quick start recipes
Scalping one to five minutes
Core window in the thirties to low fifties.
Horizon around five to eight.
Entry percentile around seventy five.
Exit fraction around zero point five five.
Order threshold around zero point one zero.
Avoid level around one point three zero.
Tune IsoPulse gain until normal Fusion sits inside a calm band and true squeezes push outside.
Intraday five to thirty minutes
Core window around fifty to eighty.
Horizon around ten to twelve.
Entry percentile around eighty.
Exit fraction around zero point five five to zero point six zero.
Order threshold around zero point one five.
Avoid level around one point two five.
Swing one hour to daily
Core window around eighty to one hundred twenty.
Horizon around twelve to twenty.
Entry percentile around eighty to eighty five.
Exit fraction around zero point six zero to zero point seven zero.
Order threshold around zero point two zero.
Avoid level around one point two zero.
How to connect signals to your risk plan
This is an indicator. You remain in control of orders and risk.
Stops . A simple choice is an ATR multiple measured on your chart timeframe. Intraday often prefers one point two five to one point five ATR. Swing often prefers one point five to two ATR. Adjust to symbol behavior and personal risk tolerance.
Exits . The script already prints a Close when Fusion cools inside the exit envelope. If you prefer targets you can mirror the entry envelope distance and convert that to points or percent in your own plan.
Position size . Fixed fractional or fixed risk per trade remains a sound baseline. One percent or less per trade is a common starting point for testing.
Sessions and news . Even with self scaling, some traders prefer to skip the first minutes after an open or scheduled news. Gate with your own session logic if needed.
Limitations and honest notes
No look ahead . The script is causal. The adaptive learner uses a shifted correlation, crosses are evaluated without peeking into the future, and no lookahead security calls are used. If you enable intrabar calculations a letter may appear then disappear before the close if the condition fails. This is normal for any cross based logic in real time.
No performance promises . Markets change. This is a decision aid, not a prediction machine. It will not win every sequence and it cannot guarantee statistical outcomes.
No dependence on other indicators . The chart should remain clean. You can add personal tools in private use but publications should keep the example chart readable.
Standard candles only for public signals . Non standard chart types can change event timing and produce unrealistic sequences. Use regular candles for demonstrations and publications.
Internal logic walkthrough
LEGEND feature block
Flow . Current return normalized by ATR then smoothed by a short EMA. This gives directional intent scaled to recent volatility.
Tail pressure with volume mix . The relative sizes of upper and lower wicks inside the high to low range produce a tail asymmetry. A volume based mix can emphasize wick information when volume is meaningful.
Path curvature . Second difference of close normalized by ATR and smoothed. This captures changes in impulse shape that can precede pushes or fades.
Streak persistence . Up and down close streaks are counted and netted. The result is normalized for the window length to keep behavior stable across symbols.
Entropy order . Shannon entropy of the probability of an up close. Lower entropy means more order. The value is oriented by Flow to preserve sign.
Causal weights . Each feature becomes a z score. A shifted correlation against future returns over the horizon produces a positive weight per feature. Weights are normalized so they sum to one for clarity. The result is angle mapped into a compact unit.
IsoPulse block
Effort split . The script estimates up effort and down effort per bar using both body location and wick geometry. Effort is integrated through time into two reservoirs using a forgetting factor.
Skew . The reservoir difference over the sum yields a stable skew in a known range. A short EMA smooths it.
Efficiency . Move size divided by average volume produces travel per unit volume. Normalization and centering around zero produce a symmetric measure.
Bursts and recency . Percent rank of volume highlights bursts. An exponential function of bars since last burst adds the notion of cluster memory.
IsoPulse unit . Skew multiplied by centered efficiency then scaled by the burst factor produces the raw IsoPulse that is angle mapped into the unit range.
Fusion and events
Regime factor . Entropy order and streak persistence form a mixer. Low structure favors IsoPulse. Higher structure favors LEGEND. The blend is convex so it remains interpretable.
Blended guides . Entry and exit guides are blended in the same way as the line so they stay consistent when regimes change. The envelope does not jump unexpectedly.
Virtual position . The script maintains state. Buy and Sell require a cross while flat and gates open. Close requires an exit or force condition while holding. Letters print once at the state change.
Disclosures
This script and description are educational. They do not constitute investment advice. Markets involve risk. You are responsible for your own decisions and for compliance with local rules. The logic is causal and does not look ahead. Signals on non standard chart types can be misleading and are not recommended for publication. When you test a strategy wrapper, use realistic commission and slippage, moderate risk per trade, and enough trades to form a meaningful sample, then document those assumptions if you share results.
Closing thoughts
Clarity builds confidence. The Fusion line gives a single view of intent. The letters communicate action without clutter. The HUD confirms context at a glance. The gates protect you from weak tape and poor liquidity. Tune it to your instrument, observe it across regimes, and use it as a consistent lens rather than a prediction oracle. The goal is not to trade every wiggle. The goal is to pick your spots with a calm process and to stand aside when the tape is not inviting.

DASM CODE BUY/SELL EMASimple, Just Buy/Sell
For scalping, it’s best used during high-volume hours (9:30–11:00 New York time).
TOP-RSI Double Confirm + Heiken Ashi + Buy/Sell Labels v01📊 RSI Double Confirm + Heiken Ashi + Labels
🔎 Concept
This indicator combines a Zero-based RSI filter with strict candle close confirmation, overlays Heiken Ashi candles for clearer trend visualization, and adds Buy/Sell labels directly on the chart for easier interpretation.
⚙️ Components
1. RSI Double Confirm
RSI is calculated from OHLC4 (open+high+low+close)/4.
The RSI value is shifted by -50 to center it around zero (above 0 = bullish, below 0 = bearish).
Uses user-defined thresholds: Overbought (OB) and Oversold (OS).
📌 Entry conditions:
Buy Signal → RSI crosses upward through OS and the last closed candle is higher than the previous candle.
Sell Signal → RSI crosses downward through OB and the last closed candle is lower than the previous candle.
2. Heiken Ashi Candles
Custom Heiken Ashi values are calculated: haOpen, haClose, haHigh, haLow.
Candles are colored green (if haClose > haOpen) or red (if haClose < haOpen).
Helps smooth price action and highlight trend direction.
3. Alerts
alertcondition is set for both Buy and Sell signals.
Users can create TradingView alerts that trigger whenever a new signal appears.
4. Signals & Labels
A green up arrow is plotted under the candle when a Buy signal is triggered.
A red down arrow is plotted above the candle when a Sell signal is triggered.
Additionally, labels ("Buy" or "Sell") are added at the respective candle to make signals more visible.
📝 How to Use
Add the indicator to your chart (it overlays directly on price).
Adjust inputs:
OB (Overbought) → e.g. 20
OS (Oversold) → e.g. -20
RSI Length → e.g. 7
Watch for signals:
Buy Signal → Green arrow + "Buy" label → potential bullish entry.
Sell Signal → Red arrow + "Sell" label → potential bearish entry.
Set up alerts in TradingView to be notified when new signals appear.
✅ Benefits
Combines RSI confirmation + Heiken Ashi trend filter + Clear chart labels.
Reduces false signals by requiring both RSI cross and strict close confirmation.
Easy to interpret visually with arrows and text labels.
⚠️ Notes
This indicator is meant as a signal confirmation tool, not a standalone strategy.
Best used alongside support/resistance analysis, price action, or volume.
Does not provide automatic stop loss / take profit levels → risk management must be applied by the trader.
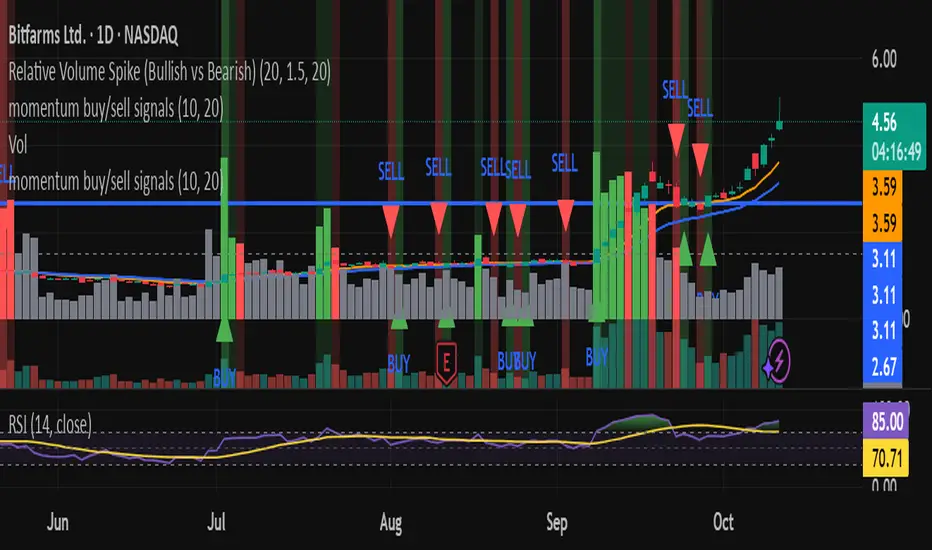
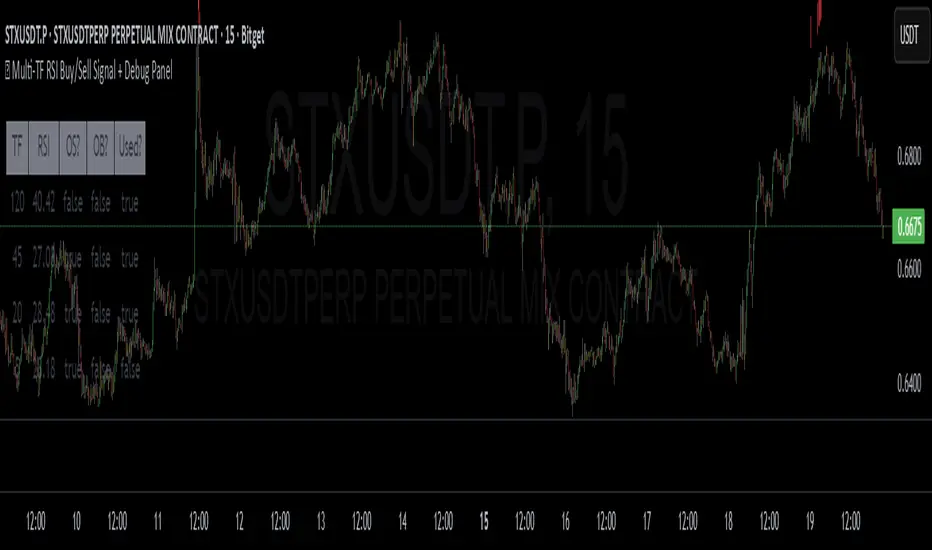
✅ Multi-TF RSI Buy/Sell Signal + Debug Panel
Multi-TF RSI Buy/Sell Signal + Debug Panel
This script provides RSI-based Buy and Sell signals confirmed across multiple timeframes, designed to help identify high-confluence market entries. Includes an optional debug panel for real-time monitoring and diagnostics.
How It Works
RSI Thresholds:
Oversold (OS): RSI < Oversold value → potential Buy
Overbought (OB): RSI > Overbought value → potential Sell
Timeframe Inputs:
You can monitor RSI across up to 4 different timeframes (customizable).
You can enable/disable each individually.
Signal Confirmation:
You define how many of the selected timeframes need to agree (via Min Confirmations).
If Auto Confirm is enabled, it automatically matches the number of confirmations to how many timeframes are enabled.
Signal Logic:
If enough RSI values are oversold, a Buy arrow is shown below the bar.
If enough RSI values are overbought, a Sell arrow appears above the bar.
Alerts are also triggered accordingly.
How to Use
Choose the 4 timeframes you want to monitor.
Toggle which ones to enable (checkboxes).
Select RSI thresholds for oversold/overbought conditions.
Enable Auto Confirmations or manually set how many confirmations are required to trigger a signal.
Use the Style tab to customize the signal visuals.
Turn on alerts with Buy Alert or Sell Alert
Debug Panel
Toggle it on/off via Show Debug Panel.
Move its position to any chart corner.
Updates every 5 bars.
Displays:
Each TF label
RSI value
If it's currently oversold/overbought
If that TF is currently enabled
Tips:
Try to match chart timeframe with one of your selected TFs for better signal visibility.
Use in confluence with other indicators for best results.
RSI alone is not a guaranteed signal – treat it as a filter or alert, not a full strategy.
Notes
This is not financial advice. Always combine with your own analysis.
RSI-based systems work best in ranging or balanced conditions.
Confirmation logic helps reduce noise, but no indicator is infallible.
ZigZag++ + 4 EMA89 Trend Candles + BUY/SELL LabelsThis script combines ZigZag patterns, EMA89 trend detection, and custom buy/sell scalp signals. It helps identify trend direction and potential entry points in trending markets.
Features:
- ZigZag structure points
- EMA89 as dynamic trend filter
- Buy/Sell scalp markers
- HL/HH swing labels
- Works best on 15m–4h timeframes

ZigZag+4 EMA89 Trend Candles + BUY/SELL SCALPThis script combines ZigZag patterns, EMA89 trend detection, and custom buy/sell scalp signals. It helps identify trend direction and potential entry points in trending markets.
Features:
- ZigZag structure points
- EMA89 as dynamic trend filter
- Buy/Sell scalp markers
- HL/HH swing labels
- Works best on 15m–4h timeframes

Intraday Buy/Sell/Average Zones by Chaitu50cIntraday Buy/Sell/Average Zones by chaitu50c
Timeframe:
Tested on the 5-minute chart.
Recommended timeframe: 5-minute
What it does
This indicator marks intraday Buy (green) and Sell (red) zones made by strong close-confirmed breakouts. These zones act as support/resistance. If price later closes through a zone, the zone changes color from that bar forward (support ↔ resistance). It can flip more than once.
How zones form
Single breakout: an opposite-type candle closes beyond the previous candle’s high/low.
Double breakout: a base candle, then two opposite-type candles, and the second one closes beyond the base high/low.
Zone size
Buy zone: from the combo lowest low up to the nearest open/close of the combo.
Sell zone: from the combo highest high down to the nearest open/close of the combo.
Color shift (optional)
If price closes through a zone, it flips color at that bar and behaves as the other side (support ↔ resistance). Flips can happen again later.
Overlap control
When a new zone overlaps an existing same-color zone in the same session, choose:
Merge (combine), or
Suppress (ignore the new one).
Flipped zones use their current color for this.
Right edge & session
All zones extend to the right (your offset). Detection is limited to your chosen session, and you can show only the last N sessions.
---
How to trade (simple)
A) Initial breakout trade
When a new zone forms, that breakout itself can be a trade idea in the breakout direction, The stoploss will be the zone.
B) Zone breakout trade (flip)
If price later closes out of a zone and it changes color, that breakout is another trade opportunity in the new direction.
C) Retrace & average trade
When price retests a zone, wait for a confirmation candle in the zone’s favor
— bullish close for a green zone, bearish close for a red zone — then average entries inside/near the zone.
Place stops just beyond the opposite edge of the zone.
If the zone flips color, stop averaging; bias changed.
---
Key settings
Breakout type: Single and/or Double
Confirm on Close: strict mode (no intrabar preview) or allow intrabar preview that auto-removes if fail
Color Shift on Breaks: on/off
Same-Type Overlap: Merge/Suppress
Session, Sessions to Display, Right Offset, Colors, Max Zones
Reminder: Best results on the 5-minute timeframe (tested and recommended).

BUY & SELL Probability (M5..D1) - MTFMTF Probability Indicator (M5 to D1)
Indicator — Dual Histogram with Buy/Sell Labels
This indicator is designed to provide a probabilistic bias for bullish or bearish conditions by combining three different analytical components across multiple timeframes. The goal is to reduce noise from single-indicator signals and instead highlight confluence where trend, momentum, and strength agree.
Why this combination is useful
- EMA(200) Trend Filter: Identifies whether price is trading above or below a widely used long-term moving average.
- MACD Momentum: Detects short-term directional momentum through line crossovers.
- ADX Strength: Measures how strong the trend is, preventing signals in weak or flat markets.
By combining these, the indicator avoids situations where one tool signals a trade but others do not, helping to filter out low-probability setups.
How it works
- Each timeframe (M5, M15, H1, H4, D1) generates its own trend, momentum, and strength score.
- Scores are weighted according to user-defined importance and then aggregated into a single probability.
- Proximity to recent support and resistance levels can adjust the final score, accounting for nearby barriers.
- The final probability is displayed as:
- Histogram (subwindow): Green bars for bullish probability >50%, red bars for bearish <50%.
- On-chart labels: Showing exact buy/sell percentages on the last bar for quick reference.
Inputs
- EMA length (default 200), MACD settings, ADX period.
- Weights for each timeframe and component (trend, momentum, strength).
- Optional boost for the chart’s current timeframe.
- Smoothing length for probability values.
- Lookback period for support/resistance adjustment.
How to use it
- A green histogram above zero indicates bullish probability >50%.
- A red histogram below zero indicates bearish probability >50%.
- Neutral readings near 50% show low confluence and may be best avoided.
- Users can adjust weights to emphasize higher or lower timeframes, depending on their trading style.
Notes
- This script does not guarantee profitable trades.
- Best used together with price action, volume, or additional confirmation tools.
- Signals are calculated only on closed bars to avoid repainting.
- For testing and learning purposes — not financial advice.

RED: Buy, Sell & TargetsRED: Buy, Sell & Targets
What it is
- Buy & Sell Alerts — a multi-factor scoring engine that highlights potential reversal/exhaustion areas for both longs and shorts.
- Buy & Price Target — a bottom-finder that proposes the nearest meaningful upside target and tracks hits.
Both modules can be toggled independently in the settings; they’re enabled by default.
How to read the chart
1) Buy/Sell panel (scored signals)
- Each bar receives a Buy score and a Sell score from 0 to 10.
- When the score passes the adaptive threshold, you’ll see:
A transparent label (hover to see a checklist tooltip).
If the score is very high, a colored badge with the number appears near the bar.
- Color intensity ≈ conviction (deeper green/red = stronger confluence).
- Small dots mark qualified signals with scores below the “very high” tier.
Score interpretation (rule of thumb)
- 7+: Valid setup (moderate confluence).
- 8+: Stronger confluence.
- 9–10: High-conviction / rare events.
The minimum score to confirm a signal adapts to the timeframe; higher timeframes naturally demand comparable or slightly lower scores.
Note: On symbols without usable volume, you’ll see a top-right warning and the maximum possible score becomes 9.
2) Buy & Target panel (entries + exits)
- When a qualified bottom is detected and the nearest overhead structure offers enough room, a BUY label shows:
💰 Entry (close of the signal bar)
🎯 Target (nearest pivot-based objective above price)
- When price tags the target later, the script prints a 🎯 exit marker above that bar.
- A live stats table (top-right) summarizes Buys, Wins, Open trades, Win rate, Net P&L % for these target plays.
Alerts
This indicator ships with multiple alert conditions, including:
- Buy/Sell score tiers (e.g., “BUY ≥ 9”, “SELL ≥ 9”)
- Target module (“🎯 BUY (target ≥3%)”, “🎯 Target reached”)
Important: The checkboxes in settings only authorize alerts to fire; you still need to create alerts in TradingView and choose the desired condition.
Practical tips
- Prefer bar close for decisions and alerts to reduce noise.
- Cross-check signals across multiple timeframes (e.g., daily with intraday).
- Use the score as a confidence meter, not as an all-in trigger; combine with your risk management.

sHip Crypto Buy/Sell Pro BTC 15minThis is a 15min BTC buy sell indicator that is made by Ai. Have not tested yet but you can give it a go if you want.
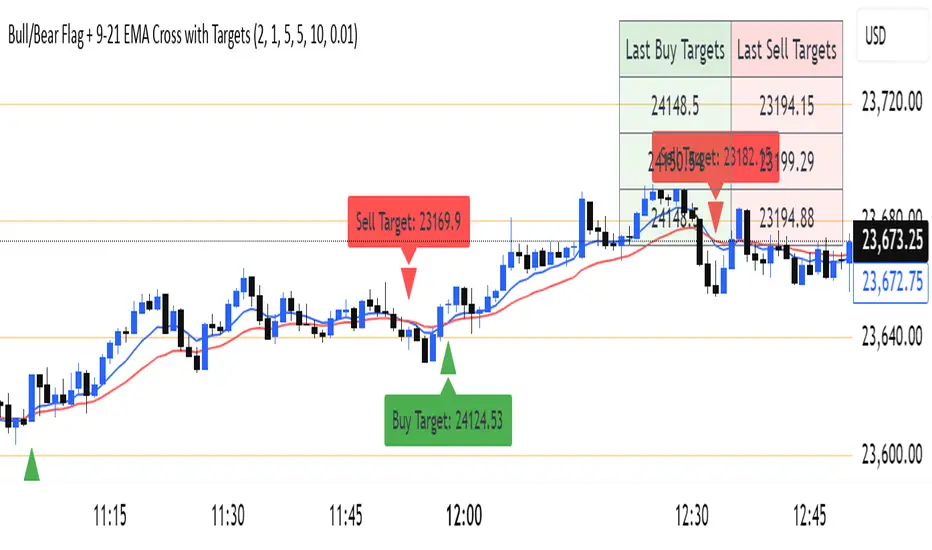
Bull/Bear Flag + 9-21 EMA Cross with Targetssimple chart indicator help with buy sell targets using bear and bull flag along with moving averages on chart -helpful for beginner traders

Trendline + Bull/Bear Flag + EMA 9/21 Buy-Sell Signalseasy scalping and buy sell signals on 9-21 ema cross and trendline breakout

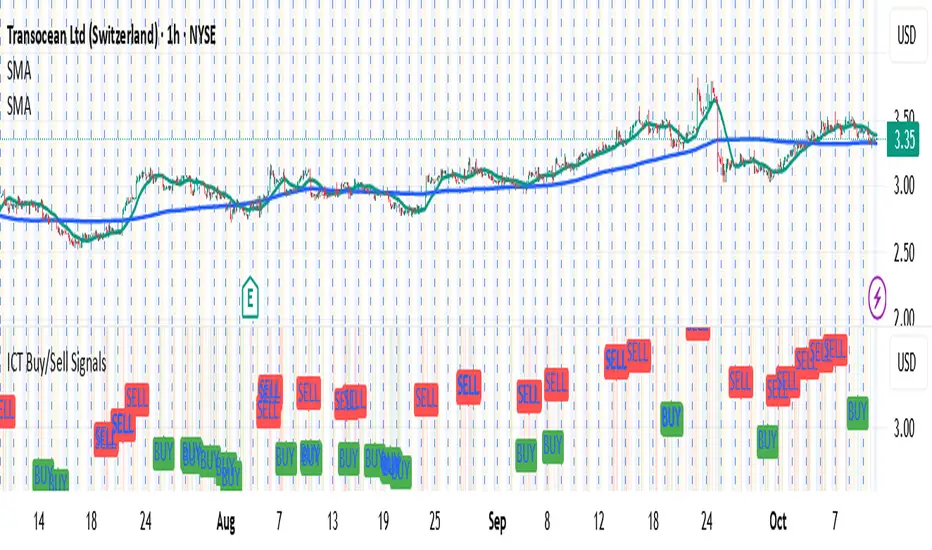
AlgoFlex Buy Sell Signal (1h only)
**Overview**
AlgoFlex Scalper plots buy/sell signal markers using:
* a range filter (EMA of absolute bar changes) to define short-term bias,
* an Adaptive Moving Average (AMA) slope to confirm direction, and
* an ATR threshold to filter weak momentum.
Signals are evaluated on bar close to reduce intrabar noise. This is an indicator, not a strategy.
**How it works (concepts)**
* Range filter: smooths price with an EMA-based range measure and forms upper/lower bands.
* Trend state: counts consecutive movements of the filtered series (up/down counters) to avoid whipsaws.
* AMA + ATR gate: rising AMA with change > ATR \* atrMult can produce a long signal; falling AMA with change < -ATR \* atrMult can produce a short signal.
* TP/SL markers: projected using ATR multiples (tpMult, slMult). Visual guides only.
* Buy Signal, Sell Signal, plus optional TP/SL notifications. Designed to fire on bar close.

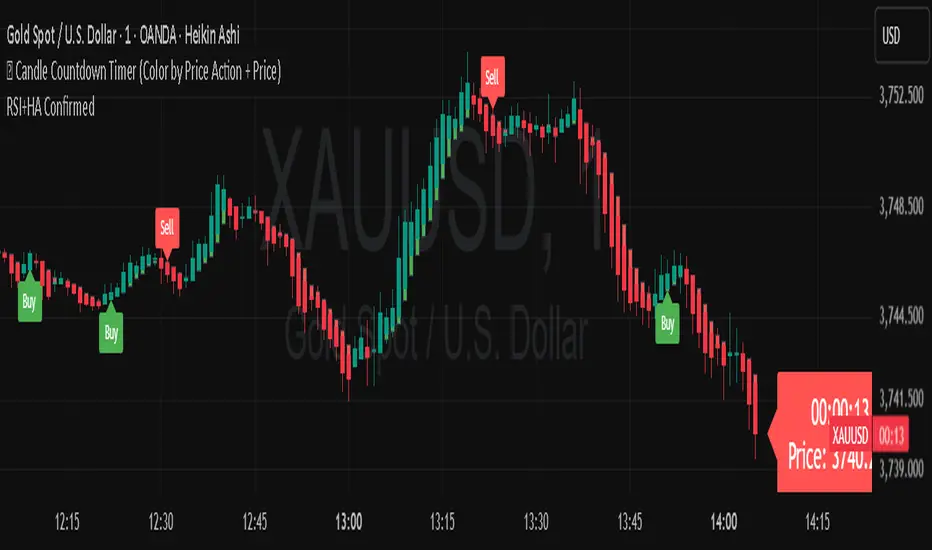
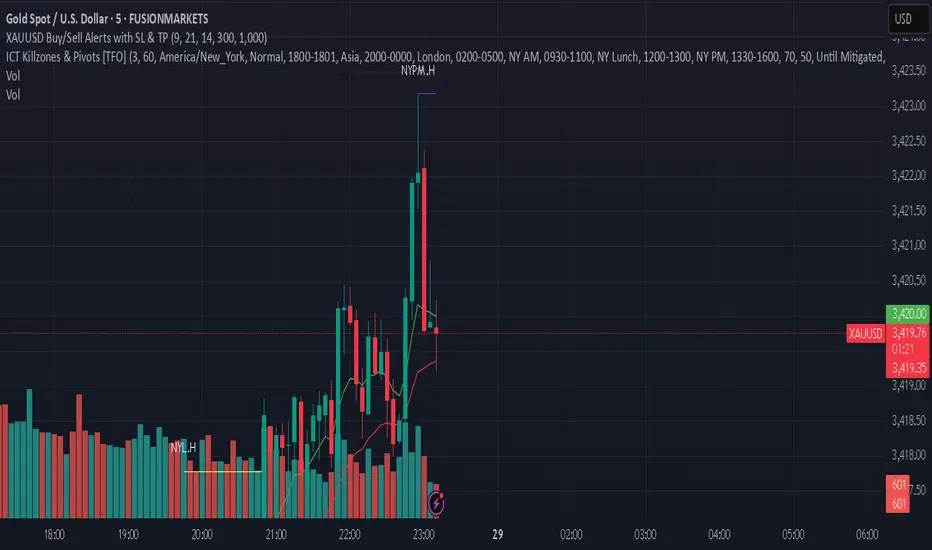
XAUUSD Buy/Sell Alerts with SL & TPThis custom TradingView indicator identifies high-probability buy and sell signals on XAUUSD using EMA crossovers combined with RSI confirmation. Designed for precision entries, it automatically calculates optimal Stop Loss (SL) and Take Profit (TP) levels based on user-defined pip distances.
Key Features:
Fast and Slow EMA crossover for trend direction
RSI filter for momentum confirmation
Dynamic SL and TP levels to manage risk and reward
Visual buy/sell signals plotted on chart
Real-time alerts with detailed messages including entry price, SL, and TP
Suitable for multiple timeframes and trading styles
Perfect for traders seeking clear signals with built-in risk management for scalping or swing trading XAUUSD.
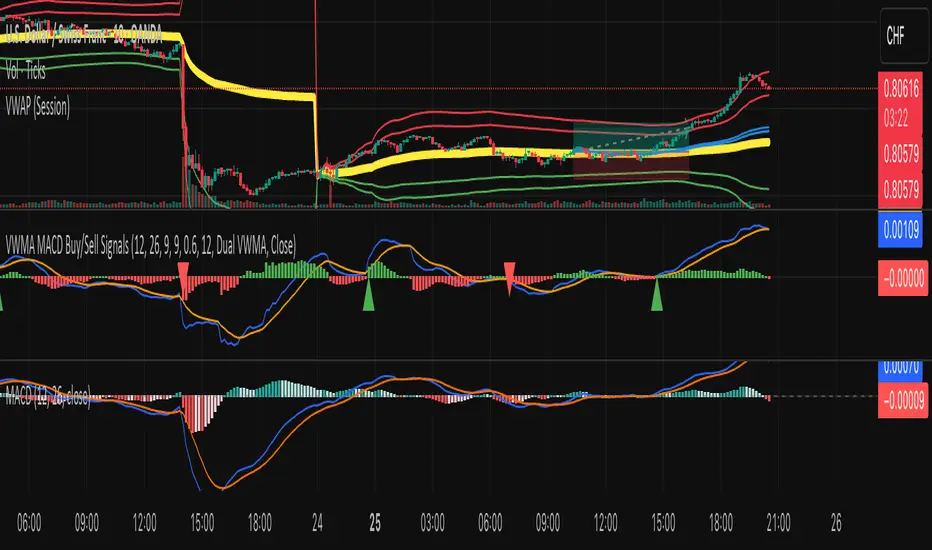
VWMA MACD Amanita Buy/Sell Signals VWMA MACD Amanita Buy/Sell Signals – Volume-Weighted Momentum Indicator
A twist on the classic MACD: this indicator uses Volume Weighted Moving Averages (VWMA) instead of EMAs, giving more weight to price moves backed by higher volume.
Features:
VWMA-based MACD line & signal line
Histogram highlights bullish/bearish momentum
Color-coded for easy visualization
Quick Guide:
MACD above Signal → bullish
MACD below Signal → bearish
Rising histogram → strengthening trend
Falling histogram → weakening trend
Perfect for traders who want momentum confirmed by volume.
RCI Buy/Sell Signals RCI Buy/Sell Signals — Dual-RCI State Machine with EMA Bias (Protected)
A purpose-built signal tool that combines two RCI horizons with a deterministic state machine and an EMA-based background bias. It is not a simple mashup: the components are designed to work together so that trend context, timing, and exits form a coherent workflow.
The code remains closed-source to protect a proprietary implementation; this description explains what it does and how the pieces interact so traders can evaluate it.
What it does
On-chart signals: Marks potential BUY/SELL entries and EXITs directly on the chart (markers are drawn with a −1 bar offset for readability).
Trend bias at a glance: Background shading reflects EMA context:
Green when price is above both EMA1 and EMA2
Red when price is below both EMA1 and EMA2
No shading otherwise
(EMA lengths and timeframes are user-configurable.)
Deterministic state machine: Ensures only one active side at a time (flat → long/short → exit), so entries/exits do not overlap or contradict each other.
How it works (conceptual)
Two-horizon RCI framework:
A MID-RCI monitors regime transitions using mid-range thresholds.
A LONG-RCI acts as a slower directional filter/validator.
Two timing modes (you can enable either or both):
Steadily — MID-RCI transitions across mid-band thresholds (e.g., around −50/50) govern entries; LONG-RCI direction is used to confirm/align.
Above — LONG-RCI crosses its pivotal level (around zero) with directional agreement.
These modes are integrated—not stacked randomly—so that one provides timing, the other directional context.
Exits & risk guard: Exits trigger on MID-RCI reaching extreme bands (e.g., ±85) or when price violates a simple N-bar extremum stop (default: 20-bar low/high), whichever comes first. This makes exits explicit rather than relying on a trailing overlay.
Why this is not “just a merge”
The EMAs are not a separate indicator pasted on top; they only provide a binary bias that gates background shading and helps filter entries visually.
The RCI pair is functionally split (timing vs. confirmation) and then synchronized through a state machine that prevents conflicting signals and enforces clean transitions.
The script ships with signal placement discipline (−1 offset markers for clarity) and built-in exit logic based on RCI extremes plus a simple context stop—an integrated design choice, not an ad-hoc mix.
Inputs (overview)
Display: Show Entry Signals / Show Exit Signals / Show Background
Context: EMA1/EMA2 lengths & timeframes (background bias only)
RCI: Long/Mid lengths and source
How to use
Apply the script on a clean chart (no other indicators unless you explain why).
Use the background color as high-level bias, then use the on-chart signals for timing.
Optionally set alerts with “Any alert() function call” to receive signal notifications.
Confirm with your own risk management, liquidity checks, and higher-timeframe confluence.
Notes on publication (for moderators & traders)
Closed-source rationale: The specific RCI ranking/threshold scheme and the state-machine selection logic are part of ongoing proprietary research; the code is protected.
This description details the concepts and interactions sufficiently to understand what the script does and how components work together, while preserving implementation specifics.
Disclaimer
For educational/informational purposes only; not financial advice. Test thoroughly before live use. Trading involves risk.

KhoiHV - Bollinger Bands Buy/Sell Area ProBollinger Bands Buy/Sell Area Pro is a professional-grade indicator designed to identify potential trading opportunities based on Bollinger Bands. It highlights dynamic buy and sell areas by combining price action with volatility, helping traders quickly visualize market conditions.
✨ Key Features
Automatically plots upper, middle, and lower Bollinger Bands.
Marks Buy Areas when price enters oversold zones near the lower band.
Marks Sell Areas when price enters overbought zones near the upper band.
Configurable inputs for length, source, and multiplier to fit any trading style.
Easy-to-read chart visuals with colored zones for instant recognition.
💡 How to Use
Look for Buy Areas near the lower band in trending markets to catch potential rebounds.
Watch for Sell Areas near the upper band to anticipate possible pullbacks.
Combine with volume, momentum, or trend indicators for stronger confirmation.
This tool is especially useful for traders who want a clear, visual edge in spotting volatility-based entries and exits without constantly recalculating signals.
Cvd Divergence Signals with filter.
CVD Divergence + Candles - False Signal Filter
Hey traders,
I want to share my custom indicator with you. Through testing, I've found that CVD (Composite Volume Delta) captures divergences much more accurately than traditional tools like RSI. But this isn't just another divergence indicator - I've added strict candlestick pattern confirmation to filter out false signals. I'll keep improving this tool over time, and I welcome all your suggestions in the comments.
How it works step-by-step:
1. First, it detects CVD divergences (the delta between buy/sell volumes)
2. Then confirms each signal with reversal candlestick patterns:
- Hammer/Hanging Man
- Engulfing
- Pin Bar
- Inside Bar
Why mine beats standard CVD indicators:
• No raw divergences - only shows signals confirmed by BOTH volume AND price action
• Eliminates 80% of junk signals from basic versions
• Adaptable to any asset and timeframe
Simple usage guide:
Green arrows = Buy when:
- CVD shows bullish divergence
- AND a hammer/pin bar appears
Red arrows = Sell when:
- CVD shows bearish divergence
- Confirmed by hanging man/engulfing pattern
Pro tip:
For best results, combine with:
• Volume profile analysis
• Smart Money concepts (order blocks, FVGs )
Important notes:
This isn't a holy grail - I personally use it with support/resistance levels. Works best on 5M charts for scalping.
**PS** Got questions? Drop them in comments!
