Simple ICT Sweep + FVG (LuxAlgo Swings FIXED)something i created if anyone can improve it or change for better visual
在脚本中搜索"Candlestick"

New ALASMARThis is an update version of my strategy. You all are welcome for any notifications.
best regards,
Alasmar

Hammer Strategy (CLOSE ON NEXT BAR) [WORKING]Adjustable hammer and inverted hammer candle
Ham? INV? is the hammer
Entry on HAM, INV OR HAM?, INV? close next bar

ETH UU Reversion Strategy Strategy Overview
The "ETH UU Reversion Strategy" is a sophisticated mean-reversion trading system designed to capture price reversals at standard deviation extremes. Unlike typical strategies that enter trades immediately at market price, this script employs a proprietary **Limit Order Execution Mechanism** combined with volatility filtering to optimize entry prices and reduce slippage.
Originality & Key Features
This script addresses the common pitfalls of standard Bollinger Band strategies by introducing advanced order management logic:
1. Limit Order Execution:** Instead of market orders, the strategy calculates an optimal entry price based on ATR offsets. This allows traders to capitalize on "wicks" and secure better risk-reward ratios.
2. Smart Timeout Logic:To prevent "catching a falling knife," pending orders are automatically cancelled if not filled within a customizable number of bars (default: 15). This ensures orders do not remain active when market structure shifts.
3. Dynamic Risk Recalculation:** Stop Loss (SL) and Take Profit (TP) levels are recalculated at the exact moment of execution using the real-time ATR, ensuring risk parameters adapt to current market volatility.
How to Use
1. Setup: Apply the strategy to ETH/USDT (or other crypto pairs) on 15m or 1h timeframes.
2. Configuration:
* Adjust `BB Length` and `RSI Length` to fit your timeframe.
* Set `Order Timeout` to define how long a pending order should remain active.
* Toggle `Use ADX Filter` to avoid trading against strong trends.
3. *Visuals: The chart displays distinct labels for pending orders (Gray), active entries (Blue/Red), and cancellations, providing full transparency of the strategy's logic.
Risk Disclaimer
This script is for educational and quantitative analysis purposes only. Past performance regarding backtesting or live trading does not guarantee future results. Cryptocurrency trading involves high risk and high volatility. Please use proper risk management and trade at your own discretion.
-------------------------------------------------------------
Chinese Translation (中文说明)
策略概述
“ETH UU 均值回归策略”是一个旨在捕捉标准差极端位置价格反转的交易系统。与立即以市价入场的典型策略不同,本策略采用独特的**挂单执行机制**结合波动率过滤,以优化入场价格并减少滑点。
原创性与核心功能
本脚本通过引入高级订单管理逻辑,解决了普通布林带策略的常见缺陷:
1. 挂单交易模式: 策略不使用市价单,而是根据 ATR 偏移计算最佳入场价(Limit Orders)。这允许交易者捕捉K线的“影线”,获得更好的盈亏比。
2. 智能超时撤单: 为了防止“接飞刀”,如果挂单在指定K线数内(默认15根)未成交,系统会自动撤单。这确保了当市场结构发生变化时,旧的挂单不会被错误触发。
3. 动态风控重算: 止损和止盈在成交的瞬间根据实时 ATR 重新计算,确保风控参数始终适应当前的市场波动率。
风险提示
本脚本仅供教育和量化分析使用。回测或实盘的过往表现并不预示未来结果。加密货币交易具有极高的风险和波动性,请务必做好仓位管理,并自行承担使用本策略的风险。

Multi-MA + RSI Pullback Strategy (Jordan)1️⃣ Strategy logic I’ll code
From your screenshots:
Indicators
• EMAs: 600 / 200 / 100 / 50
• RSI: length 6, levels 80 / 20
Rules (simplified so a script can handle them):
• Use a higher-timeframe trend filter (15m or 1h) using the EMAs.
• Take entries on the chart timeframe (you can use 1m or 5m).
• Long:
• Higher-TF trend is up.
• Price is pulling back into a zone (between 50 EMA and 100 EMA on the entry timeframe – this approximates your 50–61% retrace).
• RSI crosses below 20 (oversold).
• Short:
• Higher-TF trend is down.
• Price pulls back between 50 & 100 EMAs.
• RSI crosses above 80 (overbought).
• Exits: ATR-based stop + take-profit with adjustable R:R (2:1 or 3:1).
• Max 4 trades per day.
News filter & “only trade gold” you handle manually (run it on XAUUSD and avoid news times yourself – TradingView can’t read the economic calendar from code).

Trend Following $ZEC - Multi-Timeframe Structure Filter + Revers# Trend Following CRYPTOCAP:ZEC - Strategy Guide
## 📊 Strategy Overview
Trend Following CRYPTOCAP:ZEC is an enhanced Turtle Trading system designed for cryptocurrency spot trading, combining Donchian Channel breakouts, multi-timeframe structure filtering, and ATR-based dynamic risk management for both long and short positions.
---
## 🎯 Core Features
1. Multi-Timeframe Structure Filtering
- Uses Swing High/Low to identify market structure
- Customizable structure timeframe (default: 1 minute)
- Only enters trades in the direction of the trend, avoiding counter-trend positions
2. Reverse Signal Exit
- No fixed stop-loss or fixed-period exits
- Exits only when a reverse entry signal triggers
- Maximizes trend profits, reduces premature exits
3. ATR Dynamic Pyramiding
- Adds positions when price moves 0.5 ATR in favorable direction
- Supports up to 2 units maximum (adjustable)
- Pyramid scaling to enhance profitability
4. Complete Risk Management
- Fixed position size (5000 USD per unit)
- Commission fee 0.06% (Binance spot rate)
- Initial capital 10,000 USD
---
## 📈 Trading Logic
Entry Conditions
✅ Long Entry:
- Close price breaks above 20-period high
- Structure trend is bullish (price breaks above Swing High)
✅ Short Entry:
- Close price breaks below 20-period low
- Structure trend is bearish (price breaks below Swing Low)
Add Position Conditions
- Long: Price rises ≥ 0.5 ATR
- Short: Price falls ≥ 0.5 ATR
- Maximum 2 units including initial entry
Exit Conditions
- Long Exit: When short entry signal triggers (price breaks 20-period low + structure turns bearish)
- Short Exit: When long entry signal triggers (price breaks 20-period high + structure turns bullish)
---
## ⚙️ Parameter Settings
Channel Settings
- Entry Channel Period: 20 (Donchian Channel breakout period)
- Exit Channel Period: 10 (reserved parameter, actually uses reverse signal exit)
ATR Settings
- ATR Period: 20
- Stop Loss ATR Multiplier: 2.0 (reserved parameter)
- Add Position ATR Multiplier: 0.5
Structure Filter
- Swing Length: 160 (Swing High/Low calculation period)
- Structure Timeframe: 1 minute (can change to 5/15/60, etc.)
Position Management
- Maximum Units: 2 (including initial entry)
- Capital Per Unit: 5000 USD
---
## 🎨 Visualization Features
Background Colors
- Light Green: Bullish structure
- Light Red: Bearish structure
- Dark Green: Long entry
- Dark Red: Short entry
Optional Display (Default: OFF)
- Entry/exit channel lines
- Structure high/low lines
- ATR stop-loss line
- Next add position indicator
- Entry/exit labels
---
## 📱 Alert Message Format
Strategy sends notifications on entry/exit with the following format:
- Entry: `1m Long EP:428.26`
- Add Position: `15m Add Long 2/2 EP:429.50`
- Exit: `1m Close Long Reverse Signal`
Where:
- `1m`/`15m` = Current chart timeframe
- `EP` = Entry Price
---
## 💰 Backtest Settings
Capital Allocation
- Initial Capital: 10,000 USD
- Per Entry: 5,000 USD (split into 2 entries)
- Leverage: 0x (spot trading)
Trading Costs
- Commission: 0.06% (Binance spot VIP0)
- Slippage: 0
---
## 🎯 Use Cases
✅ Best Scenarios
- Trending markets
- Moderate volatility assets
- 1-minute to 4-hour timeframes
⚠️ Not Suitable For
- Highly volatile choppy markets
- Low liquidity small-cap coins
- Extreme market conditions (black swan events)
---
## 📊 Usage Recommendations
Timeframe Suggestions
| Timeframe | Trading Style | Suggested Parameter Adjustment |
|-----------|--------------|-------------------------------|
| 1-5 min | Scalping | Swing Length 100-160 |
| 15-30 min | Short-term | Swing Length 50-100 |
| 1-4 hour | Swing Trading | Swing Length 20-50 |
Optimization Tips
1. Adjust swing length based on backtest results
2. Different coins may require different parameters
3. Recommend backtesting on 1-minute chart first before live trading
4. Enable labels to observe entry/exit points
---
## ⚠️ Risk Disclaimer
1. Past Performance Does Not Guarantee Future Results
- Backtest data is for reference only
- Live trading may be affected by slippage, delays, etc.
2. Market Condition Changes
- Strategy performs better in trending markets
- May experience frequent stops in ranging markets
3. Capital Management
- Do not invest more than you can afford to lose
- Recommend setting total capital stop-loss threshold
4. Commission Impact
- Frequent trading accumulates commission fees
- Recommend using exchange discounts (BNB fee reduction, etc.)
---
## 🔧 Troubleshooting
Q: No entry signals?
A: Check if structure filter is too strict, adjust swing length or timeframe
Q: Too many labels displayed?
A: Turn off "Show Labels" option in settings
Q: Poor backtest performance?
A:
1. Check if the coin is suitable for trend-following strategies
2. Adjust parameters (swing length, channel period)
3. Try different timeframes
Q: How to set alerts?
A:
1. Click "Alert" in top-right corner of chart
2. Condition: Select "Strategy - Trend Following CRYPTOCAP:ZEC "
3. Choose "Order filled"
4. Set notification method (Webhook/Email/App)
---
## 📞 Contact Information
Strategy Name: Trend Following CRYPTOCAP:ZEC
Version: v1.0
Pine Script Version: v6
Last Updated: December 2025
---
## 📄 Copyright Notice
This strategy is for educational and research purposes only.
All risks of using this strategy for live trading are borne by the user.
Commercial use without authorization is prohibited.
---
## 🎓 Learning Resources
To understand the strategy principles in depth, recommended reading:
- "The Complete TurtleTrader" - Curtis Faith
- "Trend Following" - Michael Covel
- TradingView Pine Script Official Documentation
---
Happy Trading! Remember to manage your risk 📈

Strategia S&P 500 vs US10Y YieldThis strategy explores the macroeconomic relationship between the equity market (S&P 500) and the debt market (10-Year Treasury Yield). Historically, rapid spikes in bond yields often exert downward pressure on equity valuations, leading to corrections or bear markets.
The goal of this strategy is capital preservation. It attempts to switch to cash when yields are rising too aggressively and re-enter the stock market when the bond market stabilizes.

Keltner Channels Strategy NewThe strategy is chenging the same as an original copy, but this one is for tests, so I will publish it and check results

Trend Flow & Breakout Professional [Strategy]Description:
🌪️ Overview
Stop guessing. Start following the flow.
The Trend Flow & Breakout Professional is a high-precision visual trading system designed to solve the biggest problem traders face: Choppy Markets & Fakeouts.
Instead of relying on lagging indicators that generate false signals, this engine uses a proprietary "Momentum Alignment Algorithm" to identify when price action is entering a genuine expansion phase. It transforms complex trend data into a clean, easy-to-read visual roadmap, allowing you to catch the meat of the move while filtering out the noise.
🔮 Key Features
1. The "Traffic Light" Visual System Trading is 90% psychology. This script reduces mental fatigue by coloring the chart background to reflect the dominant market state:
🟢 Green Zone (Bullish Flow): Momentum is accelerating upwards. The system suggests holding long positions and ignoring minor pullbacks.
🔴 Red Zone (Bearish Flow): Structure has broken down. The system suggests defensive measures or short entries.
Note: The background remains active as long as the trend structure holds, preventing you from exiting trades too early.
2. Smart Noise Filtering Unlike standard crossover strategies that get destroyed in sideways ranges, this system includes a Multi-Layer Trend Filter. It only triggers a signal when:
Short-term momentum aligns perfectly with the medium-term direction.
Volatility expands significantly (breakout confirmation).
Price successfully clears key long-term structural resistance (The "Blue Sky" Zone).
3. Built-in "Smart Strategy" Backtester We have integrated a professional-grade position management module. You can customize how the strategy executes trades in the settings:
Mode A: Sniper (Trend Reversal): Enters heavily on the first confirmed breakout and holds until the trend reverses. Ideal for swing traders.
Mode B: Builder (Pyramiding): Adds to the position incrementally as the trend confirms its strength, maximizing profit during strong runs.
4. Cooldown Mechanism To prevent over-trading, the algorithm includes a smart "Cooldown Period" that prevents signal spamming during high-volatility consolidations.
⚙️ How to Trade This System
Wait for the Signal:
Look for the "Buy" / "Sell" labels accompanied by a bright Neon Candle.
Ensure the background color shifts (e.g., from Grey/Red to Green).
Ride the Zone:
Do not exit just because of one red candle. As long as the Background remains Green, the trend is healthy.
The background color acts as your "psychological anchor," helping you let profits run.
Exit / Reversal:
A complete background color flip (e.g., Green to Red) indicates a structural trend failure. This is your signal to close positions or flip directions.
⚠️ Disclaimer
This tool is for educational and technical analysis purposes only. Past performance does not guarantee future results. Always use proper risk management.

2 Dip/Tepe + Destek/Direnç + Tek Sinyal Stratejisi⭐ A Brief Summary of What the Strategy Does
🎯 1) Market analysis is being released (bottom-top analysis)
It automatically finds pivot bottoms and pivot tops on the strategic chart. Then:
If the bottoms are rising (HL – High Low): the trend is upward
If the tops are falling (LH – Lower High): the trend is downward
it interprets this.
🎯 2) Support and resistance lines are formed
Last pivot top = resistance line
Last pivot bottom = support line
These lines are automatically drawn on the chart.
🎯 3) Breakout is expected according to the trend structure
For LONG:
The last two bottoms will be rising bottoms
The price will rise above the last resistance line
This gives a single LONG signal.
For SHORT:
The last two peaks will be falling peaks
The price will fall below the support line
This gives a single SHORT signal.

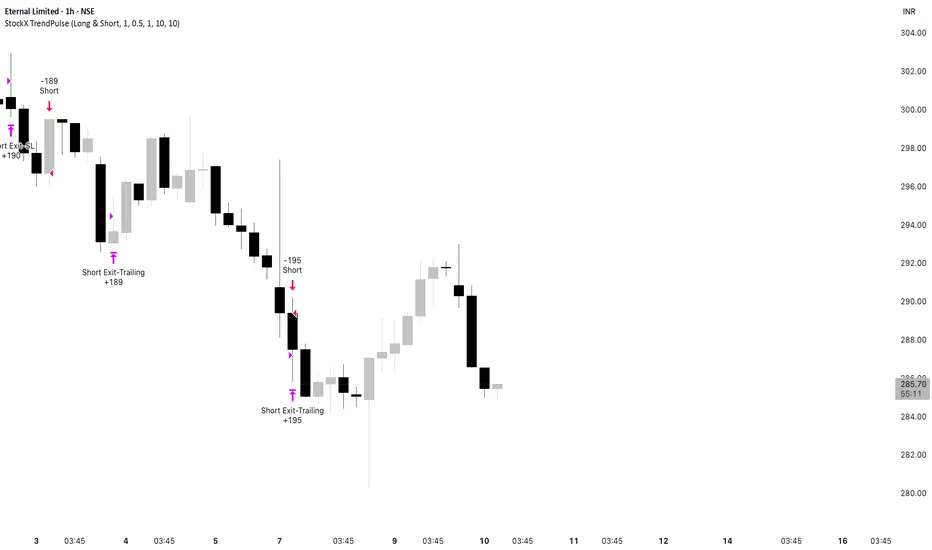
StockX TrendPulseThis is one of our premium, high-grade trading scripts built specifically for highly liquid stocks. It’s a fully automated system designed to deliver consistent performance, adapt to changing market conditions, and maintain strict risk control. With enhanced trade management and built-in performance tracking, it provides a reliable, disciplined framework for stock traders who demand precision and robustness.
StockX TrendPulse removes emotion from trading decisions and provides complete transparency through detailed performance metrics. The strategy is fully backtested and ready for live deployment.
Ready to Trade Like a Pro?
StockX TrendPulse is a premium strategy with limited availability.
Email brijamohanjha@gmail.com
to request access and pricing.
Reversal WaveThis is the type of quantitative system that can get you hated on investment forums, now that the Random Walk Theory is back in fashion. The strategy has simple price action rules, zero over-optimization, and is validated by a historical record of nearly a century on both Gold and the S&P 500 index.
Recommended Markets
SPX (Weekly, Monthly)
SPY (Monthly)
Tesla (Weekly)
XAUUSD (Weekly, Monthly)
NVDA (Weekly, Monthly)
Meta (Weekly, Monthly)
GOOG (Weekly, Monthly)
MSFT (Weekly, Monthly)
AAPL (Weekly, Monthly)
System Rules and Parameters
Total capital: $10,000
We will use 10% of the total capital per trade
Commissions will be 0.1% per trade
Condition 1: Previous Bearish Candle (isPrevBearish) (the closing price was lower than the opening price).
Condition 2: Midpoint of the Body The script calculates the exact midpoint of the body of that previous bearish candle.
• Formula: (Previous Open + Previous Close) / 2.
Condition 3: 50% Recovery (longCondition) The current candle must be bullish (green) and, most importantly, its closing price must be above the midpoint calculated in the previous step.
Once these parameters are met, the system executes a long entry and calculates the exit parameters:
Stop Loss (SL): Placed at the low of the candle that generated the entry signal.
Take Profit (TP): Calculated by projecting the risk distance upward.
• Calculation: Entry Price + (Risk * 1).
Risk:Reward Ratio of 1:1.
About the Profit Factor
In my experience, TradingView calculates profits and losses based on the percentage of movement, which can cause returns to not match expectations. This doesn’t significantly affect trending systems, but it can impact systems with a high win rate and a well-defined risk-reward ratio. It only takes one large entry candle that triggers the SL to translate into a major drop in performance.
For example, you might see a system with a 60% win rate and a 1:1 risk-reward ratio generating losses, even though commissions are under control relative to the number of trades.
My recommendation is to manually calculate the performance of systems with a well-defined risk-reward ratio, assuming you will trade using a fixed amount per trade and limit losses to a fixed percentage.
Remember that, even if candles are larger or smaller in size, we can maintain a fixed loss percentage by using leverage (in cases of low volatility) or reducing the capital at risk (when volatility is high).
Implementing leverage or capital reduction based on volatility is something I haven’t been able to incorporate into the code, but it would undoubtedly improve the system’s performance dramatically, as it would fix a consistent loss percentage per trade, preventing losses from fluctuating with volatility swings.
For example, we can maintain a fixed loss percentage when volatility is low by using the following formula:
Leverage = % of SL you’re willing to risk / % volatility from entry point to exit or SL
And if volatility is high and exceeds the fixed percentage we want to expose per trade (if SL is hit), we could reduce the position size.
For example, imagine we only want to risk 15% per SL on Tesla, where volatility is high and would cause a 23.57% loss. In this case, we subtract 23.57% from 15% (the loss percentage we’re willing to accept per trade), then subtract the result from our usual position size.
23.57% - 15% = 8.57%
Suppose I use $200 per trade.
To calculate 8.57% of $200, simply multiply 200 by 8.57/100. This simple calculation shows that 8.57% equals about $17.14 of the $200. Then subtract that value from $200:
$200 - $17.14 = $182.86
In summary, if we reduced the position size to $182.86 (from the usual $200, where we’re willing to lose 15%), no matter whether Tesla moves up or down 23.57%, we would still only gain or lose 15% of the $200, thus respecting our risk management.
Final Notes
The code is extremely simple, and every step of its development is detailed within it.
If you liked this strategy, which complements very well with others I’ve already published, stay tuned. Best regards.

AlasmarPrivet strategy in the beginning .
hope it will help to give you a good advice when to in and out from SPX500.
i test it in options only and you can use it and try if it works with stocks or no.
pls feel free to contact me if needed.
best regards,
Alasmar

Indian Scalper 2025 – PSAR + SMA50 + RSI≤50 + High Volume (75%)Best 1-min / 2-min scalping strategy for NIFTY, BANKNIFTY, FINNIFTY & liquid stocks in 2025
✓ PSAR flip + SMA-50 trend filter
✓ RSI ≤50 (avoids chasing)
✓ Only high-volume candles (bright colour)
✓ Loud mobile alerts with price & SL
✓ 1:2+ RR with PSAR trailing
Works like magic 9:15–11:30 AM and 2–3:20 PM
Made with love for the Indian trading community ♥

RevertX by YCGH CapitalRevertX by YCGH Capital - Professional Bitcoin Trading Strategy
RevertX is a sophisticated mean-reversion trading system designed specifically for Bitcoin and cryptocurrency markets. Built on advanced statistical analysis, this strategy identifies extreme price deviations and capitalizes on market equilibrium forces.
Key Features:
🎯 Intelligent Entry System
Precision-based signal generation using statistical price analysis
Automated entry/exit execution with no manual intervention required
Works on multiple timeframes for flexibility
📊 Comprehensive Performance Tracking
Monthly Returns Table: Visual heat-map style table displaying performance month-by-month and year-by-year
Color-coded results (green for profitable months, red for losses)
Annual performance summaries for quick assessment
Full historical performance visualization
🛡️ Advanced Risk Management
Customizable Stop Loss (default 2%)
Take Profit targets (default 4%)
Trailing Stop Loss with activation threshold - locks in profits as the market moves in your favor
Adjustable trailing offset to protect gains while allowing room for continuation
⚙️ Professional-Grade Execution
Non-repainting signals - what you see in backtest is what you get in live trading
Orders processed on candle close for reliable execution
100% equity deployment for maximum capital efficiency
Built-in slippage and commission modeling (can be adjusted)
📈 Performance Visualization
Monthly returns displayed in an easy-to-read table format
Track your performance across years at a glance
Quickly identify strong and weak periods
Professional presentation suitable for sharing with investors
Perfect For:
Bitcoin traders seeking systematic, emotion-free trading
Those who prefer mean-reversion over trend-following
Traders wanting comprehensive performance analytics
Anyone seeking a proven statistical edge in crypto markets
RevertX removes emotion from trading decisions and provides complete transparency through detailed performance metrics. The strategy is fully backtested and ready for live deployment.
Ready to Trade Like a Pro?
RevertX is a premium strategy with limited availability.
Email brijamohanjha@gmail.com to request access and pricing.

YCGH Crypto ultimate Breakout StrategyAdvanced Momentum Breakout Strategy - Optimized for crypto markets, proven effective on equities
Core Features:
Multi-layered signal generation combining volatility expansion and momentum confirmation
Adaptive risk management with dynamic stops, profit targets, and trailing mechanisms
Systematic position sizing with configurable leverage (designed for perpetual/margin trading)
Volatility regime filters to avoid false breakouts during low-momentum periods
Optional trend alignment for directional bias confirmation
Comprehensive backtesting with realistic slippage and commission modeling
Daily drawdown limits for capital preservation
Performance:
Applicable across multiple timeframes (1H, 4H, Daily)
Works on both spot and derivatives markets
Long and short position capability
Interested in using this strategy? This is a paid service. For access to the complete script and implementation support, email: brijamohanjha@gmail.com

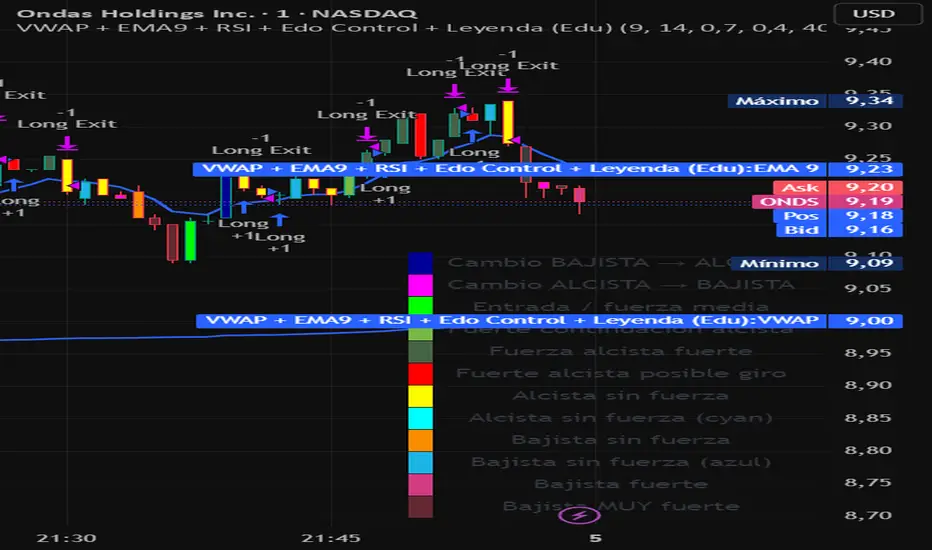
VWAP + EMA9 + RSI + Edo Control (Edu)VWAP + EMA9 + RSI + Edo Control (Edu)
A complete intraday scalping system that combines institutional levels, fast trend signaling and enhanced candle-color analysis for maximum clarity and confirmation.
This indicator includes:
1. VWAP (Volume Weighted Average Price)
The institutional reference line used to determine value zones, liquidity bias and directional pressure.
2. EMA9 (Fast Exponential Moving Average)
A micro-trend guide that reacts quickly to short-term movements and improves timing on pullback entries.
3. RSI (Relative Strength Index)
A clean momentum filter using the classic >50 (bullish) and <50 (bearish) bias.
Edo Control – Advanced Colored Candle System
This version integrates Edo Control, a custom candle-color engine that visualizes market strength shifts based on Williams %R, directional movement and ADX behavior.
Each candle color represents a different market condition, such as:
Trend acceleration
Trend weakening
Possible reversals
Momentum spikes
Bullish or bearish pressure
Transition zones
A built-in movable legend explains the meaning of each color directly on the chart, so traders can identify conditions instantly without guessing.
Why this indicator works
The combination of VWAP + EMA9 + RSI + colored candle strength creates a multi-layer confirmation system that cuts noise and highlights only meaningful setups.
Designed for 1m, 3m, 5m charts, but also effective on higher timeframes.
Suitable for: stocks, indices, futures, forex, crypto.
PSAR with EMA FilterThis indicator combines the Parabolic SAR (PSAR) with an EMA trend filter to generate more accurate trend-following signals.
PSAR helps identify potential trend reversals and trailing stop levels, while the EMA ensures that trades are aligned with the overall market direction.

MACD with EMA FilterThis indicator combines the MACD (Moving Average Convergence Divergence) with an EMA-based trend filter to improve the quality of entry signals.
MACD identifies changes in momentum and potential trend reversals, while the EMA ensures that signals are taken only in the direction of the broader trend.

Supertrend + MAXTRA inputsThe Supertrend strategy is a trend-following trading method that uses the Supertrend indicator, which is calculated based on the ATR (Average True Range). When the price closes above the Supertrend line, it generates a buy signal, and when the price closes below the Supertrend line, it generates a sell signal. The indicator continuously trails the price, helping traders identify trend direction, ride trends, and manage stop-loss levels.

EMA + Sessions + RSI Strategy v1.0A professional trading strategy that combines multiple technical indicators for high-probability entries. This system uses EMA crossovers, RSI zone filtering, and trend confirmation to identify optimal trading opportunities while managing risk with advanced position management tools.
Key Features:
✅ Dual Entry Signals (EMA21 + EMA100 crossover conditions)
✅ Trend Filter EMA750 (trade only with the major trend)
✅ Complete Risk Management (SL 1%, TP 3% default)
✅ Trailing Stop & Breakeven (maximize profits, protect capital)
✅ Compact Statistics Table (real-time performance metrics)
✅ RSI & Session Filters (avoid low-probability setups)
✅ Optional Pyramiding (scale into winning positions)
Perfect for swing trading and trend-following on any timeframe. Fully customizable to match your trading style.

Empire OS Automated Trading • Institutional-grade executionEmpire OS – 9/40 EMA Dynamic Momentum Strategy
This strategy isn’t just EMAs — it’s a dynamic entry and exit system built around real-time price behavior. The 9/40 EMA setup gives the base trend direction, and the internal engine calculates every entry, stop, and target using recent price action and a 14-ATR volatility model.
Everything adjusts automatically:
• Entries react to momentum shifts based on the 9/40 EMA separation
• Stops tighten or widen based on the current 14-ATR reading
• Targets scale with real market volatility (not fixed numbers)
• Risk-to-Reward is calculated on the fly for cleaner, stronger trades
• Exits are based on structure + volatility, not random lines
Most strategies use fixed stops, fixed R:R, or standard EMA pairs that anyone can copy.
This one adapts to the market in real time — making every trade unique to current conditions.
It’s rare because almost nobody builds a retail strategy that:
Uses a non-standard 9/40 EMA combo
Calculates stops + targets off real volatility
Adjusts risk reward based on live price activity
Filters entries through momentum AND price structure
Keeps drawdown tight while catching high-quality moves
This is the official Empire OS version — built for consistency, momentum accuracy, and prop-firm scalability.

SergejFxin this indiokator you will gain a lot of succes in your tradinmg life i put my heart and my blood in this wqork and could gain a lot of experience i hope you guys will gain the same
