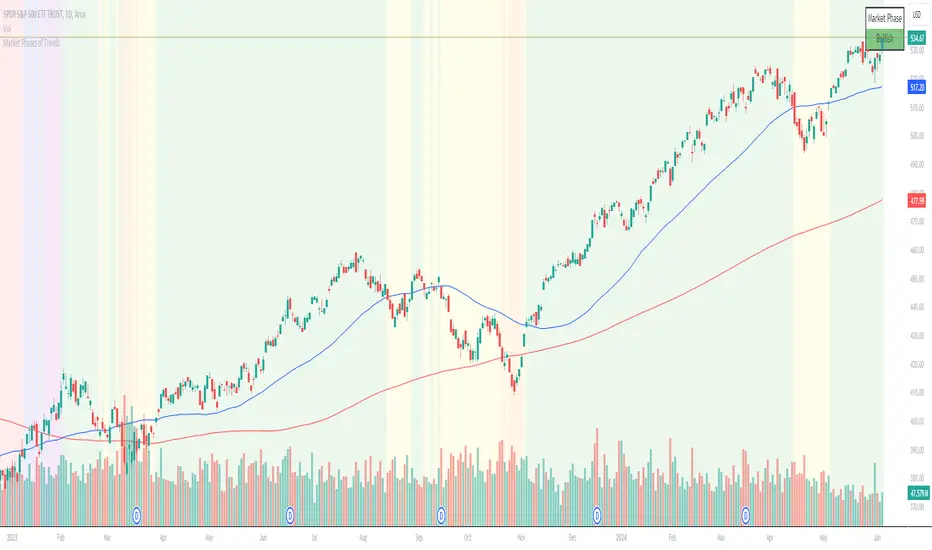
Interest Rate ExpectationsThis indicator shows how much rate cuts or hikes are currently priced into SOFR futures. You choose two SOFR contracts and the script converts each contract price into basis points relative to the current effective fed funds rate. This gives you a very clear view of how policy expectations shift over time.
You can switch between using a fixed EFFR value or pulling the live EFFR ticker. Colours for each line and label are fully adjustable. The script also includes an optional grid for the plus or minus 25, 50 and 75 basis point levels so the chart does not zoom out too far.
Labels appear at the end of both lines and display how many basis points of cuts or hikes are priced for each contract. A small reference box is added on the chart to remind you what each quarterly code represents. For example H is March and Z is December.
The background shading highlights changes in the timing of cuts. Green shading means the market is pushing cuts further out in time. Red shading means cuts are being pulled closer. This gives a simple and visual way to track how the curve reprices near term versus long term policy expectations.
This tool is useful for anyone tracking fed path repricing, front end volatility, macro catalysts or cross asset rate sensitivity.
在脚本中搜索"Cycle"
HTCTS - Session & Time LiquidityHTCTS - Session & Time Liquidity
1. ภาพรวมการทำงาน (Overview)
อินดิเคเตอร์ตัวนี้ทำหน้าที่ 4 อย่างหลักพร้อมกัน:
Auto DST (ปรับเวลาตามฤดูอัตโนมัติ): คุณไม่ต้องมานั่งแก้เวลาเมื่อตลาดต่างประเทศเปลี่ยนเวลา (Daylight Saving Time) เพราะโค้ดอ้างอิง Timezone ของตลาดนั้นๆ โดยตรง (เช่น NY ใช้ America/New_York)
Session Bars: แสดงแถบสีเล็กๆ ด้านล่างจอเพื่อบอกว่าตอนนี้อยู่ใน Session ไหน (Asia, London, NY AM, NY PM, Thai) แทนการถมสีพื้นหลังซึ่งอาจจะรกตา
High/Low Levels & Sweeps: เมื่อจบ Session โปรแกรมจะตีเส้น High และ Low ของช่วงเวลานั้นทิ้งไว้ ถ้ากราฟวิ่งไปชนเส้นเหล่านั้น (Breakout/Sweep) เส้นจะเปลี่ยนเป็นเส้นประและขึ้นข้อความว่า "(Swept)"
1. Indicator Overview and Purpose (ICT/SMC Framework)
This custom Pine Script indicator is designed specifically for traders utilizing ICT (Inner Circle Trader) or SMC (Smart Money Concepts) methodologies. Its primary function is to simplify the analysis of Time & Price by automatically defining and tracking key market sessions, their resulting liquidity levels (High/Low), and detecting liquidity sweeps (Stop Hunts).
The indicator is designed to be Zero-Maintenance regarding time zones, as it automatically adjusts for Daylight Saving Time (DST) changes in major financial centers (London, New York).
2. Key Features and Logic
A. Automatic DST Handling (Auto-DST)
The script uses specific, location-based time zones for global markets instead of a fixed GMT/UTC offset.
Asia: Uses Asia/Tokyo.
London: Uses Europe/London (Automatically adjusts for BST).
New York (AM/PM): Uses America/New_York (Automatically adjusts for EST/EDT).
This guarantees that the session times displayed on your chart (regardless of your local time, e.g., Thailand GMT+7) always align with the actual opening and closing moments of the corresponding financial market.
Weekly Separator - JammalWeekly Separator - Jammal
This script draws a clean and minimal weekly separator for better chart structure and visual clarity.
Every time a new trading week begins, the script automatically places a vertical dotted gray line extending across the entire chart.
Features:
Automatic weekly detection
Clean dotted vertical line
Light gray color to avoid clutter
Works on all timeframes
Helps identify weekly structure & price flow
Designed for traders who want a simple, non-intrusive weekly separator.
Enjoy and happy trading!
SPX Breadth – Stocks Above 200-day SMA//@version=6
indicator("SPX Breadth – Stocks Above 200-day SMA",
overlay = false,
max_lines_count = 500,
max_labels_count = 500)
//–––––––––––––––––––––––––––––––––––––––––––––––––––––––––––––––––––––––––––––
// Inputs
group_source = "Source"
breadthSymbol = input.symbol("SPXA200R", "Breadth symbol", group = group_source)
breadthTf = input.timeframe("", "Timeframe (blank = chart)", group = group_source)
group_params = "Parameters"
totalStocks = input.int(500, "Total stocks in index", minval = 1, group = group_params)
smoothingLen = input.int(10, "SMA length", minval = 1, group = group_params)
//–––––––––––––––––––––––––––––––––––––––––––––––––––––––––––––––––––––––––––––
// Breadth series (symbol assumed to be percent 0–100)
string tf = breadthTf == "" ? timeframe.period : breadthTf
float rawPct = request.security(breadthSymbol, tf, close) // 0–100 %
float breadthN = rawPct / 100.0 * totalStocks // convert to count
float breadthSma = ta.sma(breadthN, smoothingLen)
//–––––––––––––––––––––––––––––––––––––––––––––––––––––––––––––––––––––––––––––
// Regime levels (0–20 %, 20–40 %, 40–60 %, 60–80 %, 80–100 %)
float lvl0 = 0.0
float lvl20 = totalStocks * 0.20
float lvl40 = totalStocks * 0.40
float lvl60 = totalStocks * 0.60
float lvl80 = totalStocks * 0.80
float lvl100 = totalStocks * 1.0
p0 = plot(lvl0, "0%", color = color.new(color.black, 100))
p20 = plot(lvl20, "20%", color = color.new(color.red, 0))
p40 = plot(lvl40, "40%", color = color.new(color.orange, 0))
p60 = plot(lvl60, "60%", color = color.new(color.yellow, 0))
p80 = plot(lvl80, "80%", color = color.new(color.green, 0))
p100 = plot(lvl100, "100%", color = color.new(color.green, 100))
// Colored zones
fill(p0, p20, color = color.new(color.maroon, 80)) // very oversold
fill(p20, p40, color = color.new(color.red, 80)) // oversold
fill(p40, p60, color = color.new(color.gold, 80)) // neutral
fill(p60, p80, color = color.new(color.green, 80)) // bullish
fill(p80, p100, color = color.new(color.teal, 80)) // very strong
//–––––––––––––––––––––––––––––––––––––––––––––––––––––––––––––––––––––––––––––
// Plots
plot(breadthN, "Stocks above 200-day", color = color.orange, linewidth = 2)
plot(breadthSma, "Breadth SMA", color = color.white, linewidth = 2)
// Optional label showing live value
var label infoLabel = na
if barstate.islast
label.delete(infoLabel)
string txt = "Breadth: " +
str.tostring(breadthN, format.mintick) + " / " +
str.tostring(totalStocks) + " (" +
str.tostring(rawPct, format.mintick) + "%)"
infoLabel := label.new(bar_index, breadthN, txt,
style = label.style_label_left,
color = color.new(color.white, 20),
textcolor = color.black)
Z-score RegimeThis indicator compares equity behaviour and credit behaviour by converting both into z-scores. It calculates the z-score of SPX and the z-score of a credit proxy based on the HYG divided by LQD ratio.
SPX z-score shows how far the S&P 500 is from its rolling average.
Credit z-score shows how risk-seeking or risk-averse credit markets are by comparing high-yield bonds to investment-grade bonds.
When both z-scores move together, the market is aligned in either risk-on or risk-off conditions.
When SPX z-score is strong but credit z-score is weak, this may signal equity strength that is not supported by credit markets.
When credit z-score is stronger than SPX z-score, credit markets may be leading risk appetite.
The indicator plots the two z-scores as simple lines for clear regime comparison.
RSI Golden & Dead Cross AlertRSI 14 Golden And Dead Cross Indicator
It will give you an alert when there are rsi golden and dead cross.
It is a intergated signal: Crossing up and Crossing down of RSI.
Daily High/Low/50%Daily High/Low/50% Levels Indicator
This Pine Script v6 indicator displays three horizontal lines from the previous daily candle:
High: The highest price of the last daily candle
Low: The lowest price of the last daily candle
50%: The midpoint between high and low
Key Features:
Lines extend from one daily candle to the next (Monday to Tuesday, Tuesday to Wednesday, etc.)
Fully customizable styling for each line independently:
Color selection
Line style (Solid, Dashed, Dotted)
Line width/thickness
Small labels ("H", "L", "50%") mark the start of each new day
Works on any timeframe (intraday charts show daily levels as reference)
Use Case:
Perfect for intraday traders who want to see the previous day's key levels as support/resistance zones. The 50% level often acts as a pivot point for price action.
Séparateur H4 & DailyH4 & Daily Separator - TradingView Indicator
This Pine Script v6 indicator draws infinite vertical lines to mark H4 and Daily candle separations on your chart.
Features:
H4 Separations: Marks candles starting at 3am, 7am, 11am, 3pm, 7pm, and 11pm
Daily Separations: Marks candles starting at midnight (00:00)
Fully Customizable:
Toggle H4 and/or Daily lines independently
Choose line color, thickness (1-4), and style (Solid, Dotted, Dashed)
Control the number of visible vertical lines (1-500)
Use Case:
Perfect for traders who want to visualize higher timeframe separations while trading on lower timeframes. Helps identify H4 and Daily candle opens without switching charts.
Installation:
Simply copy the code into TradingView's Pine Editor and add it to your chart. All settings are adjustable in the indicator's settings panel.
Sanjay AhirPull Backs , Swings Marking
useful for market structure
useful For Smc Strcture
useful for ICT mapping
Daily Oversold Swing ScreenerThat script is a **Pine Script Indicator** designed to identify potential **swing trade entry points** on a daily timeframe by looking for stocks that are **oversold** but still in a **healthy long-term uptrend**.
It screens for a high-probability reversal setup by combining four specific technical conditions.
Here is a detailed breakdown of the script's purpose and logic:
---
## 📝 Script Description: Daily Oversold Swing Screener
This Pine Script indicator serves as a **momentum and trend confirmation tool** for active traders seeking short-to-intermediate-term long entries. It uses data calculated on the **Daily** timeframe to generate signals, regardless of the chart resolution you are currently viewing.
The indicator is designed to filter out stocks that are in a strong downtrend ("falling knives") and only signal pullbacks within an established uptrend, which significantly increases the probability of a successful swing trade bounce.
### 🔑 Key Conditions for a Signal:
The indicator generates a buy signal when **all four** of the following conditions are met on the Daily timeframe:
#### 1. Oversold Momentum
* **Condition:** `rsiD < rsiOS` (Daily RSI is below the oversold level, typically **30**).
* **Purpose:** Confirms that the selling pressure has been extreme and the stock is temporarily out of favor, setting up a potential bounce.
#### 2. Momentum Turning Up
* **Condition:** `rsiD > rsiPrev` (Current Daily RSI value is greater than the previous day's Daily RSI value).
* **Purpose:** This is the most crucial filter. It confirms that the momentum has **just started to shift upward**, indicating that the low may be in and the stock is turning away from the oversold region.
#### 3. Established Uptrend (No Falling Knives)
* **Condition:** `sma50 > sma200 and closeD > sma50` (50-day SMA is above the 200-day SMA, AND the current daily close is above the 50-day SMA).
* **Purpose:** This is a **long-term trend filter**. It ensures that the current oversold condition is just a **pullback** within a larger, structurally bullish market (50 > 200), and that the price is still holding above the short-term trend line (Close > 50 SMA). This effectively screens out weak stocks in continuous downtrends.
#### 4. Price at Support (Bollinger Bands)
* **Condition:** `closeD <= lowerBB` (Daily Close is less than or equal to the lower Bollinger Band).
* **Purpose:** Provides a secondary measure of extreme price deviation. When the price touches or breaches the lower band, it suggests a significant move away from the mean (basis), often signaling strong statistical support where price is likely to revert.
### 📌 Summary of Signal
The final signal (`signal`) is triggered only when the market is confirmed to be **in a healthy long-term trend (Condition 3)**, the price is at an **extreme support level (Condition 4)**, the momentum is **oversold (Condition 1)**, and most importantly, the **momentum has begun to reverse (Condition 2)**.
9 AM 12-Bar Zoneplaces a 12 bar box around the 9 am hour. The idea is to see if there is a pattern of activity around suspected institutional moves that occur in the opening hour of the new york market
dr ram's banknifty fad%banknifty fad% calculation as per dr ram sir. based on 4 quadrant analysis . one of the criteria is calculating future asset difference for predicting market direction and entry plan.
Kaufman Adaptive Moving Average + ART**Kaufman Adaptive Moving Average (fixed TF) + ATR Volatility Bands**
This script is a Pine Script v5 extension of the original *Kaufman Adaptive Moving Average* by Alex Orekhov (everget).
It adds:
* a **fixed timeframe option** for KAMA
* a separate **ATR panel under the chart**
* **configurable ATR volatility levels** with dynamic coloring.
KAMA adapts its smoothing to market conditions: it speeds up in strong trends and slows down in choppy phases. Here, KAMA can be calculated on any timeframe (e.g. 1D) and overlaid on a lower-timeframe chart (e.g. 1H), so you can track higher-TF trend structure while trading intraday.
The ATR panel visualizes volatility in the same or a separate timeframe and highlights phases of high/low volatility based on user-defined thresholds.
---
### Features
**KAMA (on chart)**
* Standard KAMA parameters: `Length`, `Fast EMA Length`, `Slow EMA Length`, `Source`
* Input: **KAMA Timeframe**
* empty → uses chart timeframe
* any value (e.g. `60`, `240`, `D`, `W`) → calculates KAMA on that fixed TF and maps it to the chart
* Color-changing KAMA line:
* **green** when the selected-TF KAMA is rising
* **red** when it is falling
* Optional *Await Bar Confirmation* to avoid reacting to still-forming bars
* Built-in alert when the KAMA color changes (potential trend shift).
**ATR panel (separate window under the chart)**
* Own inputs: `Show ATR`, `ATR Length`
* **ATR Timeframe** input:
* empty → ATR uses the same TF as KAMA
* custom value → fully independent ATR timeframe
* Two user-defined volatility levels:
* `ATR High Vol Level` – threshold for **high volatility**
* `ATR Low Vol Level` – threshold for **low volatility**
* ATR line coloring:
* **red** when ATR > High Vol Level (high volatility regime)
* **green** when ATR < Low Vol Level (quiet market)
* **blue** in the normal range between the two levels.
---
### How to use
1. Add the script to your chart.
2. Choose a **KAMA Timeframe** (leave empty for chart TF, or set to a higher TF for multi-timeframe trend following).
3. Optionally set a different **ATR Timeframe** to monitor volatility on yet another TF.
4. Adjust `ATR High Vol Level` and `ATR Low Vol Level` to match the instrument and timeframe you trade.
5. Use:
* the **KAMA color changes** as trend / regime signals, and
* the **ATR colors & levels** to quickly see whether you’re trading in a low-, normal- or high-volatility environment.
This combination is designed to keep the chart itself clean (only KAMA on price) while giving you a dedicated volatility dashboard directly underneath.
67Major Market Trading Hours
New York Stock Exchange (NYSE)
Open: 9:30 AM (ET)
Close: 4:00 PM (ET)
Pre-Market: 4:00 AM – 9:30 AM (ET)
After Hours: 4:00 PM – 8:00 PM (ET)
Nasdaq
Open: 9:30 AM (ET)
Close: 4:00 PM (ET)
Pre-Market: 4:00 AM – 9:30 AM (ET)
After Hours: 4:00 PM – 8:00 PM (ET)
London Stock Exchange (LSE)
Open: 8:00 AM (GMT)
Close: 4:30 PM (GMT)
Tokyo Stock Exchange (TSE)
Open: 9:00 AM (JST)
Lunch Break: 11:30 AM – 12:30 PM (JST)
Close: 3:00 PM (JST)
Hong Kong Stock Exchange (HKEX)
Open: 9:30 AM (HKT)
Lunch Break: 12:00 PM – 1:00 PM (HKT)
Close: 4:00 PM (HKT)
If you'd like anything bigger, bold, color‑coded, or reorganized, just tell me and I’ll adjust it!
Kaufman Adaptive Moving Average (fixed TF)**Kaufman Adaptive Moving Average – fixed Timeframe version (Pine v5)**
This script is a Pine Script v5 adaptation of the original *Kaufman Adaptive Moving Average* by Alex Orekhov (everget), extended with the ability to calculate KAMA on a **fixed timeframe**. You can keep the calculation on your current chart timeframe or lock it to any higher timeframe (for example 1D on a 1H chart) and still display the line on your active chart.
KAMA automatically adjusts its smoothing based on price efficiency: it becomes faster in trending markets and slower in choppy ones. This version colors the line green/red depending on the direction of the KAMA on the **selected timeframe**, and includes an optional “await bar confirmation” setting to avoid reacting to still-forming bars.
**Main features**
* Original Kaufman Adaptive Moving Average logic (length, fast/slow EMA lengths, source input)
* Optional **fixed timeframe** input for the KAMA calculation (leave empty to use chart timeframe)
* Non-repainting higher-timeframe calculation using `request.security()`
* Dynamic color change (green/red) based on KAMA trend on the chosen timeframe
* Optional bar-confirmation filter for more conservative color changes
* Built-in alert on color change (trend shift)
**How to use**
1. Add the indicator to your chart.
2. Leave “KAMA Timeframe” empty to use the chart’s timeframe (standard KAMA).
3. Or set “KAMA Timeframe” to a higher TF (e.g. `60`, `240`, `D`, `W`) to overlay a higher-timeframe KAMA on a lower-timeframe chart.
4. Use the color changes or the alert to identify potential trend shifts in the selected timeframe while watching price action on your working timeframe.
INDIVIDUAL ASSET BIAS DASHBOARD V3Strategy Name: Individual Asset Bias Dashboard V3
Author Concept: Multi-timeframe 3-pivot alignment bias monitor
Timeframe: Works on any chart, but bias is calculated on daily close vs higher timeframe pivots
Core Idea (3-Pivot Rule)
For each asset we compare the current daily closing level against three classic pivots from higher timeframes:
Previous Weekly pivot: (H+L+C)/3 of last completed week
Previous Monthly pivot: (H+L+C)/3 of last completed month
Previous 3-Monthly pivot: (H+L+C)/3 of last completed quarter
Bias Logic:
BULL → Price is above all three pivots
BEAR → Price is below all three pivots
MIXED → Price is in between (no clear alignment)
This is a clean, objective, and widely used institutional method to gauge short-term momentum alignment across multiple horizons.
Assets Tracke
SymbolMeaningSPX500S&P 500 IndexVIXVolatility IndexDXYUS Dollar IndexBTCUSDBitcoinXAUUSDGoldUSOILWTI Crude OilUS10Y10-Year US Treasury YieldUSDJPYJapanese Yen pair
Key Features
Real-time updating table in the bottom-left corner
Color coding: Lime = Bullish, Red = Bearish, Gray = Mixed
Optional "Change" column showing flips (▲/▼) when bias changes day-over-day
No repainting on closed daily bars (critical for reliability)
Compliant with TradingView rules (proper lookahead usage explained below)
Important Technical Notes (Why No Repainting)
lookahead = barmerge.lookahead_on is used only for higher-timeframe historical pivots → allowed and standard practice
Current price uses lookahead = barmerge.lookahead_off → reflects actual tradable daily close
Table only draws on barstate.islastconfirmedhistory or barstate.islast → prevents false signals on realtime bar
Limitations & Warnings
On intraday charts, the "current bias" updates with every tick using the running daily close
Bias can flip intraday before daily bar closes
On daily or higher charts, the dashboard is 100% confirmation-based and non-repainting
This is a bias filter, not a standalone trading system
Trading Sessions Low and HighVisualize and analyze different trading sessions (Tokyo, London, New York) on your charts.
Key Features:
Colored Session Zones: Displays colored rectangles to visually identify each active trading session
Smart High/Low Lines:
Draws horizontal lines at the highest and lowest points of each session
These lines automatically extend forward in time until a candle crosses them
Helps identify support/resistance levels created during each session
Detailed Session Information:
Range (difference between highest and lowest points)
Average price of the session
Open and close lines
Full Customization:
Choose the number of historical sessions to display (e.g., last 10, 20 sessions)
Line style and width for high/low lines
Enable/disable each element independently
Trading Benefits:
Identify liquidity zones created during each session
Spot key levels that continue to influence price after a session closes
Analyze volatility and price behavior across different sessions
Detect breakouts of important levels established during previous sessions
Weekday HighlighterThis is a simple indicator that highlights specific weekdays on the chart.
You can choose which weekdays to highlight and optionally use different colors for each day. It is useful for visually separating sessions such as Mondays, Fridays, or any custom trading day you want to focus on.
ただ単に曜日を指定してハイライトするインジです。
Green13 - Watermark with Daily ATRWatermark with custom texts and with Daily ATR and the name of the week
Dashboard Principales sectores🔍 What This Dashboard Shows
Performance of the top 20 U.S. market sectors and ETFs (e.g., Technology, Energy, Financials, Biotechnology, Semiconductors, etc.).
Percentage change based on the selected chart timeframe:
Daily timeframe → daily change
Weekly timeframe → weekly change
Monthly timeframe → monthly change
Ticker symbol displayed next to each sector name.
Color-coded performance for quick interpretation:
🟩 Positive
🟥 Negative
🟨 Neutral


