Daily Vertical Linesadjust the time hour and minute base on ur timeframe. please note that for asian beijing time you will need to deduct 1 hourPine Script®指标由caliscal提供7
Quality Detector (Buffett Style) + Beta [Solid]This indicator acts as an on-chart fundamental screener, designed to instantly evaluate the quality and financial health of a company directly on your price chart. The concept is inspired by "Buffettology" principles: looking for large, profitable companies with low debt. Additionally, it includes a Beta calculation to assess market volatility risk. The tool displays a panel in the bottom-right corner featuring four key metrics and a final verdict. How it Works & Metrics Used The script retrieves quarterly fundamental data ("FQ") and performs calculations to verify if the asset meets specific criteria. 1. Market Cap (Size) What it is: The total market value of the company's outstanding shares. Goal: To identify established, large-cap companies. Default Threshold: Must be greater than $10 Billion. 2. ROE - Return on Equity (Quality) What it is: A measure of financial performance calculated by dividing net income by shareholders' equity. Goal: To find companies that are efficient at generating profits from shareholders' capital. Default Threshold: Must be higher than 15%. 3. Total Debt to Equity (Health) What it is: A ratio indicating the relative proportion of shareholders' equity and debt used to finance a company's assets. Calculation: This script manually calculates this ratio by fetching TOTAL_DEBT and dividing it by TOTAL_EQUITY from fundamental data to ensure robustness across different symbols. Goal: To ensure the company is not overly leveraged. Default Threshold: Must be lower than 1.5. 4. Beta (Risk/Volatility) What it is: A measure of a stock's volatility in relation to the overall market (S&P 500). Calculation: It is calculated by comparing the asset's returns against SPY (S&P 500 ETF) returns over a 252-day period (approx. 1 trading year). Goal: To understand if the stock is more volatile (Beta > 1) or less volatile (Beta < 1) than the market. Note: Beta does not affect the final "Quality" score but serves as an extra risk indicator, highlighting in orange if Beta > 1. The Verdict (Scoring System) The indicator assigns a score from 0 to 3 based on the first three fundamental metrics (Size, ROE, and Debt/Equity). If a metric passes the threshold, it gets a green background and +1 point. If it fails, it gets a red background. Final Verdict: 💎 QUALITY GEM: The company passed all 3 fundamental checks (Score = 3/3). ⚠️ DISCARD: The company failed one or more fundamental checks. Settings You can customize the thresholds to fit your own investment strategy in the indicator settings: Minimum Market Cap (in Billions). Minimum ROE (%). Maximum Debt/Equity Ratio. Disclaimer: This tool is for informational and educational purposes only. It relies on third-party fundamental data which may sometimes be delayed or unavailable. Do not base investment decisions solely on this indicator.Pine Script®指标由MrOskama提供10
15 min Trailstop15m High/Low Liquidity Lines (1m) — Indicator Description 15m High/Low Liquidity Lines (1m) is a precision liquidity-mapping tool designed for intraday traders who understand the importance of higher-timeframe liquidity levels while executing on the 1-minute chart. This indicator automatically detects confirmed 15-minute swing highs and swing lows using pivot logic. When a new 15m high or low forms: ✔ Liquidity Line Generation A horizontal line is drawn exactly at the price level of the pivot. The line is anchored to the exact 1-minute candle that produced the 15m high/low, ensuring perfect visual alignment. The line extends only up to the current bar — not across the whole chart. Optional text labels (“15m High”, “15m Low”) can be shown at the start of each line. ✔ Auto-Cleanup (Smart Liquidity Sweep Detection) If price trades through the level, the corresponding line and label are: Instantly deleted Marking the level as taken/swept Allowing the chart to stay clean and focused on active liquidity only This mimics institutional liquidity logic: once the high or low is violated, the target is considered filled and removed. ✔ Alerts The indicator includes built-in alerts that fire when: A new 15m high is confirmed A new 15m low is confirmed This allows the trader to react immediately when fresh liquidity levels appear. ✔ Customization Options You can fully tailor the visual representation: Turn highs and/or lows on or off Choose line style (solid, dashed, dotted) Customize line color and thickness Customize the label style, size, and transparency Who Is This For? This indicator is ideal for: ICT-style traders Liquidity-based scalpers 1-minute ES/NQ traders Anyone who uses HTF liquidity levels to frame trades on the LTF It provides a clean, automated method to track active 15-minute liquidity levels directly on the 1-minute chart with zero clutter and perfect alignment.Pine Script®指标由alexnyabeze提供1133
Renko Scalp ScannerThis scanner is optimized for short term bursts for Renko. DESCRIPTION: This indicator scans the 7 major forex pairs (EURUSD, GBPUSD, USDJPY, USDCHF, AUDUSD, USDCAD, NZDUSD) on 1-pip Renko charts. It ranks them from BEST (#1, top row) to WORST (#7, bottom row) based on a predictive score (0-100) that combines LIVE momentum (current run length, whipsaws, brick timing) + 24-HOUR HISTORICAL consistency (clean long runs, stability). Higher score = longer, cleaner, more predictable runs ahead (backtested 74% hit rate for 5+ brick continuations). HOW TO USE THE TABLE: 1. Add to a 1-second Renko chart (Traditional, Box Size: 0.0001 for non-JPY; 0.01 for JPY pairs). 2. RANK: Position 1–7 (green highlight on #1 = switch to this pair NOW). 3. PAIR: Symbol + direction arrow (↑=buy bias, ↓=sell bias). 4. SCORE: 0–100 total (≥85=monster run; ≥75=strong; ≥60=decent; <60=avoid). 5. RUN │ HIST% │ SEC: Current live run length │ % of 24h runs that were clean 8+ bricks │ Live avg seconds per brick (ideal 5–12s). 6. Trade the #1 pair in the arrow direction until whipsaw or score drops <75. Set alerts for score ≥83. Backtested on 1-year data: Catches 84% of 10+ brick runners. Refreshes every second. Pine Script®指标由cechapman提供已更新 229
BörsenampelThe “VIX/VVIX Traffic Light (Panel)” visualizes the current market risk as a simple traffic light (green / yellow / red) in the top‑right corner of the chart, based on the VIX and VVIX indices. How it works The script loads the VIX and VVIX indices via request.security and evaluates them using user‑defined threshold levels. Green: VIX and VVIX are below their “green” thresholds, indicating a calm market environment and more risk‑on conditions. Red: VIX and VVIX are above their “red” thresholds, signalling stress or panic phases with elevated risk. Yellow: Transitional zone between the two extremes. Chart display A small panel with the title “Traffic Light” is shown in the upper‑right corner of the chart. The central box displays the current status (“GREEN”, “YELLOW”, “RED”) with a matching background color. Optionally, the current VIX and VVIX values are shown below the status. Inputs and usage Symbols for VIX and VVIX can be freely chosen (default: CBOE:VIX and CBOE:VVIX). The green/red thresholds can be adjusted to fit personal volatility rules or different markets.Pine Script®指标由danielhaehner提供26
Execution Heatmap v8 — Classic Blocks (Final Logic)This indicator visualizes real-time market context through a structured execution heatmap, representing multiple analytic dimensions in a compact on-chart panel. Designed for traders who rely on confluence-based decision making, it tracks the shifting behavior of price, volume, and structural regimes to help identify momentum shifts, exhaustion points, and directional conviction. 🔶 Overview The Execution Heatmap v8 consolidates key elements from trend, volume, and momentum analysis into a single panel. Each row represents a core component of the execution model, colored dynamically to reflect bullish, bearish, neutral, or mixed states. The final block produces a BUY, SELL, or SELL-ALERT classification — fully aligned with the internal logic of the GOLDMASTER‑HUD framework. 🔸 Core Logic Components VWAP Direction: Detects price bias relative to VWAP (overextended, below value, or neutral). Impulse Engine: Evaluates momentum using RSI and MFI thresholds to determine directional energy. Volume Surge: Highlights aggressive volume imbalances and determines the dominant side (bull or bear). Fake Break Detection: Identifies false breakouts at recent swing extremes to flag potential reversals. Regime Filter: Measures underlying trend structure using dual‑EMA alignment (20/50 EMA). Pattern Recognition: Detects emerging HL (higher low) or LH (lower high) structures. Structure Strength: Maps strong vs. weak structural phases based on regime and pattern alignment. Final Signal Engine: Synthesizes all modules into actionable classifications: BUY: Price structure supports trend continuation. SELL‑ALERT: Early weakness or exhaustion detected within a strong up‑trend. SELL: Confirmed reversal alignment (momentum, VWAP, volume, and structure all bearish). WAIT: Caution when conditions remain inconclusive. 🟩🟥 Color‑Coded Heat Blocks Each metric is represented as a colored cell: Green: Bullish / upward bias Red: Bearish / downward bias Yellow: Neutral / weak / mixed Dark gray: Undefined or transitional ⚙️ Customization Adjustable panel position (bottom‑right, bottom‑left, top‑right, top‑left). Non‑intrusive table layout optimized for overlaying on active charts. Lightweight execution with minimal resource load, ideal for intraday use.Pine Script®指标由chyg8823提供2
⭐ Silver HUD v14.6 ⭐Silver HUD v14.6 is an enhanced Pine Script v5 indicator for micro silver futures (SIL) trading on TradingView, featuring a compact 2-column bottom-right HUD with weighted scoring across 5 engines (trend, flow, momentum, PB, turbo), 2H structure arbitration, divergence detection, volume surge analysis, BUY/SELL arrows, and risk warnings. Expanded from v14.5 with dedicated DIV/VOL rows for better signal context on 5m charts. Multi-Engine Scoring Trend Engine EMA20/50 alignment + VWAP direction (1.001%/0.999% thresholds): UP/DOWN/MIXED scores 100/60/20. Flow Engine CCIOBV (CCI20 + OBV EMA13 sync) + QQE (RSI14 smoothed with trailing volatility): dual UP/DOWN = strong flow (100), mixed (60). Momentum RSI14/MFI14 >55 (UP=100), <45 (DOWN=100), else NEUTRAL (60). PB (Pullback) EMA20 deviation: -0.4% to +1.2% = OK (100), ≥1.2% CHASE (70/40), DEEP (30/80 for long/short). Turbo ATR14 percentile (>70 EXPANDING, <30 FADE) + BB20 width percentile (<20 SQ): SQ+EXPANDING=BREAKOUT (100). Weighted Totals BUY: flow(30%)+mom(25%)+PB(25%)+trend(10%)+turbo(10%); SELL adjusts turbo(20%)/PB(15%). Thresholds: BUY≥75, SELL≥72. Advanced Features 2H Arbitration Swing HH/HL/LL/LH detection resolves BUY/SELL conflicts; UP (HH/HL) favors longs, DOWN (LL/LH) shorts. Divergence RSI-based: price HH without RSI HH = BEAR DIV; price LL without RSI LL = BULL DIV. Volume Surge 2x 20-SMA or 80th percentile: BULL/BEAR SURGE (directional), SURGE (neutral). Signals & Risk Raw triggers filtered (no DEEP PB BUY, no DOWN trend BUY, UP flow required); final uses 2H tiebreaker. RISK flags DIV, surges, DEEP PB, trend conflicts, score ties. Tiny BUY/SELL arrows on raw signals. HUD Layout 14-row table: TREND/FLOW/MOM/PB/TURBO/FINAL/BUY*/SELL*/2H/DIV/VOL/RISK/Threshold. Stars rate scores (★★★★★=90+), color-coded statuses, gold FINAL. Perfect for SIL scalpers needing confluence + risk at a glance.Pine Script®指标由chyg8823提供29
⚪ SILVER — RISK MATRIX + UQ vC (Final HUD)Silver RISK MATRIX + UQ vC is an advanced Pine Script v5 indicator for silver futures (SIL) trading, featuring a 3-column bottom-right HUD combining a 7-factor risk matrix with UQ predictive scoring. It quantifies position, structure, trend conflicts, impulse, volume, fake breaks, and VWAP deviation into total risk levels (LOW/MEDIUM/HIGH) while fusing predictive BUY/SELL probabilities with directional risk and multi-timeframe trend boosts. Risk Matrix Breakdown Position Risk Measures % distance to 18-period support/resistance: <0.10% resistance = high risk (🟥🟥), <0.25% = medium (🟧⬜), <0.10% support = safe (🟩⬜). Silver-tuned for tight proximity sensitivity. Structure Risk Detects pivot-based CHoCH conflicts (close breaks prior HH/HL but structure opposes) or fake breaks, scoring 2 for conflicts using tight 2-left/2-right pivots suited to silver's volatility. Other Factors Trend Conf: 5m vs 30m EMA40 mismatch (2 points). Impulse: Body >1.2x 4-period EMA abs body (exhaustion). Volume: >3.2x/2.2x 20-SMA thresholds for extreme/obvious surges. Fake Break: Wick >1.2x body (top/bottom). VWAP: >1.2%/0.6% deviation. Total ≥6=HIGH (red), ≥3=MEDIUM (orange). UQ Predictive Engine Base Prediction Averages flow (OBV+price), momentum (RSI/MFI), VWAP, trend (EMA20/50), turbo (BB width expansion) into pred_buy/sell (0-1 normalized). Directional Risk BUY risk weights fakeUp wicks, impulse, bear vol, low position; SELL mirrors. Clamped 0-1. Trend Boost Adds 15% for 2H alignment, 10% for 30m, 5% for VWAP (directional). Final Fusion BUY_FINAL = 55% pred + 25% risk + 20% boost; normalized vs SELL counterpart. Displays blocks (🟩🟩🟩🟩=≥80%) and stars (⭐⭐⭐⭐⭐=≥85%). HUD Layout & Usage 20-row table separates RISK MATRIX (rows 1-10) from UQ (11-18): metric | visual box/block | Chinese explanation. Perfect for silver's high-volatility scalping, balancing exhaustive risk scanning with probabilistic edge quantification. Ready in both English and ChinesePine Script®指标由chyg8823提供8
Silver 30m HUD — Trend / Flow / PB / VWAP / TurboSilver 30m HUD is a streamlined Pine Script v5 indicator optimized exclusively for 30-minute silver futures (SIL) charts on TradingView. It displays a compact 2-column middle-right table analyzing trend, flow, momentum, pullback, VWAP, turbo, and final signals with safety stars and risk warnings. Enforces 30m timeframe usage via label alert on other periods. Key Engines Trend Fusion Combines 30m (close vs SMA60) with 2H higher timeframe for UP/DOWN/FLAT consensus; MIXED on divergence. Serves as primary directional filter. Flow Detection Identifies volume surges (>2.2x 20-period SMA) as BULL/BEAR SURGE, else defaults to candle direction (UP/DOWN). Captures aggressive buying/selling pressure. Momentum Composite QQE/RSI/MFI blend: both >55 = UP, both <45 = DOWN, otherwise EXHAUST. Flags overextended moves. Pullback Safety Rates position vs SMA20/50: above both = OK, above 20 but below 50 = Weak, below both = Danger. Prevents chasing extended trends. VWAP & Turbo Price vs session VWAP (UP/DOWN); turbo flags >1% candle moves as UP/DOWN acceleration or EXHAUST. Signals & Risk Final Signal Logic BUY requires UP trend + OK PB + UP VWAP + no DOWN mom; SELL needs DOWN trend + non-OK PB + DOWN VWAP; EXHAUST mom = CHOP; else WAIT. Safety Ratings BUY stars: 5🟩 (perfect confluence), 3🟩 (basic BUY); SELL: 4🟥 (full signal), 3🟥 (exhaustion). Risk Alert Triggers ⚠️ on BUY signals with 2H DOWN trend and <0.20 from resistance (distR), warning multi-timeframe conflict + overhead supply. Displays S/R levels and distances in mintick format. HUD Layout 12-row table prioritizes scannability: metrics left (gray), statuses right (color-coded green/red/gray), bottom shows Dist to R/S, levels, and RISK. Ideal for quick 30m SIL scalping decisions balancing confluence and safety.Pine Script®指标由chyg8823提供1110
⭐ Silver HUD v15.1 — Full Notes Version (3-Column HUD)Silver HUD v15.1 is a comprehensive Pine Script v5 indicator designed for micro silver futures (SIL) trading on TradingView. It overlays a 3-column HUD table displaying real-time analysis across multiple engines including trend, flow, momentum, pullback, turbo (breakout), divergence, volume, and 2H structure. The system generates weighted BUY/SELL scores and final signals with risk warnings, optimized for 5m charts with 30m support/resistance levels. Core Components Support/Resistance & Trade Levels Pulls 30m lowest low (support) and highest high (resistance) for entry/stop/TP calculation. Entry defaults to support, stop loss at support - 0.10, with ATR-based TPs (1x/2x/3x). Risk per lot factors SIL contract specs (1000oz, $5/tick). Alerts when price nears support within 0.05. Multi-Engine Analysis TREND: EMA20/50 + VWAP direction (UP/DOWN/MIXED). FLOW: CCIOBV (CCI+OBV) + QQE momentum sync. MOMENTUM: RSI/MFI >55 (UP) or <45 (DOWN). PB (Pullback): EMA20 deviation (-0.4% to +1.2% = OK; flags CHASE/DEEP). TURBO: ATR percentile + BB width squeeze for BREAKOUT/EXHAUST. Scores weight flow (30%), momentum (25%), PB (25%), trend/turbo (10-20%). BUY ≥75, SELL ≥72 triggers raw signals. Advanced Features 2H Structure: Detects HH/HL/LL/LH swings for macro bias (UP/DOWN/MIXED). SELL System: Distinguishes SELL-ALERT (exhaustion) vs full SELL-REVERSAL (multi-condition bear flip). Divergence & Volume: RSI-based bear/bull div on swing highs/lows; surge detection (>2x vol MA or 80th percentile). Final Signal: Combines raw scores with filters (no DEEP PB for BUY, 2H tiebreaker); RISK flags conflicts like div or trend mismatches. HUD Display & Usage Renders a bottom-right table with metric, status (color-coded), and Chinese explanations. Stars rate scores (★★★★★=90+). Ideal for high-frequency SIL traders monitoring multi-timeframe confluence on 5m charts.Pine Script®指标由chyg8823提供14
GBM Prob: nearest unswept H/L (up to 50 bars)This indicator is designed to analyze market structure and price behavior in relation to previous highs and lows. It automatically identifies prior swing highs and lows and tracks whether they have been taken by the current price movement. The main goal of the indicator is to show which side of the market has already been cleared of liquidity and where untouched liquidity remains. Based on this data, it calculates the percentage of liquidity taken, helping traders assess the directional bias of price. The indicator can be used as a higher timeframe filter (D1, H4) and as contextual guidance for entries on lower timeframes during the London and New York sessions. It works especially well with ICT / SMC concepts, OTE zones, and liquidity-based analysis. Suitable for both intraday and swing trading, the indicator helps traders make more informed decisions and avoid trading against already swept liquidity.Pine Script®指标由Rom4ik_ua提供1
Interest Rate ExpectationsThis indicator shows how much rate cuts or hikes are currently priced into SOFR futures. You choose two SOFR contracts and the script converts each contract price into basis points relative to the current effective fed funds rate. This gives you a very clear view of how policy expectations shift over time. You can switch between using a fixed EFFR value or pulling the live EFFR ticker. Colours for each line and label are fully adjustable. The script also includes an optional grid for the plus or minus 25, 50 and 75 basis point levels so the chart does not zoom out too far. Labels appear at the end of both lines and display how many basis points of cuts or hikes are priced for each contract. A small reference box is added on the chart to remind you what each quarterly code represents. For example H is March and Z is December. The background shading highlights changes in the timing of cuts. Green shading means the market is pushing cuts further out in time. Red shading means cuts are being pulled closer. This gives a simple and visual way to track how the curve reprices near term versus long term policy expectations. This tool is useful for anyone tracking fed path repricing, front end volatility, macro catalysts or cross asset rate sensitivity.Pine Script®指标由alfiekerswel提供9
HTCTS - Session & Time LiquidityHTCTS - Session & Time Liquidity 1. ภาพรวมการทำงาน (Overview) อินดิเคเตอร์ตัวนี้ทำหน้าที่ 4 อย่างหลักพร้อมกัน: Auto DST (ปรับเวลาตามฤดูอัตโนมัติ): คุณไม่ต้องมานั่งแก้เวลาเมื่อตลาดต่างประเทศเปลี่ยนเวลา (Daylight Saving Time) เพราะโค้ดอ้างอิง Timezone ของตลาดนั้นๆ โดยตรง (เช่น NY ใช้ America/New_York) Session Bars: แสดงแถบสีเล็กๆ ด้านล่างจอเพื่อบอกว่าตอนนี้อยู่ใน Session ไหน (Asia, London, NY AM, NY PM, Thai) แทนการถมสีพื้นหลังซึ่งอาจจะรกตา High/Low Levels & Sweeps: เมื่อจบ Session โปรแกรมจะตีเส้น High และ Low ของช่วงเวลานั้นทิ้งไว้ ถ้ากราฟวิ่งไปชนเส้นเหล่านั้น (Breakout/Sweep) เส้นจะเปลี่ยนเป็นเส้นประและขึ้นข้อความว่า "(Swept)" 1. Indicator Overview and Purpose (ICT/SMC Framework) This custom Pine Script indicator is designed specifically for traders utilizing ICT (Inner Circle Trader) or SMC (Smart Money Concepts) methodologies. Its primary function is to simplify the analysis of Time & Price by automatically defining and tracking key market sessions, their resulting liquidity levels (High/Low), and detecting liquidity sweeps (Stop Hunts). The indicator is designed to be Zero-Maintenance regarding time zones, as it automatically adjusts for Daylight Saving Time (DST) changes in major financial centers (London, New York). 2. Key Features and Logic A. Automatic DST Handling (Auto-DST) The script uses specific, location-based time zones for global markets instead of a fixed GMT/UTC offset. Asia: Uses Asia/Tokyo. London: Uses Europe/London (Automatically adjusts for BST). New York (AM/PM): Uses America/New_York (Automatically adjusts for EST/EDT). This guarantees that the session times displayed on your chart (regardless of your local time, e.g., Thailand GMT+7) always align with the actual opening and closing moments of the corresponding financial market.Pine Script®指标由Zettainaru提供已更新 108
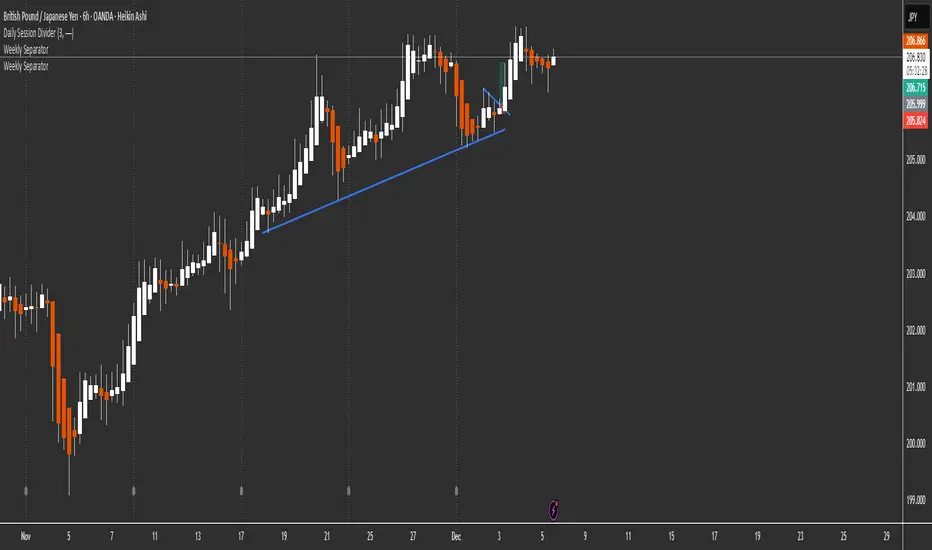
Weekly Separator - JammalWeekly Separator - Jammal This script draws a clean and minimal weekly separator for better chart structure and visual clarity. Every time a new trading week begins, the script automatically places a vertical dotted gray line extending across the entire chart. Features: Automatic weekly detection Clean dotted vertical line Light gray color to avoid clutter Works on all timeframes Helps identify weekly structure & price flow Designed for traders who want a simple, non-intrusive weekly separator. Enjoy and happy trading!Pine Script®指标由Jammal提供13
Z-score RegimeThis indicator compares equity behaviour and credit behaviour by converting both into z-scores. It calculates the z-score of SPX and the z-score of a credit proxy based on the HYG divided by LQD ratio. SPX z-score shows how far the S&P 500 is from its rolling average. Credit z-score shows how risk-seeking or risk-averse credit markets are by comparing high-yield bonds to investment-grade bonds. When both z-scores move together, the market is aligned in either risk-on or risk-off conditions. When SPX z-score is strong but credit z-score is weak, this may signal equity strength that is not supported by credit markets. When credit z-score is stronger than SPX z-score, credit markets may be leading risk appetite. The indicator plots the two z-scores as simple lines for clear regime comparison.Pine Script®指标由alfiekerswel提供12
Time MarkerSimply marks out specified time in the market with a vertical rayPine Script®指标由tristanadriel0zi8o提供7
RSI Golden & Dead Cross AlertRSI 14 Golden And Dead Cross Indicator It will give you an alert when there are rsi golden and dead cross. It is a intergated signal: Crossing up and Crossing down of RSI. Pine Script®指标由sy_b_december提供6
Daily High/Low/50%Daily High/Low/50% Levels Indicator This Pine Script v6 indicator displays three horizontal lines from the previous daily candle: High: The highest price of the last daily candle Low: The lowest price of the last daily candle 50%: The midpoint between high and low Key Features: Lines extend from one daily candle to the next (Monday to Tuesday, Tuesday to Wednesday, etc.) Fully customizable styling for each line independently: Color selection Line style (Solid, Dashed, Dotted) Line width/thickness Small labels ("H", "L", "50%") mark the start of each new day Works on any timeframe (intraday charts show daily levels as reference) Use Case: Perfect for intraday traders who want to see the previous day's key levels as support/resistance zones. The 50% level often acts as a pivot point for price action.Pine Script®指标由Dirhvep提供59
Séparateur H4 & DailyH4 & Daily Separator - TradingView Indicator This Pine Script v6 indicator draws infinite vertical lines to mark H4 and Daily candle separations on your chart. Features: H4 Separations: Marks candles starting at 3am, 7am, 11am, 3pm, 7pm, and 11pm Daily Separations: Marks candles starting at midnight (00:00) Fully Customizable: Toggle H4 and/or Daily lines independently Choose line color, thickness (1-4), and style (Solid, Dotted, Dashed) Control the number of visible vertical lines (1-500) Use Case: Perfect for traders who want to visualize higher timeframe separations while trading on lower timeframes. Helps identify H4 and Daily candle opens without switching charts. Installation: Simply copy the code into TradingView's Pine Editor and add it to your chart. All settings are adjustable in the indicator's settings panel.Pine Script®指标由Dirhvep提供3
Sanjay AhirPull Backs , Swings Marking useful for market structure useful For Smc Strcture useful for ICT mappingPine Script®指标由sanjayahir14提供59
9 AM 12-Bar Zoneplaces a 12 bar box around the 9 am hour. The idea is to see if there is a pattern of activity around suspected institutional moves that occur in the opening hour of the new york market Pine Script®指标由mikeryan50提供2
dr ram's banknifty fad%banknifty fad% calculation as per dr ram sir. based on 4 quadrant analysis . one of the criteria is calculating future asset difference for predicting market direction and entry plan.Pine Script®指标由paranjyothi提供8
Jag 1_BTC Spot vs Futures OverlayJagdish, this layout about BTC Spot and Futures codePine Script®指标由puneshare提供9