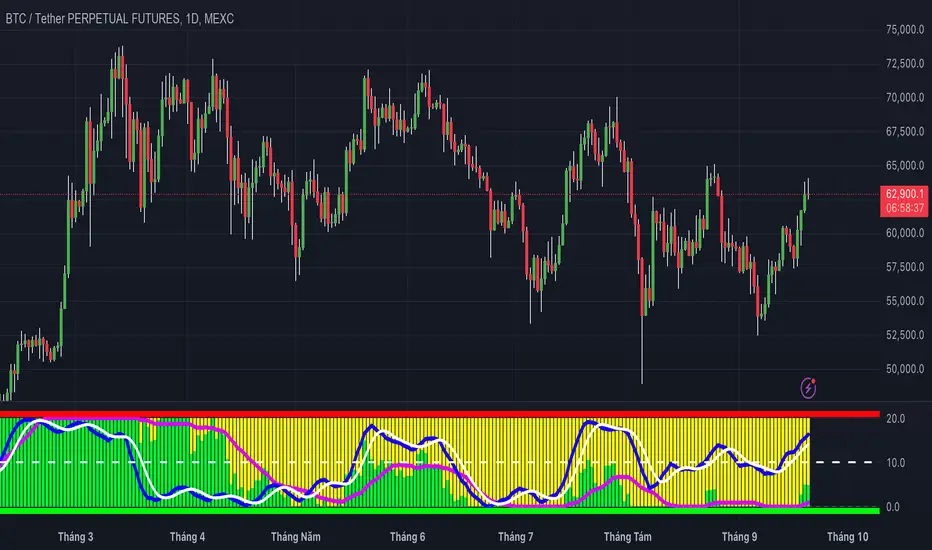
VWAP Guppy (32 Days Structure)Introduction to the Volume Weighted Super Guppy Indicator
The Volume Weighted Super Guppy is a technical analysis indicator that builds on the traditional Guppy Multiple Moving Average (GMMA) by incorporating volume weighting, similar to how the Volume Weighted Average Price (VWAP) accounts for trading volume in price calculations. Developed as an enhancement to Daryl Guppy's original GMMA, this variant aims to provide a more robust signal by factoring in volume, which helps differentiate between price movements driven by high conviction (high volume) and those that are less significant. The "Super" aspect often refers to an optimized or expanded version of the standard Guppy setup, and the "30 days" likely alludes to the long-term moving average group, which typically starts at a 30-period EMA and extends upward, making it suitable for medium- to long-term trend analysis over roughly a month's worth of data (assuming daily charts).
Core Components and How It Works
The standard GMMA consists of two groups of exponential moving averages (EMAs):
Short-term group (representing traders' sentiment): Typically VWAP of 1 to 32 days . These react quickly to price changes and capture short-term momentum.
Long-term group (representing investors' sentiment): Typically VWAP of 1 to 32 days. These provide a smoother view of the underlying trend, with the 30-period EMA serving as the entry point into longer-term analysis.
In the Volume Weighted Super Guppy, each VWAP is adjusted to be volume-weighted, meaning the average price is calculated not just on closing prices but on a volume-adjusted basis (akin to VWAP's formula: Cumulative (Price × Volume) / Cumulative Volume). This weighting emphasizes periods of high trading activity, reducing the impact of low-volume price spikes or dips that might distort traditional EMAs. If volume data is unavailable (e.g., in certain markets like forex), a fallback to simple price-based EMAs is often implemented.
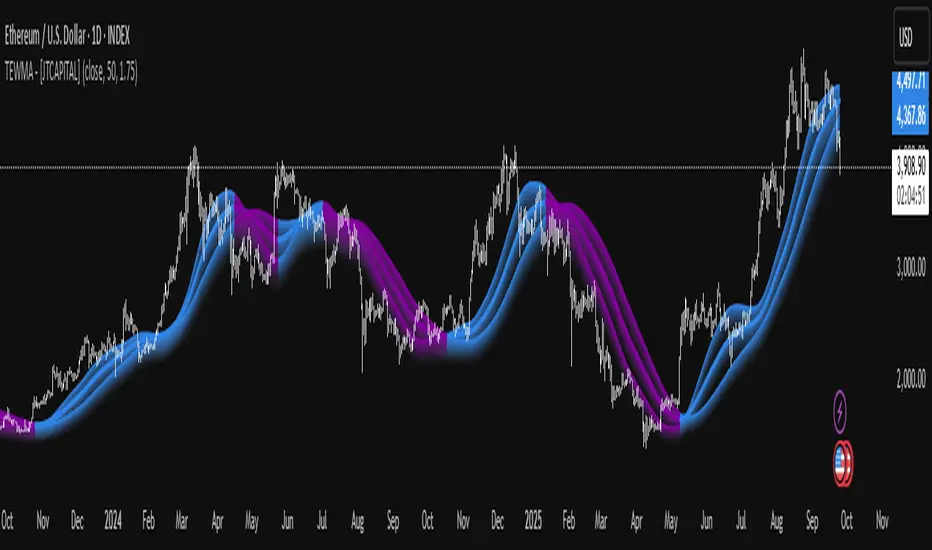
The indicator plots these multiple lines as "ribbons" on a price chart:
Short-term ribbons are usually colored differently (e.g., green for bullish, red for bearish) from long-term ones.
Convergence or divergence between the groups signals potential trend shifts, with volume weighting adding reliability by highlighting volume-backed moves.
How It Helps Track Trends
The Volume Weighted Super Guppy excels at identifying trend direction, strength, and potential reversals, making it a valuable tool for swing traders, trend followers, and investors monitoring 30-day or longer horizons. Here's how it aids in trend tracking:
Trend Direction Identification:
When the short-term EMA group is above the long-term group (starting from the 1 to 32 days VWAP), it indicates an uptrend. The volume weighting ensures this signal is stronger if supported by increasing volume, filtering out false breakouts.
Conversely, if the short-term group crosses below the long-term group, it signals a downtrend. This crossover is particularly useful over a 30-day rolling window, as it captures shifts from short-term volatility to sustained investor-driven moves.
Trend Strength Assessment:
Separation of Ribbons: Wide separation between the short- and long-term groups suggests a strong trend. For example, in a bullish scenario, expanding distance between the groups over 30 days indicates building momentum, often confirmed by higher volume in the weighted calculation.
Compression and Expansion: When the ribbons compress (lines bunch together), it signals consolidation or weakening trend strength, potentially foreshadowing a breakout. Volume weighting helps discern if the compression is due to low-interest trading (weaker signal) or building volume (stronger impending move).
Breakout and Reversal Anticipation:
The indicator anticipates breakouts when price and value (as captured by the volume-weighted EMAs) converge, especially around the 30-60 period long-term averages. A breakout above the long-term ribbon on rising volume can confirm a new uptrend.
For reversals, watch for the short-term group to "bounce" off the long-term group (e.g., acting as support in uptrends). Over 30 days, this can highlight trend exhaustion if volume diminishes.
Practical Application in a 30-Day Context:
On daily charts, the 1 to 32-days VWAP aligns with a monthly view, making it ideal for tracking intermediate trends. Traders can anchor the indicator to a specific date (similar to anchored VWAP) to analyze trends from key events, like earnings releases.
Combine with volume profiles or other indicators (e.g., RSI for overbought/oversold conditions) to validate signals. For instance, in a 30-day uptrend, if price pulls back to the long-term ribbon with low volume, it may present a buying opportunity.
Advantages and Limitations
Advantages: Volume integration makes it more responsive to market participation than standard GMMA, reducing false signals in volatile markets. It's versatile across assets like stocks, crypto, and forex, and particularly effective for trend-following strategies over 30+ days.
Limitations: It can lag in choppy, range-bound markets, and over-reliance on historical data (especially the 30-60 periods) may miss rapid intraday shifts. Always backtest on your specific timeframe and asset.
Pine Script®指标