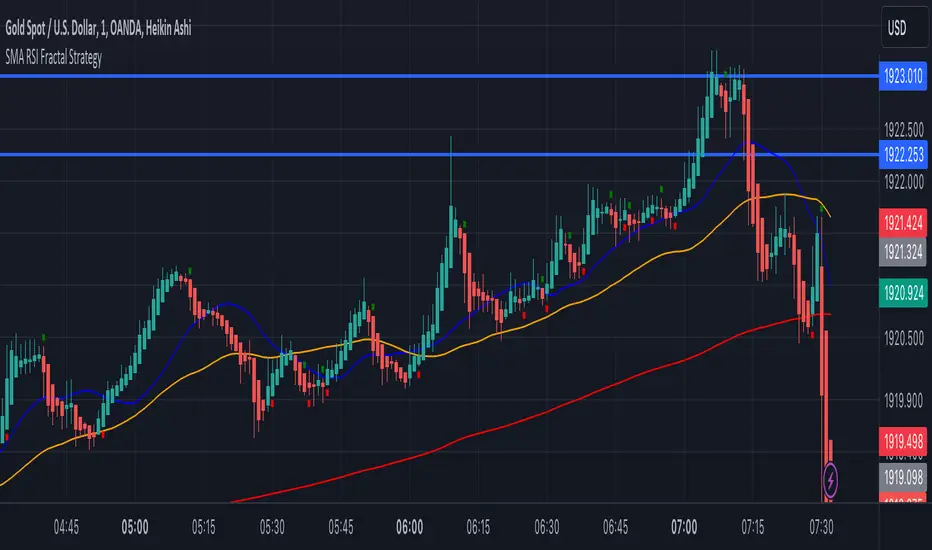
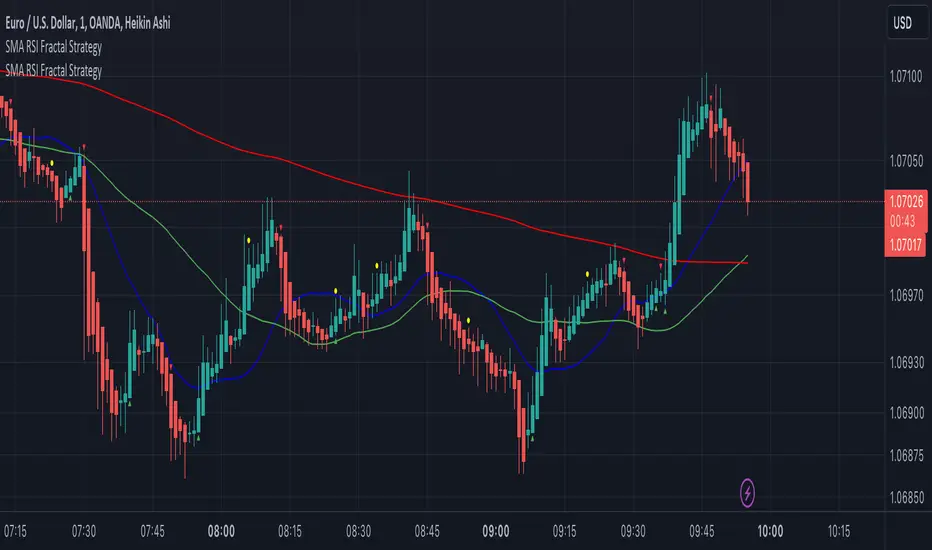
SMA RSI Fractal Strategy V4 Edit 1Made from RSI, SMA, and fractals. With the bands and signals for buy and sell entry. The colors are of opposite.
在脚本中搜索"Fractal"
Williams Fractals One// It is same as William fractal default one. I have just modified to provide the fractal UP or DOWN considering one handle on each side other than default two.
// It will help in ICT methods to find the Market structure.

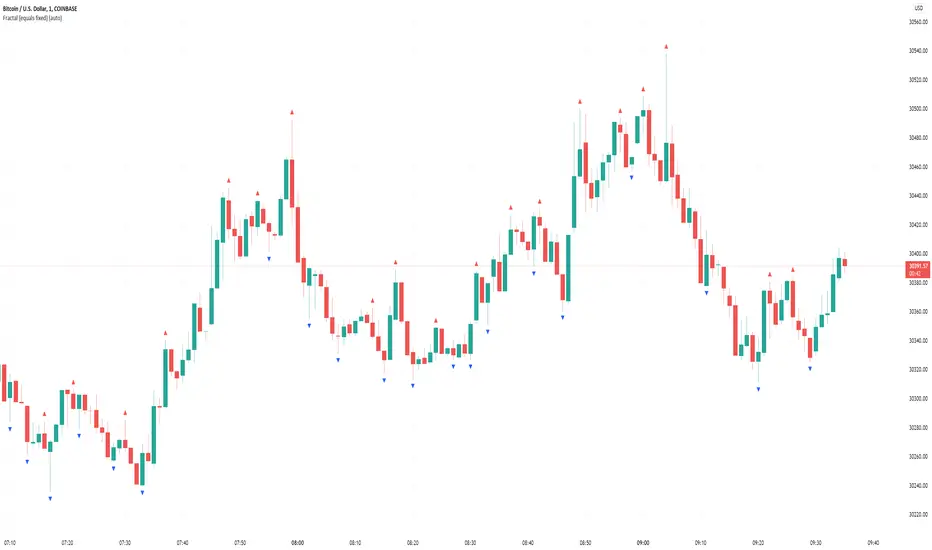
Williams Fractal (equals fixed)In contrast to the default Williams Fractal generator, this one also shows fractals if the two candles before or after are equal (>=, <=).
4 Power Fractal DC BandsFour Donchian Channel bands, based on the golden proportion (Phi, 1.618).
Allow, in a combined fashion, for a better understanding of price trend and structure.
Each band represents a relevant fractal size, and depending whether they are turned upwards or downwards, and aligned or not, it is possible to better orient one's expectations towards more likely price direction. Discreet levels or areas are also more likely points of reversal.
When bands are turned upwards, they get a darker green background when expanding, and a lighter one when contracting. Same goes with bands turned downwards, but with the red color.
Larger fractals / bands represent, naturally, more powerful forces.
Important 1: no explicit buy or sell signals are intended by the use of this reading. It is still necessary to consider other aspects, including risk managament, before entering or exiting a trade. Still, the reading facilitates picking a side with better odds of success.
Important 2: This version is intended for testing and feedback from within coder's network of contacts.
If you are interested in learning more about the theories behind this indicator, please DM .

4 Power Fractal BandsFour moving average bands, based on the golden proportion (Phi, 1.618) .
Allow, in a combined fashion, for a better understanding of price trend and structure .
Each band represents a relevant fractal size, and depending whether they are turned upwards or downwards, and aligned or not, it is possible to better orient one's expectations towards more likely price direction. Discreet levels or areas are also more likely points of reversal.
When bands are turned upwards, they get a darker green background when expanding, and a lighter one when contracting. Same goes with bands turned downwards, but with the red color.
Larger fractals / bands represent, naturally, more powerful forces.
Can be used also with other sources (e.g. OBV).
Important 1: no explicit buy or sell signals are intended by the use of this reading. It is still necessary to consider other aspects, including risk managament, before entering or exiting a trade. Still, the reading facilitates picking a side with better odds of success.
Important 2: This version is intended for testing and feedback from within coder's network of contacts.
If you are interested in learning more about the theories behind this indicator, please DM.

Musashi-Fractal-Trader
This is an indicator that draws Fractals. It will assist when looking for breakouts and understanding trend, thereby improving trading performance.
LEGAL STUFF:
Risk Disclosure
Futures , forex, stock, crypto and derivative trading contains substantial risk and is not for every investor. An investor could potentially lose all or more than the initial investment. Risk capital is money that can be lost without jeopardizing ones’ financial security or life style. Only risk capital should be used for trading and only those with sufficient risk capital should consider trading. Past performance is not necessarily indicative of future results
Hypothetical Performance Disclosure
Hypothetical performance results have many inherent limitations, some of which are described below. no representation is being made that any account will or is likely to achieve profits or losses similar to those shown; in fact, there are frequently sharp differences between hypothetical performance results and the actual results subsequently achieved by any particular trading program. One of the limitations of hypothetical performance results is that they are generally prepared with the benefit of hindsight. In addition, hypothetical trading does not involve financial risk, and no hypothetical trading record can completely account for the impact of financial risk of actual trading. for example, the ability to withstand losses or to adhere to a particular trading program in spite of trading losses are material points which can also adversely affect actual trading results. There are numerous other factors related to the markets in general or to the implementation of any specific trading program which cannot be fully accounted for in the preparation of hypothetical performance results and all which can adversely affect trading results

Brandon: Fractals MKIICustom Indicator development published for customer verification and acceptance.
Features
Generate buy / sell signals if x number of candles following a fractal are up/down.
Generate an early warning (background color change) if x - 1 candles following a fractal are up/down
Generate alerts for buy/sell signals and early warning.

BullTrading Chaos Trend WaveHave you ever wonder how the Elliott Wave looks like?
If you trade with price action you are going to love this stuff... It is based on the same Mandelbrot Chaos Theory principles in order to trade with Bill Williams fractals. Chaos Trend Wave indicator displays in your chart the different Elliott wave layers making price action trading very intuitive.
The standard settings are 126, 1, 5, 21 displaying the immediate bigger wave from your current layer, display settings for your current layer and "balance point" are: 126, 1, 3, 13. Use Fib sequence in the last two numbers in order to correctly change between wave layers: 126, 1, 8, 34 and 126, 1, 13, 55 (This is the higher setting, it is very useful to spot and trade trending markets).

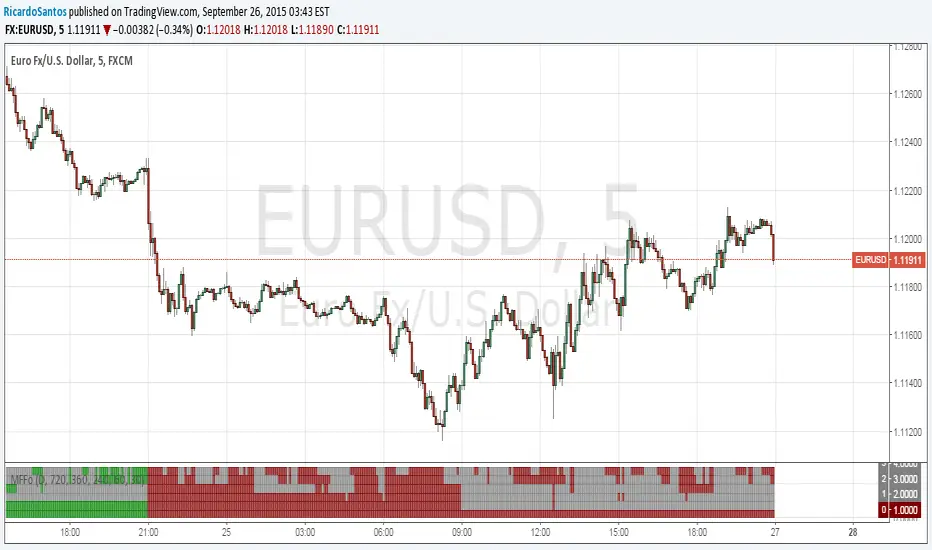
[RS]Market Fractility Flow Oscillator V0EXPERIMENTAL:
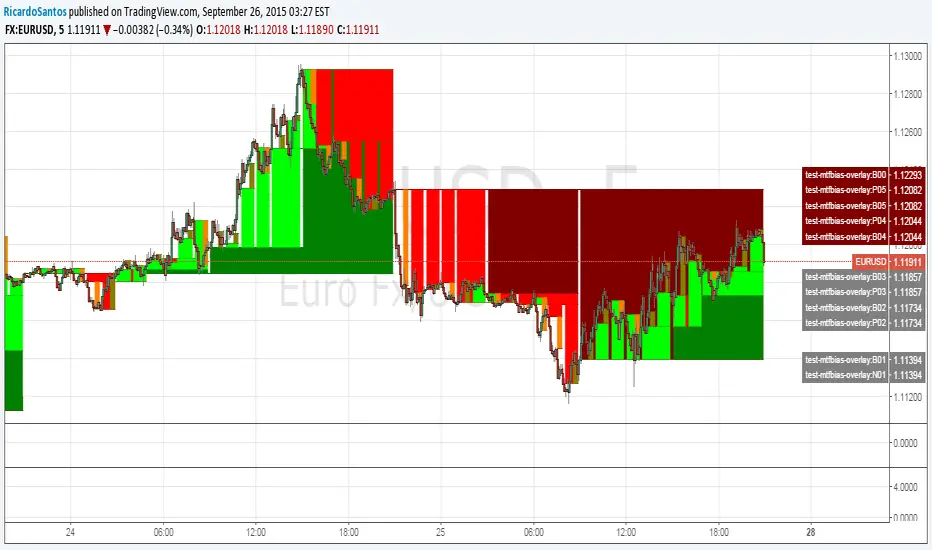
same as MTF-BIAS. but slightly more practical, reads market fractality flow into a oscillator.
[RS]Fractal Pattern Recognition V0EXPERIMENTAL: reads the rates for the last top/bottom in a zigzag fractal series, outputs XAB, XAD, ABC, and BCD rates, im interested in earing what your opinion is as im a total noob in harmonics :p.
use with Fractals V5 for visual confirmation ;).

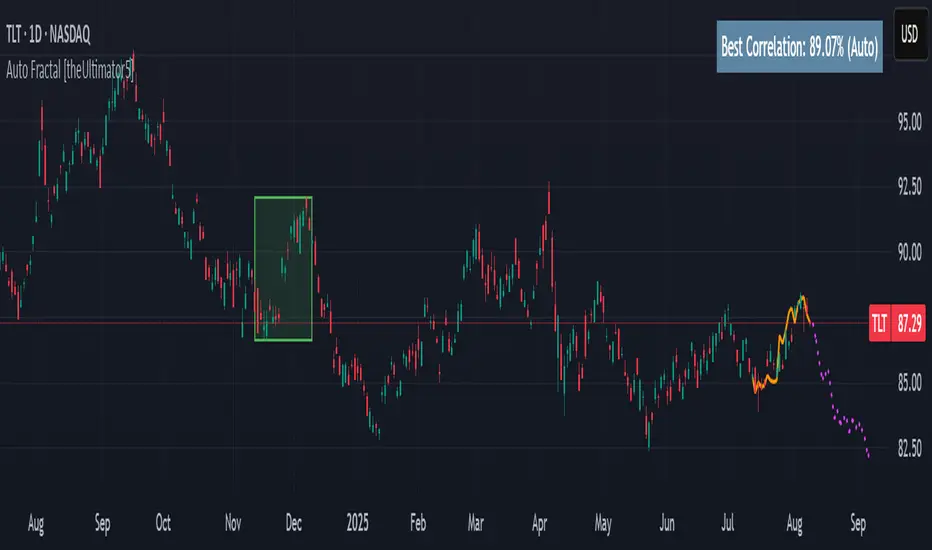
Auto Fractal [theUltimator5]This indicator is what I call the Auto Fractal. It is a unique algorithm that looks back in time, finds a segment on the chart that closest matches the recent price action, then projects the price forwards. It effectively finds chart patterns and shows you what the price did the last time the same/similar chart pattern was observed.
Creating an algorithm to match abstract curves to other abstract curves and provide a confidence score was the fundamental problem that needed to be solved in order to create this indicator, which curve matches with surprising accuracy.
The most effective method to "curve match" that I found is the Pearson Coefficient, set by a segment length and a lookback period. After the highest coefficient curve is located, the curve then gets scaled and offset to match the current price.
The past segment is drawn over the current price (orange line), giving a visualization of the two curves and how closely they match each other. The indicator then projects the price forwards in time based on the price action of the chart from the historical segment (dashed fuchsia line).
A bounding box also gets drawn around the historical segment to give you a clear visual of where the price is getting pulled from for proper analysis and ease of use.
The Pearson Coefficient % is shown in a table in the top right-hand corner of the chart and can be toggled off if desired. The values range from -100% (perfectly inverse correlation) to +100% (perfectly correlated) with 0 meaning no correlation whatsoever. The closer to +100% the value is, the better the segment match.
As with most/all of my indicators, user interface and simplicity was at the top of my priority list. I designed this to be easily readable and intuitive to both novice and veteran traders, without cluttering the chart.
Note:
This indicator is extremely heavy in terms of memory usage due to nested for loops, and takes several seconds to initially load the chart overlay. If the lookback period is increased too high (>600) then the indicator may time out and fail to load anything. If nothing loads on the chart, try reducing the lookback length and wait up to 10 seconds for lines to appear.
Advanced Multi-Level S/R ZonesAdvanced Multi-Level S/R Zones: The Comprehensive Guide
1. Introduction: The Evolution of Support & Resistance:
Support and Resistance (S/R) is the backbone of technical analysis. However, traditional methods of drawing these levels are often plagued by subjectivity. Two traders looking at the same chart will often draw two different lines. Furthermore, standard indicators often treat every price point equally, ignoring the critical context of Volume and Time.
The Advanced Multi-Level S/R Zones script represents a paradigm shift. It moves away from subjective line drawing and toward Quantitative Zoning. By utilizing statistical measures of variability (Standard Deviation, MAD, IQR) combined with Volume-Weighting and Time-Decay algorithms, this tool identifies where price is mathematically most likely to react. It treats S/R not as thin lines, but as dynamic zones of probability.
2. Core Logic and Mathematical Foundation:
To understand how to use this tool optimally, one must understand the "engine" under the hood. The script operates on four distinct pillars of logic:
A. Session-Based Data Collection:
The script does not look at every single tick. Instead, it aggregates data into "Sessions" (daily bars by default logic). It extracts the High, Low, and Total Volume for every session within the user-defined lookback period. This filters out intraday noise and focuses on the macro structure of the market.
B. Adaptive Statistical Variability:
Most Bollinger Band-style indicators use Standard Deviation (StdDev) to measure width. However, StdDev is heavily influenced by outliers (extreme wicks). This script offers a sophisticated Adaptive Method-Skewness Detection: The script calculates the skewness of the price distribution. Adaptive Selection: If the data is highly skewed (lots of outliers, typical in Crypto), it switches to MAD (Median Absolute Deviation). MAD is robust and ignores outliers. If the data is moderately skewed, it uses IQR (Interquartile Range). If the data is normal (Gaussian), it uses StdDev.
Benefit: This ensures the zone widths are accurate regardless of whether you are trading a stable Forex pair or a volatile Altcoin.
C. The Weighting Engine (Volume + Time)
Not all price history is equal. This script assigns a "Weight Score" to every session based on two factors:
Volume Weighting: Sessions with massive volume (institutional activity) are given higher importance. A high formed on low volume is less significant than a high formed on peak volume.
Time Decay: Recent price action is more relevant than price action from 50 bars ago. The script applies a decay factor (default 0.85). This means a session from yesterday has 100% impact, while a session from 10 days ago has significantly less influence on the zone calculation.
D. Clustering Algorithm
Once the data is weighted, the script runs a clustering algorithm. It looks for price levels where multiple session Highs (for Resistance) or Lows (for Support) congregate.
It requires a minimum number of points to form a zone (User Input: minPoints).
It merges nearby levels based on the Cluster Separation Factor.
This results in "Primary," "Secondary," and "Tertiary" zones based on the strength and quantity of data points in that cluster.
3. Detailed Features and Inputs Breakdown:
Group 1: Main Settings
Lookback Sessions (Default: 10): Defines how far back the script looks for pivots. A higher number (e.g., 50) creates long-term structural zones. A lower number (e.g., 5) creates short-term scalping zones.
Variability Method (Adaptive): As described above, leave this on "Adaptive" for the best results across different assets.
Zone Width Multiplier (Default: 0.75): Controls the vertical thickness of the zones. Increase this to 1.0 or 1.5 for highly volatile assets to ensure you catch the wicks.
Minimum Points per Zone: The strictness filter. If set to 3, a price level must be hit 3 times within the lookback to generate a zone. Higher numbers = fewer, but stronger zones.
Group 2: Weighting
Volume-Weighted Zones: Crucial for identifying "Smart Money" levels. Keep this TRUE.
Time Decay: Ensures the zones update dynamically. If price moves away from a level for a long time, the zone will fade in significance.
ATR-Normalized Zone Width: This is a dynamic volatility filter. If TRUE, the zone width expands and contracts based on the Average True Range. This is vital for maintaining accuracy during market breakouts or crashes.
Group 3: Zone Strength & Scoring
The script calculates a "Score" (0-100%) for every zone based on:
-Point Count: More hits = higher score.
-Touches: How many times price wicked into the zone recently.
-Intact Status: Has the zone been broken?
-Weight: Volume/Time weight of the constituent points.
-Track Zone Touches: Looks back n bars to see how often price respected this level.
-Touch Threshold: The sensitivity for counting a "touch."
Group 4: Visuals & Display
Extend Bars: How far to the right the boxes are drawn.
Show Labels: Displays the Score, Tier (Primary/Secondary), and Status (Retesting).
Detect Pivot Zones (Overlap): This is a killer feature. It detects where a Support Zone overlaps with a Resistance Zone.
Significance: These are "Flip Zones" (Old Resistance becomes New Support). They are colored differently (Orange by default) and represent high-probability entry areas.
Group 5: Signals & Alerts
Entry Signals: Plots Buy/Sell labels when price rejects a zone.
Detect Break & Retest: specifically looks for the "Break -> Pullback -> Bounce" pattern, labeled as "RETEST BUY/SELL".
Proximity Alert: Triggers when price gets within x% of a zone.
4. Understanding the Visuals (Interpreting the Chart)
When you load the script, you will see several visual elements. Here is how to read them:
The Boxes (Zones)
Red Shades: Resistance Zones.
Dark Red (Solid Border): Primary Resistance. The strongest wall.
Lighter Red (Dashed Border): Secondary/Tertiary. Weaker, but still relevant.
Green Shades: Support Zones.
Dark Green (Solid Border): Primary Support. The strongest floor.
Orange Boxes: Pivot Zones. These are areas where price has historically reacted as both support and resistance. These are the "Line in the Sand" for trend direction.
The Labels & Emojis
The script assigns emojis to zone strength:
🔥 (Fire): Score > 80%. A massive level. Expect a strong reaction.
⭐ (Star): Score > 60%. A solid structural level.
✓ (Check): Score > 40%. A standard level.
"⟳ RETESTING": Appears when a zone was broken, and price is currently pulling back to test it from the other side.
The Dashboard (Top Right)
A statistics table provides a "Head-Up Display" for the asset:
High/Low σ (Sigma): The variability of the highs and lows. If High σ is much larger than Low σ, it implies the tops are erratic (wicks) while bottoms are clean (flat).
Method: Shows which statistical method the Adaptive engine selected (e.g., "MAD (auto)").
ATR: Current volatility value used for normalization.
5. Strategies for Optimum Output
To get the most out of this script, you should not just blindly follow the lines. Use these specific strategies:
Strategy A: The "Zone Fade" (Range Trading)
This works best in sideways markets.
Identify a Primary Support (Green) and Primary Resistance (Red).
Wait for price to enter the zone.
Look for the "SUPPORT BOUNCE" or "RESISTANCE REJECTION" signal label.
Entry: Enter against the zone (Buy at support, Sell at resistance).
Stop Loss: Place just outside the zone width. Because the zones are calculated using volatility stats, a break of the zone usually means the trade is invalid.
Strategy B: The "Pivot Flip" (Trend Following)
This is the highest probability setup in trending markets.
Look for an Orange Pivot Zone.
Wait for price to break through a Resistance Zone cleanly.
Wait for the price to return to that zone (which may now turn Orange or act as Support).
Look for the "RETEST BUY" label.
Logic: Old resistance becoming new support is a classic sign of trend continuation. The script automates the detection of this exact geometric phenomenon.
Strategy C: The Volatility Squeeze
Look at the Dashboard. Compare High σ and Low σ.
If the values are dropping rapidly or becoming very small, the zones will contract (become narrow).
Narrow zones indicate a "Squeeze" or compression in price.
Prepare for a violent breakout. Do not fade (trade against) narrow zones; look to trade the breakout.
6. Optimization & Customization Guide
Different markets require different settings. Here is how to tune the script:
For Crypto & Volatile Stocks (Tesla, Nvidia)
Method: Set to Adaptive (Mandatory, as these assets have "Fat Tails").
Multiplier: Increase to 1.0 - 1.25. Crypto wicks are deep; you need wider zones to avoid getting stopped out prematurely.
Lookback: 20-30 sessions. Crypto has a long memory; short lookbacks generate too much noise.
For Forex (EURUSD, GBPJPY)
Method: You can force StdDev or IQR. Forex is more mean-reverting and Gaussian.
Multiplier: Decrease to 0.5 - 0.75. Forex levels are often very precise to the pip.
Volume Weighting: You may turn this OFF for Forex if your broker's volume data is unreliable (since Forex has no centralized volume), though tick volume often works fine.
For Scalping (1m - 15m Timeframes)
Lookback: Decrease to 5-10. You only care about the immediate session history.
Decay Factor: Decrease to 0.5. You want the script to forget about yesterday's price action very quickly.
Touch Lookback: Decrease to 20 bars.
For Swing Trading (4H - Daily Timeframes)
Lookback: Increase to 50.
Decay Factor: Increase to 0.95. Structural levels from weeks ago are still highly relevant.
Min Points: Increase to 3 or 4. Only show levels that have been tested multiple times.
7. Advantages Over Standard Tools:
Feature Standard S/R Indicator, Advanced Multi-Level S/R Calculation, Uses simple Pivots or Fractals, Uses Statistical Distributions (MAD/IQR). Zone Width Arbitrary or Fixed Adaptive based on Volatility & ATR.
Context Ignores Volume Volume Weighted (Smart Money tracking).
Time Relevance Old levels = New levels Time Decay (Recency bias applied).
Overlaps Usually ignores overlaps Detects Pivot Zones (Res/Sup Flip).
Scoring None 0-100% Strength Score per zone.
8. Conclusion:
The Advanced Multi-Level S/R Zones script is not just a drawing tool; it is a statistical analysis engine. By accounting for the skewness of data, the volume behind the moves, and the decay of time, it provides a strictly objective roadmap of the market structure.
For the optimum output, combine the Pivot Zone identification with the Retest Signals. This aligns you with the underlying flow of order blocks and prevents trading against the statistical probabilities of the market.

XXMonk Sequence Price Grid (Manual Origin + U)⭐ XXMonk Sequence Grid – Harmony Price Levels (1–144 Sequence Engine)
Algorithmic Sequence Mapping for Price Displacement
The XXMonk Sequence Grid is a precision mapping tool designed to project algorithmic price levels using harmonic numerical sequences derived from the ICT-inspired time/price symmetry concept.
This indicator takes a user-defined Origin (EQ level) and generates symmetrical expansion bands above and below price using any combination of the following sequence values:
These levels act as algorithmic rails that price frequently reacts to, respects, or expands toward — providing traders with a structural framework to interpret displacement, liquidity objectives, and sequence-based expansions.
🔷 Core Features
✔ Manual Origin (EQ Level)
Set any midpoint — daily open, session equilibrium, dealing range midpoint, your own anchor, etc.
✔ Manual U Value (Unit Size)
No restrictions. Enter any point value (ex: 0.25, 1, 5, 12.5, 25…) to scale the sequence to your instrument.
✔ Full Sequence Control
Toggle ON/OFF each individual harmonic sequence:
Micro ranges → 1, 3, 5
Intermediate → 8, 13, 21
Macro ranges → 34, 55, 89, 144
✔ Individual Line Colors
Every sequence level has its own color input for full customization.
✔ Static Lines (Do Not Move With Cursor)
Lines anchor from the first bar and extend infinitely to the right.
✔ Automatic Labels on Right Side
These levels often align with:
Liquidity pools
Displacement endpoints
PD array boundaries
Algorithmic expansion levels
Reversal zones
Session highs/lows
Volatility-based fractals
Price frequently travels sequence-to-sequence, creating a predictable harmonic structure.

DK FractalsThis is the beginning of the DK Fractal strategy build for futures.
Currently it doesn't have any of the automation as I'm just building the basic framework that the strategy will be built from.

Williams Fractals by Sheridan Sadewa modif untuk menggunakan fractal yang ukurannya lebih kecil dan deket

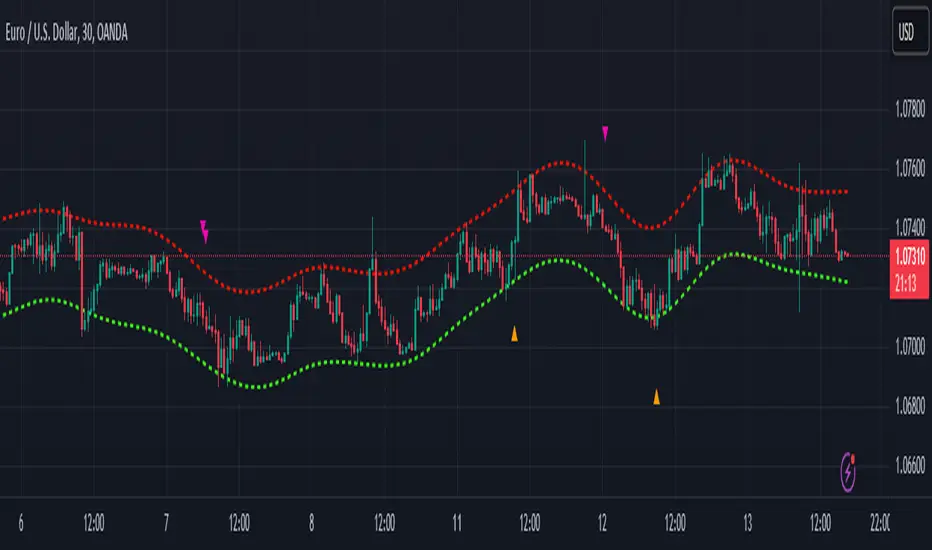
Nadaraya-Watson Envelope: Modified by YosietRange Filter indicator based on the LuxAlgo Nadaraya-Watson Envelope () indicator adding the SMA 30 high and SMA 7 low to predict the changes of the trends lines price.
WARNING: This indicator, as the same as the original, repaints the chart and could affect the exact values of the prices.
SMA Low 7 was identified using tensorflowJS years ago as accurate and abstract rsi indicator
SMA High 30 was identified using tensorflowJS years ago as accurate and strong trend line
This two SMAs were added to the original indicator Nadaraya-Watson to predict the exact points where the price will change direction or will re-test the trend to continue on.
The signals will act as the Williams Fractals, replacing the original signals of the indicator.
For those ICT/SMC traders, the bands and SMAs can toggle off in the settings of this indicator.
SETTINGS
Can set the source of the UPPER band indivuadilly
Can set the source of the LOWER band indivuadilly
Can toggle the visibility of the bands, this will not affect the calculations
Can toggle the visibility of SMAs
ALERTS AND SIGNALS
When the SMA LOW 7 cross under or over the bands, will trigger a signal orange
When the SMA 30 High cross over the upper band, will trigger a short signal purpple
HOW TO USE IT
If the both signals appears (sma 7 low and sma 30 high) crossing the upper band at the same point, this means that the price will drop strongly.
If the sma 7 low cross signal (orange triangle) appears under the price and lower band, means that the price will go up.
The separation of the signals from the chart will suggest the force of the movement. While more distance be, strongest reaction of the price.
DISCLAIMER : This indicator or script does not imply or constitute financial advice, investment advice, trading advice or any other type of advice or recommendation by and for TradingView. Use it at your own risk and your own decision.
SMA RSI Fractal Entry & Exit PointsUsing the 20, 50, 200 SMA, RSI, and Fractals to indicate when to exit buy/sells or move SL if your not trailing to protect profits
Williams Fractals + SMMAwilliams fractail + smoothed moving average. moving average. williams fractails with moving average , williams fractails + MA, smma

Rainbow FractalsThis Indicator uses the Bill Williams Fractals with coloring based on the Peak High/Low of the most recent RSI Value.
This helps quickly identify RSI bearish and bullish divergence without having a RSI lower indicator loaded onto the chart.
When the RSI is between 40 and 60 no fractals are posted. Lighter colored fractals are closer to a RSI value of 50 and darker fractals or further away from a RSI value of 50.


Williams Fractals - 3 or 5 Bar Wanted to give a user the option to choose between the original 5 bars in the Williams Fractal or 3 bars.

