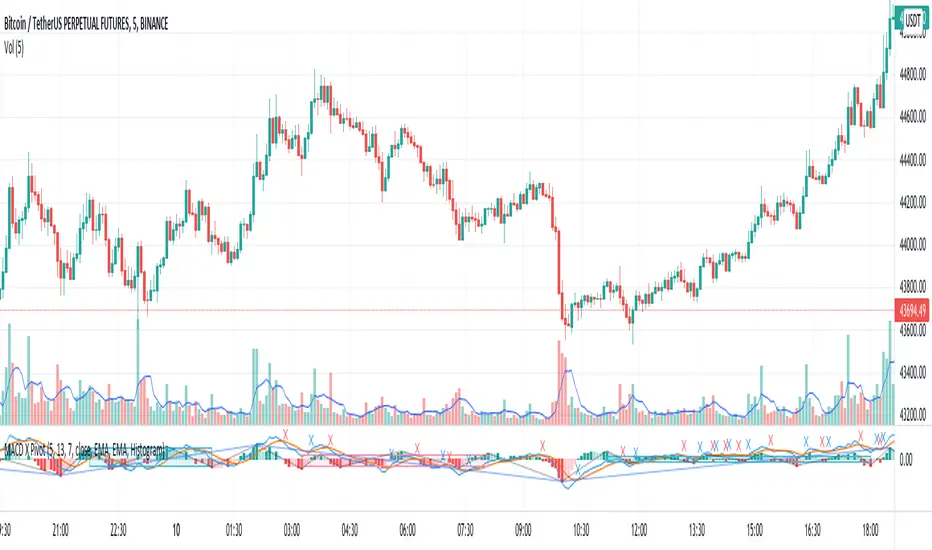
MACD X PivotThe Theory of Entanglement (缠论) is one of the most widely studied trading theories in China, but it is much less known among traders outside. Fractals, strokes, line segments and pivots are basic elements in the Theory of Entanglement. This indicator, MACD X Pivot, applies the concept of strokes, line segment and pivot to the classic MACD indicator and provides a good indication of the exact turning point of a trend based on MACD divergence. Also see a related indicator for applying the Theory of Entanglement on the price chart:
Relations between stroke, line segment and pivot:
• Stroke: Connecting two adjacent top and bottom fractals with at least one candlestick in between.
• Line segment: Consists of an odd number of strokes, at least three strokes are required, and the first three strokes must have overlapping parts.
• Pivot: The part of a trend type at a certain level that is overlapped by at least three consecutive sub-level trend types.
List of drawings on the chart:
1. Blue and red crosses: golden and death crosses between MACD and signal lines.
1. Gray lines: Strokes at the current level.
2. Blue lines: Strokes at a higher level, also line segments at the current level.
3. Blue shaded rectangles: Bullish pivot.
4. Red shaded rectangles: Bearish pivot.
How to use the indicator:
1. The golden cross and death cross between the MACD and signal lines: Blue cross: MACD line crosses up the signal line - buy signal; Red cross: MACD line crosses down the signal line: sell signal.
2. For the bullish blue pivot, the 2nd low (higher low) provides a good indication of the exact turning point from a bearish to bullish trend.
3. For the bearish red pivot, the 2nd high (lower high) provides a good indication of the exact turning point from a bullish to bearish trend.
在脚本中搜索"Fractal"
[blackcat] L5 Zen MasterLevel: 5
Background
L5 Zen Master is my favorite main chart indicator. I have been studying Zen Theory for long and keeping improving related home-baked private indicators. Zen Theory is less known out side of China. This situation is very similar to when Nilson did not introduce Japanese candlesticks worldwide. At that time, traders in other parts of the world rarely heard of Japanese candlesticks. This situation occurs again. When most Chinese bookstores and libraries are full of books on Zen Theory trading techniques, the rest of the world may not know this trading technique based on mathematical derivation axioms.
As for the author of the theory, he/she is as mysterious as Satoshi Nakamoto who created Bitcoin. People don't even know his/her gender, because he/she likes to call himself/herself a "woman" when he/she publishes original trading techniques on his/her blog. No one knows his/her name, only his/her nickname: "Preaching Zen in Tangles" (缠中说禅). People respectfully call him/her "Zen Master" (缠师). Zen Theory is based on geometric structures like Bill Williams' Fractals and ZigZag, but it is very host to MTF applications. In addition, there are unique insights on moving averages, this moving average technology is called Zen Kiss (缠论吻).
Function
It combine several novel indicators together but mainly focus on Zen Theory(缠论主图), including Zen Strokes (自动画笔) 和 Zen Kiss (缠论均线) Moving Averages. To Better understand the market geometry structure, I developped featured Fibonacci Space Indicator which is based on Semi-LOG and Fibonacci Time Window Indicator to help juge trend movements independently. Also, I integrated Better Volume Indicator(BVI) and Range Action Verification Index (RAVI) as well for volume and bias monitoring.
Indicator Set
Zen Stroke (Auto ZigZag, 自动画缠论笔)
Zen Kiss Moving Averages (缠论均线)
Fibonacci Space Indicator with Golden Ratios based on Semi-LOG (黄崇半对数)
Fibnacci Time Window Indicator with red/green background colors
Dynamic Fibnacci Space Arrows to indicate support and resistance immediately
Better Volume Indicator (BVI) with painted bars to juge trend strength
Range Action Verfication Index (RAVI) for large time frame for exetreme conditions warning
Inputs
BVI lookback period --> 5 as default
EnableBVIBarColors --> True as default
Show Zen Stroke --> True as default
Show Fib Space based on Semi-LOG --> True as default
Zen Fractals Lookback Period --> 377 as default
Key Signal
Zen Stroke
Yellow line section for up stroke
Blue line section for down stroke
Zen Kiss MA
Yellow MA for fast line (Cowgirl line)
Fuchsia MA for slow line (Cowboy line)
Fib Space w/ Golden Ratios
Low, 11.4%, 23.6%, 38.2%, 50%, 61.8%, 78.6%, 88.6%, High
Fib Time Window
Green background color for top indicator based on time window
Red background color for bottom indicator based on time window
Dynamic Fib Space Arrows
Green arrows for support
Red arrows for resistance
Better Volume Indicator
Yellow bar color --> low volume --> trend ends, commonly before trend reversals
Red bar color --> climax up volume --> very bullish and next bar may continue to be bullish
White bar color --> climax down volume --> very bearish and next bar may continue to be bearish
Green bar color --> churn volume --> Long and short forces play fierce games within a small price range
Fuchisia bar color --> climax churn volume --> Long and short forces play fierce games within a large price range
Range Action Verfication Index
Yellow background color for extremely negative bias, indicating bottom zone
Fuchsia background color for extremely positive bias, indiacting top zone
Pros and Cons
ONLY suitable for discretionary trading, and does NOT support automatic trading system/bots with alerts.
Intuitive and effective, the output signal is more reliable after multi-indicator resonance
Remarks
My second L5 indicator published
Closed-source
Invite-only
Redeem Fee Life Lock Guarantee
Although I take the efforts to inform the script requesters that the best way to promote trading skills is to learn from the open source scripts I released by themself and to improve their PNIE script programming skills, there are still many people asking how to obtain or pay to use BLACKCAT L4/L5 private scripts. In fact, I do not encourage people to use Tradingview Coins ( TVC ) / Cryptocurrency to redeem the right to use BLACKCAT L4/L5 scripts. However, redeeming private script usage rights through TV Coins/ Cryptocurrency may be an effective way to force more people to learn PINE script programming seriously. And then I can concentrate on answering more valuable community questions instead of being overwhelmed by L4/L5 scripting permission reqeusts.
I would like to announce a ‘Redeem Fee Lock Guarantee’ program to further simplify the L4/L5 indicator/strategy utility offering and distinguish itself from the competition. ‘Redeem Fee lock guarantee’ is one of the major initiatives by BLACKCAT as a part of overall value packaging designed to guard BLACKCAT’s followers’ against cost-overruns and operational risks usually borne by them when it comes to PINE script innovation ecosystem. The TVCs redeemed for L4/L5 a follower signs up for with BLACKCAT is their guaranteed lifetime locked in TVC Quantity/ cryptocurrency, with no special conditions, exclusions and fine print whatsoever. Based on this scheme, I can constantly refine, expand, upgrade and improve PINE script publishing to ensure the very best experiences for my followers. The 'Redeem Fee Lock Guarantee' is a step in the direction of rewarding the valuable followers. NOTE: Every L4/L5 script redeeming service is ONLY limited to TVC or Cryptocurrency ("Win$ & Donate w/ This" Addresses displayed on script page) redeeming which the 1st signed up TVC Qty/ equivalent cryptocurrency is the lifetime offered TVC Qty/ equivalent crypto.
How to subscrible this indicator?
The script subscription period only has two options of one month or one year, and its price is floating. The latest price of the script subscription is proportional to the number of likes/agrees this script has already received. Therefore, the price of subscribing to this script shows an increasing trend, and the earliest subscribers can enjoy the price of lifetime lock to this script. As the number of likes / agrees of this script increases, the subscription fee for one month and one year will also increase linearly. Whatever, the first subscription price of the use will be locked for life.
Monthly subscription and annual subscription can be done either by tradingview coins ( TVC ) or by converting into equivalent cryptocurrency at the exchange rate (1TVC=0.01USD) for redeem.
TVC payment needs to pay TVC directly in the comments under this script. Every time I authorize a new user, I will update the latest number of subscribed users and latest price for next subscription under the script comment. If there are any conflicting scenario happened to the rules and my update. My updated price based on the rule will be the final price for next subscription. The following subscribers need to pay the corresponding amount of TVC or cryptocurrency in accordance with the latest number of users and price announced by me in accordance with the rules published.
TVC redemption is the method I strongly recommend, and I hope you can complete the redemption in the comment area of this script. This is like a blockchain structure, each comment is a block, each subscription is a chain, which is conducive to open and transparent publicity and traceability to avoid unnecessary disputes.
Monthly Subscription Charges
500TVC <50 Agrees (A)
50A<850TVC<100A
100A<1000TVC<150A
150A<1350TVC<200A
200A<1500TVC<250A
250A<1850TVC<300A
300A<2000TVC<350A
350A<2350TVC<400A
400A<2500TVC<450A
450A<2850TVC<500A
500A<3000TVC<550A
550A<3350TVC<600A
600A<3500TVC<650A
650A<3850TVC<700A
700A<4000TVC<750A
750A<4350TVC<800A
800A<4500TVC<850A
850A<4850TVC<900A
900A<5000TVC<950A
950A<5350TVC<1000A
1000A<5500TVC<1050A
And so on...
Annual Subscription Charges
5000TVC <50 Agrees (A)
50A<8500TVC<100A
100A<10000TVC<150A
150A<13500TVC<200A
200A<15000TVC<250A
250A<18500TVC<300A
300A<20000TVC<300A
350A<23500TVC<400A
400A<25000TVC<450A
500A<28500TVC<550A
500A<30000TVC<550A
550A<33500TVC<600A
600A<35000TVC<650A
650A<38500TVC<700A
700A<40000TVC<750A
750A<43500TVC<800A
800A<45000TVC<850A
850A<48500TVC<900A
900A<50000TVC<950A
950A<53500TVC<1000A
1000A<55000TVC<1050A
And so on...

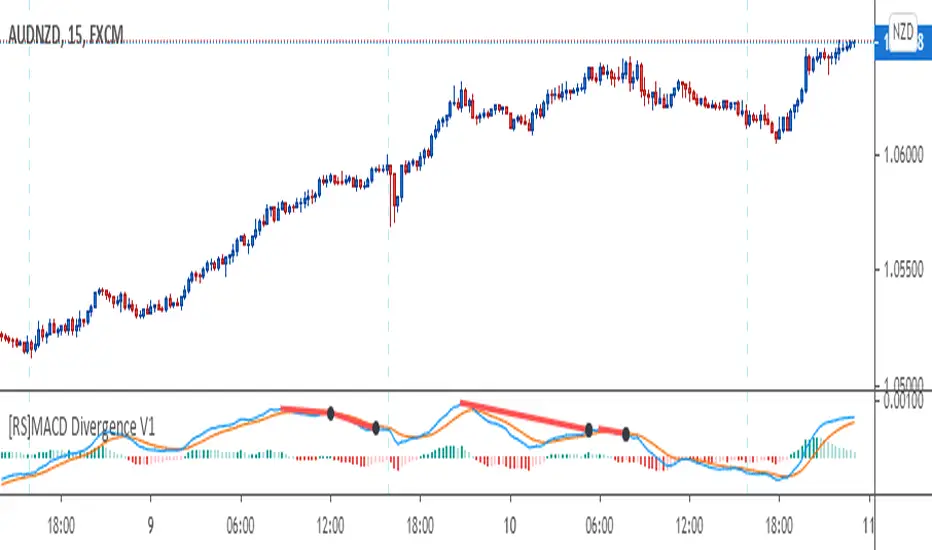
[RS]MACD Divergence V1This oscilator was created by Ricardo Santos using MACD's histogram as the series to find low and high fractals and from there find and plot divergences.
I just modified it a little bit to make it to look more like the MACD public library indicator and use the actual MACD series (instead of the histogram) to find the fractals and from there plot divergences.
I did this to make it easier for me and other fellow students of a Forex school where we use these type of divergences to find patterns.
Ichimoku ++ public v0.9Description:
The intention of this script is to build/provide a kind of work station / work bench for analysing markets and especially Bitcoin . Another goal is to get maximum market information while maintaining a good chart overview. A chart overloaded with indicators is useless because it obscures the view of the chart as the most important indicator. The chart should be clear and market structure should be easy to see. In addition, some indicator signals can be activated to better assess the quality of signals from the past. The chart environment or the chart context is important for the quality of a signal.
The intention of this script is not to teach someone how to trade or how to use these Indicators but to provide a tool to analyse markets better and to help to draw conclusions of market behaviour in a higher quality.
A general advise:
Use the included indicators and signals in a confluent way to get stoploss, buy and sell entry points. SR clusters can be identified for use in conjunction with fractals as entry and exit pints. My other scripts can also help. Prefer 4 hours, daily and a longer time frame. There is no "Holy Grail" :).
If someone is new to trading you should learn about the indicators first. Definitely learn about Ichimoku Cloud Indicator.
Integrated indicators are:
Ichimoku Cloud and signals
Parabolic SAR and signal
ATR stop
Bollinger Bands
EMA / SMA and background color as signal
Williams Fractals and signal
Puell Multiple signal

Trend-Following Combo-SuperTrend, EMA, Aroon, DMI, Laguerre RSIThis is a trend-following indicator which condenses two SuperTrend indicators -- one based on analysis over a shorter period of time (1.5, 7), and one based on analysis over a longer period of time (1.65, 100) -- into a single indicator which appears on your chart only when both the shorter- and longer-term analysis indicates a "SuperTrend" in the same direction.
Additionally, potential trade entry indicators are displayed in the form of up and down arrows when (by default) three of the following five indicators suggest that the market is trending in the same direction as both the shorter- and longer-term SuperTrend indicators:
EMA Crossover (8, 15)
Aroon Indicator (8)
Aroon Oscillator (8)
Directional Movement Index (DI +/-) (8)
Laguerre RSI (13)
You may update the parameters of any of the indicators to match your own preferences.
Additionally, you may also adjust the "Threshold" of indicators that must be in agreement with the SuperTrend to show a potential trade entry arrow. Bear in mind that if you set the Indicator Threshold too low, you will see more frequent trade entry arrows, many of which will not be profitable if taken. Similarly, set this value too high, and you will see fewer trade entry arrows that may not appear until after most of the "juice" in the trend has evaporated. Ideal values for the threshold seem to be between 2-4, depending on the symbol you are trading.
The following image shows all of the indicators referenced above on a 5-minute chart of the SPY during a single trading day:
And, here is the same period of time showing only the Trend-Following Combo indicator with default settings:
This indicator would not have been possible save for work contributed by the following:
SuperTrend by Rajandran R
Aroon w/ crossovers highlighted by seiglerj
Aroon Oscillator by jcrewolinsky
Directional Movement Index by TradingView
Laguerre RSI (Self Adjusting Alpha with Fractals Energy) by everget

Synthetic Levels indicator v.2.0“Synthetic Levels” Indicator 2.0
Class : graphic patterns
Trading type : reversal trading
Time frame : any
Purpose : detection of levels
Level of aggressiveness : standard
The “Synthetic Levels” indicator is designed to determine synthetic levels both support and resistance.
Synthetic levels are price zones where the most likely prices will change direction, but these zones are not obtained by determining chart patterns, they are the result of specific calculations.
Levels are determined based on a unique author's algorithm, which includes the most common techniques for determining levels: pivots, fractals, fibo levels, as well as extreme points approach.
By processing and comparing the values of support / resistance levels generated by different technics (see the list above), the “Synthetic Levels” indicator determines the actual price parameters of the support / resistance levels, as well as their power at a particular point in time.
The “Synthetic Levels” indicator displays three variants of support and resistance lines, which allows the trader to independently regulate the level of aggressiveness of the trading strategy, and can also can be used to build new trading strategies based on averaging and Martingale.
The information provided by the “Synthetic Levels” indicator can also be used to determine entry points (sell from resistance levels and buy from support levels), as well as to determine stop-losses and take-profits. Stops for buying are set below the support levels, and for sells - above the resistance levels. Profits for buys can be placed near the resistance lines, and for sells - in front of support lines.
The level power (displayed as a numerical value from 1 to 4 near each level line) allows to determine the trade volume of the position. The higher the power of the level is, the more aggressive the volume can be entered into the transaction. The power of a level is determined by the number of coincidences of the values of the levels calculated by different techniques. For example, if at some point the calculated values of the support level based on the “Pivots” technique turned out to be equal to the values obtained by the “Fractals” technique, the level power will be 2.
!!! IMPORTANT !!! Although the level looks like a line, that is a specific price, but in fact it is not so. The level line is rather a starting point for the formation of a price zone where prices will change the direction.
To detect trend activation points “Synthetic Levels” indicator 2.0 has double signal block: the first determines the medium-term market sentiment to the asset; the second is responsible for assessing the current market sentiment.
Structure of the indicator
Indicator consists of the following elements:
- Support lines incl. their power – 3 blue lines. Each of them displays variant of support line. The power of the level is displayed near the level line.
- Resistance lines incl. their power – 3 red lines. Each of them displays variant of resistance line. The power of the level is displayed near the level line.
- trend line – is designed for color indication of the current dominant tendency. If the color of the signal line is red, it means that the downward trend prevails, blue is for upward, and green is for flat. Accordingly, the trader should adjust his/her actions based on this information: search for sell opportunities and not buy if the line is red; search for purchases and not sell if the line is blue.
Parameters of the indicator
To configure the indicator, the following parameters are provided:
- Fibo period (default value - 34) - period for determining the Fibo lines. The higher the value is, the deeper the Indicator will dig in past prices.
- Period to calculate levels (default value - 13) - period for determining the levels used by Extreme points approach. The higher the value is, the deeper the Indicator will dig in past prices.
- Error in pips (default value - 10) – size of the price zone where levels are treated as the same ones.
- Trendline period (default value - 44) - period for determining the medium-term trend. The higher the value is, the more conservative the perception indicator of a trend will be.
- Trend period (default value - 13) - period to determine the current trend. Responsible for the level of trade aggressiveness. The lower the value of this parameter, the more signals the indicator will generate and vice versa.
- Trend error in pips (default value is 1) - this parameter is used to control the frequency of the signals. The lower it is, the more signals the indicator will generate.

Synthetic Levels indicator v.1.0“Synthetic Levels” Indicator
Class : graphic patterns
Trading type : reversal trading
Time frame : any
Purpose : detection of levels
Level of aggressiveness : standard
The “Synthetic Levels” indicator is designed to determine synthetic levels both support and resistance.
Synthetic levels are price zones where the most likely prices will change direction, but these zones are not obtained by determining chart patterns, they are the result of specific calculations.
Levels are determined based on a unique author's algorithm, which includes the most common techniques for determining levels: pivots, fractals, fibo levels, as well as extreme points approach.
By processing and comparing the values of support / resistance levels generated by different technics (see the list above), the “Synthetic Levels” indicator determines the actual price parameters of the support / resistance levels, as well as their power at a particular point in time.
The “Synthetic Levels” indicator displays three variants of support and resistance lines, which allows the trader to independently regulate the level of aggressiveness of the trading strategy, and can also can be used to build new trading strategies based on averaging and Martingale.
The information provided by the “Synthetic Levels” indicator can also be used to determine entry points (sell from resistance levels and buy from support levels), as well as to determine stop-losses and take-profits. Stops for buying are set below the support levels, and for sells - above the resistance levels. Profits for buys can be placed near the resistance lines, and for sells - in front of support lines.
The level power (displayed as a numerical value from 1 to 4 near each level line) allows to determine the trade volume of the position. The higher the power of the level is, the more aggressive the volume can be entered into the transaction. The power of a level is determined by the number of coincidences of the values of the levels calculated by different techniques. For example, if at some point the calculated values of the support level based on the “Pivots” technique turned out to be equal to the values obtained by the “Fractals” technique, the level power will be 2.
!!! WARNING!!! Although the level looks like a line, that is a specific price, but in fact it is not so. The level line is rather a starting point for the formation of a price zone where prices will change the direction.
Structure of the indicator
Indicator consists of the following elements:
- Support lines incl. their power – 3 blue lines. Each of them displays variant of support line. The power of the level is displayed near the level line.
- Resistance lines incl. their power – 3 red lines. Each of them displays variant of resistance line. The power of the level is displayed near the level line.
Parameters of the indicator
To configure the indicator, the following parameters are provided:
- Fibo period (default value - 34) - period for determining the Fibo lines. The higher the value is, the deeper the Indicator will dig in past prices.
- Period to calculate levels (default value - 13) - period for determining the levels used by Extreme points approach. The higher the value is, the deeper the Indicator will dig in past prices.
- Error in pips (default value - 10) – size of the price zone where levels are treated as the same ones.

Uncle Mo's Ultimate Ichimoku V1Main features:
2 x Ichimoku Cloud
5 x EMA
2 x MA
1 x HullMA
Williams Fractals
Study is based around trader @br0qn 's Ichimoku script.
Credits also go to:
@RicardoSantos for the Bill Williams Fractals
@EmilianoMesa for the EMAs/MAs
@mohamed982 for the HullMA
The script is open source so please feel free to change it around. I'd greatly appreciate it if you could suggest ways to improve it.
Happy trading!

BullTrading Chaos Trading System V3.0
BullTrading_CTS is not an indicator, it is complete trading system based on chaos theory. BullTrading_CTS provides the trader with all information required for high probability setups including:
·Recurrent Price Levels (zones the price of a security most likely will revisit in future).
·Mayor Fractals (BT_CTS confirms the more relevant fractals for a given timeframe helping the trader to identify Entry and Stop Loss levels accordingly to new incoming Chaos). Standard settings are configured for day trading using 1m charts (approximately 2-3 setups per day on each Forex Mayor Pair trading with a low spread ECN broker for an average gain of 5 pips per trade, although it can be used for swings and macro trades using the 5 minutes to H1 charts or any other timeframe).
In order to use successfully this trading tool training material is required and will be released shortly. Thanks for your patience.

[iQ]PRO Quantum MMXM Matrix Oscillator+++1. PRO Quantum MMXM Probability Matrix+++
2. Summary
This advanced market analysis engine combines fractal geometry with institutional liquidity models to decode complex market structure in real-time. Designed for precision traders, it utilizes a probabilistic state machine to forecast market regimes, distinguishing between accumulation, manipulation, and genuine trend expansion.
3. How It Works
The script operates on a "Theoretical Physics" approach to market data, treating price action as a dynamic system shifting between various energy states.
Probabilistic Regime Detection: Instead of relying solely on lagging price crosses, the core engine utilizes a Markov Chain model. This analyzes the probability of the market transitioning from one state (e.g., Consolidation) to another (e.g., Expansion) based on historical sequence learning.
Fractal Momentum weighting: The oscillator employs a "Quantum" momentum calculation. It weights price velocity against the market's "roughness" (using Hurst Exponent logic). This filters out low-quality volatility, ensuring that only statistically significant moves drive the signal.
Institutional Liquidity (MMXM) Curve: This component calculates the density of buying versus selling pressure relative to a dynamic equilibrium. It aims to identify "Manipulation" zones where price is artificially extended away from fair value to engineer liquidity.
Entropy & Confidence: The system measures the "disorder" of the current trend. Low entropy indicates a high-confidence, organized trend, while high entropy warns of chaotic, low-probability conditions.
4. Key Features
8-State Market Classification: Automatically detects phases including Consolidation, Manipulation, Expansion, and Distribution.
MMXM Liquidity Curve: Visualizes potential "Smart Money" reversal points and liquidity runs.
Multi-Timeframe Alignment: An on-chart dashboard displaying structural alignment across Daily, 4-Hour, and current timeframes.
Probability Density Field: Dynamic background coloring that intensifies based on the statistical confidence of the current directional bias.
Live Probability Heatmap: A real-time data table showing the percentage likelihood of the next market state.
5. How to Use
Step 1: Assess Directional Bias Check the "Probability Field" background color and the Quantum Metrics panel. A bright Green background indicates high-confidence bullish probability; Red indicates bearish.
Step 2: Confirm Structure (MTF) Consult the top-left Alignment Table. Ideal high-probability entries occur when the "HTF" (Higher Timeframe) and "MTF" (Medium Timeframe) states align in color/direction.
Step 3: Identify the Setup
Reversals: Look for the Oscillator or Price to hit the Deviation Targets (dotted lines). These represent statistically overextended zones (Fractal Deviation).
Trend Continuation: Wait for the "State" to switch from "Manipulation" to "Expansion" while the MMXM Curve crosses the equilibrium (zero) line.
Step 4: Risk Management Use the "Confidence" metric in the bottom panel. If Confidence drops below 50%, reduce position sizing or tighten stops, as the market is entering a chaotic state.
6. Settings & Configuration
Quantum Field Config: Customizes the specific timeframes used for the Multi-Timeframe alignment (HTF1, HTF2, MTF).
Fractal Parameters: Adjust the Hurst Exponent and Fractal Dimension to tune how the script filters noise versus trend.
MMXM Settings: Toggle the sensitivity of the liquidity curve and choose the equilibrium reference (VWAP, EMA, or Session Open).
Visualization: Individual toggles to show/hide the Oscillator, Probability Field, Heatmaps, and Deviation lines to keep your chart clean.
Access & Proprietary Terms
This is a Closed-Source, Invite-Only proprietary tool. The underlying algorithms are obfuscated to protect the integrity of the PRO methodology and its private user base.
Computational Optimization: Engineered for high-frequency data processing with minimal terminal lag.
Membership: Access is strictly reserved for private members.
Disclaimer: Trading involves significant risk. The PRO Matrix is an advanced analytical tool and does not guarantee profits. Past performance within the probability engine is not necessarily indicative of future results.

Iridescent Liquidity Prism [JOAT]Iridescent Liquidity Prism | Peer Momentum HUD
A multi-layered order-flow indicator that combines microstructure analysis, smart-money footprint detection, and intermarket momentum signals. The script uses dynamic color-shifting themes to visualize liquidity patterns, structure, and peer momentum data directly on the chart.
There is so much to choose from inside the settings, if you think it's a mess on the chart it's because you have to personally customize it based on your needs...
Core Functionality
The indicator calculates and displays several analytical layers simultaneously:
Order-Flow Imbalance (OFI): Calculates buy vs. sell volume pressure using volume-weighted price distribution within each bar. Uses an EMA filter (default: 55 periods) to smooth the signal. Values are normalized using standard deviation to identify significant imbalances.
Smart Money Footprints: Detects accumulation and distribution zones by comparing volume rate of change (ROC) against price ROC. When volume ROC exceeds a threshold (default: 65%) and price ROC is positive, accumulation is detected. When volume ROC is high but price ROC is negative, distribution is detected.
Fractal Structure Mapping: Identifies pivot highs and lows using a fractal detection algorithm (default: 5-bar period). Maintains a rolling window of recent structure points (default: 4 levels) and draws connecting lines to show trend structure.
Fair Value Gap (FVG) Detection: Automatically detects price gaps where three consecutive candles create an imbalance. Bullish FVGs occur when the current low exceeds the high two bars ago. Bearish FVGs occur when the current high is below the low two bars ago. Gaps persist for a configurable duration (default: 320 bars) and fade when price fills the gap.
Liquidity Void Detection: Identifies candles where the high-low range exceeds an ATR threshold (default: 1.7x ATR) while volume is below average (default: 65% of 20-bar average). These conditions suggest areas where liquidity may be thin.
Price/Volume Divergence: Uses linear regression to detect when price trend direction disagrees with volume trend direction. A divergence alert appears when price is trending up while volume is trending down, or vice versa.
Peer Momentum Heatmap (PMH): Calculates composite momentum scores for up to 6 symbols across 4 timeframes. Each score combines RSI (default: 14 periods) and StochRSI (default: 14 periods, 3-bar smooth) to create a momentum composite between -1 and +1. The highest absolute momentum score across all combinations is displayed in the HUD.
Custom settings using Fractal Pivots, Skeleton Structure, Pulse Liquidity Voids, Bottom Colorful HeatMaps, and Iridescent Field.
---
Visual Components
Spectrum Aura Glow: ATR-weighted bands (default: 0.25x ATR) that expand and contract around price action, indicating volatility conditions. The thickness adapts to market volatility.
Chromatic Flow Trail: A blended line combining EMA and WMA of price (default: 8-period EMA blended with WMA at 65% ratio). The trail uses gradient colors that shift based on a phase oscillator, creating an iridescent effect.
Volume Heat Projection: Creates horizontal volume profile bands at price levels (default: 14 levels). Scans recent bars (default: 150 bars) to calculate volume concentration. Each level is colored based on its volume density relative to the maximum volume level.
Structure Skeleton: Dashed lines connecting fractal pivot points. Uses two layers: a primary line (2-3px width) and an optional glow overlay (4-5px width) for enhanced visibility.
Fractal Markers: Diamond shapes placed at pivot high and low points. Color-coded: primary color for highs, secondary color for lows.
Iridescent Color Themes: Five color themes available: Iridescent (default), Pearlescent, Prismatic, ColorShift, and Metallic. Colors shift dynamically using a phase oscillator that cycles through the color spectrum based on bar index and a speed multiplier (default: 0.35).
---
HUD Console Metrics
The right-side HUD displays seven key metrics:
Flow: Shows OFI status: ▲ FLOW BUY when normalized OFI exceeds imbalance threshold (default: 2.2), ▼ FLOW SELL when below -2.2, or ◆ FLOW BAL when balanced.
Struct: Structure trend bias: ▲ STRUCT BULL when microtrend > 2, ▼ STRUCT BEAR when < -2, or ◆ STRUCT RANGE when neutral.
Smart$: Institutional activity: ◈ ACCUM when smart money index = 1, ◈ DISTRIB when = -1, or ○ IDLE when inactive.
Liquid: Liquidity state: ⚡ VOID when a liquidity void is detected, or ● NORMAL otherwise.
Diverg: Divergence status: ⚠ ALERT when price/volume divergence detected, or ✓ CLEAR when aligned.
PMH: Peer Momentum Heatmap status: Shows dominant timeframe and momentum score. Displays 🪩 for bull surge (above 0.55 threshold) or 🧨 for bear surge (below -0.55).
FVG: Fair Value Gap status: Shows active gap count or CLEAR when no gaps exist. Displays GAP LONG when bullish gap detected, GAP SHORT when bearish gap detected.
Pearlscent Color with Volume Heatmap.
Parameters and Settings
Microstructure Engine:
Analysis Depth: 20-250 bars (default: 55) - Controls OFI smoothing period
Liquidity Threshold ATR: 1.0-4.0 (default: 1.7) - Multiplier for void detection
Imbalance Ratio: 1.5-6.0 (default: 2.2) - Standard deviations for OFI significance
Smart Money Layer:
Smart Money Window: 10-150 bars (default: 24) - Period for ROC calculations
Accumulation Threshold: 40-95% (default: 65%) - Volume ROC threshold
Structural Mapping:
Fractal Pivot Period: 3-15 bars (default: 5) - Period for pivot detection
Structure Memory: 2-8 levels (default: 4) - Number of structure points to track
Volume Heat Projection:
Heat Map Lookback: 60-400 bars (default: 150) - Bars to analyze for volume profile
Heat Map Levels: 5-30 levels (default: 14) - Number of price level bands
Heat Map Opacity: 40-100% (default: 92%) - Transparency of heat map boxes
Heat Map Width Limit: 6-80 bars (default: 26) - Maximum width of heat map boxes
Heat Map Visibility Threshold: 0.0-0.5 (default: 0.08) - Minimum density to display
Iridescent Enhancements:
Visual Theme: Iridescent, Pearlescent, Prismatic, ColorShift, or Metallic
Color Shift Speed: 0.05-1.00 (default: 0.35) - Speed of color phase oscillation
Aura Thickness (ATR): 0.05-1.0 (default: 0.25) - Multiplier for aura band width
Chromatic Trail Length: 2-50 bars (default: 8) - Period for trail calculation
Trail Blend Ratio: 0.1-0.95 (default: 0.65) - EMA/WMA blend percentage
FVG Persistence: 50-600 bars (default: 320) - Bars to keep FVG boxes active
Max Active FVG Boxes: 10-200 (default: 40) - Maximum boxes on chart
FVG Base Opacity: 20-95% (default: 80%) - Transparency of FVG boxes
Peer Momentum Heatmap:
Peer Symbols: Comma-separated list of up to 6 symbols (e.g., "BTCUSD,ETHUSD")
Peer Timeframes: Comma-separated list of up to 4 timeframes (default: "60,240,D")
PMH RSI Length: 5-50 periods (default: 14)
PMH StochRSI Length: 5-50 periods (default: 14)
PMH StochRSI Smooth: 1-10 periods (default: 3)
Super Momentum Threshold: 0.2-0.95 (default: 0.55) - Threshold for surge detection
Clarity & Readability:
Liquidity Void Opacity: 5-90% (default: 30%)
Smart Money Footprint Opacity: 5-90% (default: 35%)
HUD Background Opacity: 40-95% (default: 70%)
Iridescent Field:
Field Opacity: 20-100% (default: 86%) - Background color intensity
Field Smooth Length: 10-200 bars (default: 34) - Smoothing for background gradient
---
Alerts
The indicator provides seven alert conditions:
Liquidity Void Detected - Triggers when void conditions are met
Strong Order Flow - Triggers when normalized OFI exceeds imbalance ratio
Smart Money Activity - Triggers when accumulation or distribution detected
Price/Volume Divergence - Triggers when divergence conditions occur
Structure Shift - Triggers when structure polarity changes significantly
PMH Bull Surge - Triggers when PMH exceeds positive threshold (if enabled)
PMH Bear Surge - Triggers when PMH exceeds negative threshold (if enabled)
Bull/Bear Prismatic FVG - Triggers when new FVG is detected (if FVG display enabled)
---
Usage Considerations
Performance may vary on lower timeframes due to the volume heat map calculations scanning multiple bars. Consider reducing heat map lookback or levels if experiencing slowdowns.
The PMH feature requires data requests to other symbols/timeframes, which may impact performance. Limit the number of peer symbols and timeframes for optimal performance.
FVG boxes automatically expire after the persistence period to prevent chart clutter. The maximum box limit (default: 40) prevents excessive memory usage.
Color themes affect all visual elements. Choose a theme that provides good contrast with your chart background.
The indicator is designed for overlay display. All visual elements are positioned relative to price action.
Structure lines are drawn dynamically as new pivots form. On fast-moving markets, structure may update frequently.
Volume calculations assume typical volume data availability. Symbols without volume may show incomplete data for volume-dependent features.
---
Technical Notes
Built on Pine Script v6 with dynamic request capability for PMH functionality.
Uses exponential moving averages (EMA) and weighted moving averages (WMA) for trail calculations to balance responsiveness and smoothness.
Volume profile calculation uses price level buckets. Higher levels provide finer granularity but require more computation.
Iridescent color engine uses a phase oscillator with sine wave calculations for smooth color transitions.
Box management includes automatic cleanup of expired boxes to maintain performance.
All visual elements use color gradients and transparency for smooth blending with price action.
---
Customization Examples
Intraday Scalping Setup:
Analysis Depth: 30 bars
Heat Map Lookback: 100 bars
FVG Persistence: 150 bars
PMH Window: 15 bars
Fast color shift speed: 0.5+
Macro Structure Tracking:
Analysis Depth: 100+ bars
Heat Map Lookback: 300+ bars
FVG Persistence: 500+ bars
Structure Memory: 6-8 levels
Slower color shift speed: 0.2
---
Limitations
Volume heat map calculations may be computationally intensive on lower timeframes with high lookback values.
PMH requires valid symbol names and accessible timeframes. Invalid symbols or timeframes will return no data.
FVG detection requires at least 3 bars of history. Early bars may not show FVG boxes.
Structure lines connect points but do not predict future structure. They reflect historical pivot relationships.
Color themes are aesthetic choices and do not affect calculation logic.
The indicator does not provide trading signals. All visual elements are analytical tools that require interpretation in context of market conditions.
Open Source
This indicator is open source and available for modification and distribution. The code is published with Pine Script v6 compliance. Users are free to customize parameters, modify calculations, and adapt the visual elements to their trading needs.
For questions, suggestions, or anything please talk to me in private messages or comments below!
Would love to help!
- officialjackofalltrades

LETHINH-Swing pa,smc🟦 📌 Title (English)
Swing High / Swing Low – 3-Candle Fractal (5-Bar Pivot) | Auto Alerts
⸻
🟩 📌 Short Description
A clean and reliable swing high / swing low detector based on the classic 3-candle (5-bar) fractal pivot. Automatically marks SH/SL and triggers alerts when a swing is confirmed. No repainting after confirmation.
⸻
🟧 📌 Full Description (for TradingView Publishing)
🔶 Swing High / Swing Low – 3-Candle Fractal (5-Bar Pivot)
This indicator identifies Swing Highs (SH) and Swing Lows (SL) using the classic 3-candle fractal pattern, also known as the 5-bar pivot.
It marks swing points only after full confirmation, making it highly reliable and suitable for structure-based trading.
⸻
🔶 📍 How It Works
A swing is confirmed when the center candle is higher (or lower) than the two candles on each side:
Swing High (SH)
high > high , high , high
Swing Low (SL)
low < low , low , low
The confirmation occurs after 2 right candles close, so the indicator does not repaint once a swing is identified.
⸻
🔶 📍 Key Features
• Detects clean and accurate swings
• Uses pure price action — no indicators, no lag
• Marks swing high (SH) and swing low (SL) directly on the chart
• Non-repainting after confirmation
• Works on all timeframes and all markets
• Extremely lightweight and fast
• Includes alert conditions for both SH and SL
Perfect for traders using:
• Market Structure (BOS / CHoCH)
• Order Blocks (OB)
• Smart Money Concepts (SMC)
• Liquidity hunts
• Wyckoff
• Support/Resistance
• Price Action entries
⸻
🔶 📍 Why This Indicator Is Useful
Swing points are the foundation of market structure.
Accurately detecting them helps traders:
• Identify trend shifts
• Spot BOS / CHoCH correctly
• Find key zones (OB, liquidity levels, supply/demand)
• Time entries more precisely
• Avoid fake structure breaks
This indicator ensures swings are plotted only when fully confirmed, reducing noise and confusion.
⸻
🔶 📍 Alerts
You can create alerts for both conditions:
• Swing High Confirmed
• Swing Low Confirmed
Recommended settings:
• Once per bar close
• Open-ended alert
With alerts enabled, TradingView will automatically notify you every time a new swing forms.
⸻
🔶 📍 No Repainting
Once a swing is confirmed and plotted, it will not change or disappear.
This makes the indicator reliable for real-time alerts and backtesting.
⸻
🔶 📍 Pine Script (v5)
Paste your indicator code here if you want it visible.
Or leave the code hidden if you are publishing as protected.
⸻
🔶 📍 Final Notes
• This indicator focuses on confirmation, not prediction
• It is designed for clean structure reading
• All markets supported: Forex, Crypto, Stocks, Indexes, Commodities
• Suitable for scalping, intraday, swing, and even higher-timeframe trading
If you find this tool helpful, feel free to give it a like and add it to your favorites ❤️
Your support helps me share more tools with the community!

Information-Geometric Market Dynamics + MLInformation-Geometric Market Dynamics + ML (IGMD-ML)
Foreword: Beyond the Shadows on the Wall
If you have traded for any length of time, you understand the frustration of a perfect setup that fails, the whipsaw that stops you out just before a major move, or the persistent feeling that the price chart is only telling you half the story. For decades, technical analysis has focused on interpreting the shadows—the patterns left behind by price. We draw lines, apply indicators, and hope to derive future movement from this historical data.
But what if we could stop analyzing the shadows and instead measure the object casting them?
This script, Information-Geometric Market Dynamics (IGMD), introduces a new paradigm for market analysis. Its core premise is that the price chart is merely a one-dimensional projection of a much richer, higher-dimensional reality—an "information field" generated by the collective actions, beliefs, and emotions of all market participants.
This is not just another collection of indicators. It is a unified framework for measuring the geometry of this information field—its memory, its complexity, its uncertainty, its causal flows—and making high-probability decisions based on that deeper reality.
The IGMD Framework: A Multi-Kernel Approach
At the heart of IGMD are mathematical "kernels"—specialized engines that transform raw price data into meaningful measurements of abstract market properties. The framework's power lies in its ability to fuse the outputs of five distinct kernels, synthesizing their diverse perspectives into a single, coherent picture of the market's state.
The Five Core Kernels of Market Dynamics:
1. The Wavelet Kernel (The "Microscope"): Decomposes price into different frequency scales, separating short-term noise from the underlying market "thesis."
2. The Hurst Exponent Kernel (The "Memory Gauge"): Measures the market's "long-term memory" to determine if it is in a trending, mean-reverting, or random state.
3. The Fractal Dimension Kernel (The "Complexity Compass"): Quantifies the geometric complexity of the price path, acting as a primary filter for tradable vs. untradable conditions.
4. The Shannon Entropy Kernel (The "Uncertainty Meter"): Provides a pure measure of information and uncertainty, gauging market conviction and predictability.
5. The Transfer Entropy Kernel (The "Causality Probe"): Moves beyond correlation to measure the directed flow of information, assessing if a driver (like volume) is genuinely leading price.
Major Update: The Intelligence Layer & Machine Learning Integration
This version of IGMD introduces a significant advancement: an integrated machine learning (ML) engine that acts as an intelligent decision-making layer on top of the core five-kernel analysis. This is not a "black box" system but a transparent, adaptive filter designed to improve signal quality by learning from the market in real time.
How the ML Engine Works
The ML model processes the outputs from all five IGMD kernels and other market variables (like RSI and Volume) to build a comprehensive, multi-dimensional understanding of the current market state.
Core Technology: The engine uses an online logistic regression model. "Online" means it learns and updates its parameters with every new bar of data, allowing it to adapt continuously to changing market dynamics without needing to be retrained.
Non-Linear Pattern Recognition: To capture the market's complex behavior, the model projects the kernel data into a higher-dimensional space using Random Fourier Features (RFF) . This technique allows a linear model to recognize highly intricate patterns that would otherwise be invisible.
Probabilistic Filtering: The ML engine’s primary function is to act as a final confirmation filter. For every signal generated by the core IGMD system, the ML model calculates a probability score—its confidence that the price will move in the predicted direction. Signals are only displayed if they pass this confidence check.
Key Features of the ML Engine
Automated Regime Filter: The ML engine uses the Fractal Dimension and Shannon Entropy kernels to identify choppy, unpredictable markets. During these periods, the system automatically pauses new signal generation to help preserve capital.
Adaptive Confidence Threshold: To optimize performance, the ML engine features an optional self-adjusting confidence threshold. This system tracks its own rolling accuracy and adjusts its selectivity accordingly, becoming more cautious in uncertain periods and more opportunistic when its accuracy is high.
Feature Importance Monitoring: The dashboard displays which of the core IGMD features (e.g., Wave, Hurst, Entropy) the ML model is currently relying on most. This provides valuable insight into the market's character and what is driving the model's decisions.
Advanced Adaptation: The Reinforcement Learning Bandit (Experimental)
For advanced users, this version includes an experimental feature based on a Multi-Armed Bandit , a concept from reinforcement learning. When enabled, this system can automatically switch between different parameter presets (e.g., Conservative, Balanced, Aggressive) based on the current market regime. It learns over time which preset performs best under specific conditions by balancing the exploitation of known successful strategies with the exploration of others.
Fusion & Interpretation: The Field Score & Enhanced Dashboard
The Field Score: The outputs of the five kernels are fused into a single, comprehensive "Field Score" ranging from -1 (maximum bearish alignment) to +1 (maximum bullish alignment). This remains the ultimate at-a-glance metric for the market's net state.
The Enhanced Dashboard: Your mission control has been upgraded to include the ML engine's analysis. Alongside the core kernel readouts, you can now monitor:
ML Status: See if the model is active, warming up, or disabled.
ML Probability: View the model's real-time confidence for a bullish move.
Regime Status: Instantly know if the market is "Trending," "Normal," or "Choppy (Paused)."
Top Feature: Identify the most influential IGMD kernel according to the ML model.
Signal Status: See the final, ML-vetted signal.
Mastering the Controls: A Guide to the Inputs
The inputs menu gives you full control over the IGMD and ML engines.
🤖 Machine Learning Engine:
Enable ML Probability Model: The master switch for the entire ML layer.
Prediction Horizon: Set how many bars ahead you want the ML model to predict. This should align with your trading style.
ML Confidence Threshold: The minimum probability required for the ML model to approve a signal. This is your primary tool for adjusting signal quality versus frequency.
Pause in Choppy Regimes: Enable or disable the automated filter that stops trading in unfavorable conditions.
Auto-Adjust Threshold: Allow the system to self-optimize its confidence threshold based on recent accuracy.
🎰 Adaptive Parameter Bandit:
Enable Parameter Bandit: Activate the experimental reinforcement learning agent to manage strategy presets automatically.
Reading the Battlefield: On-Chart Visuals
In addition to the established pattern boxes, RR rails, and signal markers, a new visual element has been added:
ML Rejection Markers (✗): An orange '✗' will appear on the chart when the core IGMD system identifies a potential setup, but the ML model's confidence is below your defined threshold. This provides crucial feedback, showing you which signals were intelligently filtered out by the intelligence layer for having a lower probability of success.
A Methodological Distinction: What Sets IGMD Apart **
What sets this framework apart is its foundational approach. Instead of relying on traditional technical indicators, IGMD is architected as a multi-disciplinary engine that fuses concepts from signal processing, chaos theory, and information theory. It moves beyond analyzing simple price action to measure the market's underlying "information field"—quantifying its memory, complexity, and causal flows into a single, unified score. The integrated machine learning layer builds on this foundation, creating a transparent, adaptive filter that learns from market conditions in real-time. This combination of a fused, multi-dimensional analysis with a live, probabilistic intelligence layer offers a more dynamic and nuanced perspective than static, single-purpose indicators.
Development Philosophy & A Final Word
This script was designed to answer a single question: "What is the market *really* doing?" The addition of a transparent, adaptive machine learning layer is the next logical step in this pursuit—using computational intelligence to navigate the vast amount of information the core kernels provide.
This tool is offered for educational and analytical purposes and does not constitute financial advice. Its goal is to elevate market analysis from interpreting flat shadows to measuring the rich, geometric reality of the market's information field.
As the great mathematician Benoit Mandelbrot, father of fractal geometry, noted:
"Clouds are not spheres, mountains are not cones, coastlines are not circles, and bark is not smooth, nor does lightning travel in a straight line."
Neither does the market. IGMD is a tool designed to help navigate that beautiful, complex, and fractal reality.
— Dskyz, Trade with insight. Trade with anticipation.

CandelaCharts - Oscillator Concepts 📝 Overview
Oscillator Concepts shows a single, easy‑to‑read line on a scale from −1 to +1 . Near 0 means balance; beyond +1 or −1 means the move is stretched. You can add helpful layers like trend stripes, participation shading, volatility markers, calendar dividers, divergence tags, and simple signal markers. Pick a trading profile (Scalping / Day Trade / Swing / Investment) and the lengths update for you.
📦 Features
A quick tour of the visual layers you can enable. Use this to decide which parts to turn on for reading momentum, extremes, trend bias, participation, and volatility at a glance.
The Line (−1…+1) : A clean momentum read with an optional EMA smooth and clear 0 / ±1 guides.
OS/OB Visualization : Soft gradient fills when price action pushes outside ±1; optional background shading for quick scanning.
Trend Radar : Thin stripes just outside the band that show up‑ or down‑bias using a fast‑vs‑slow EMA spread with anti‑flicker logic.
Participation : Shading that reflects who’s pushing — by MFI, classic up/down volume, delta volume, or a combo model that rewards agreement.
Velocity Pulse : Tiny symbols that only appear when volatility is elevated (outside a neutral 40–60 zone).
Fractal Map : Subtle dashed dividers at Daily / Weekly / Monthly / Yearly / 5‑Year boundaries (Auto picks a sensible cadence).
Divergences : Regular bullish/bearish tags at pivots, with an optional high‑probability filter.
Unified Signals : One common vertical level for triangles (OS/OB re‑entries) and divergence icons so your eye doesn’t hunt.
Profiles : Four presets tune all lookbacks together so the tool stays consistent across timeframes.
Themes : Multiple palettes or fully custom bear/mid/bull colors.
Alerts : Ready for “Any alert() function call” with OS/OB and Divergence options.
⚙️ Settings
Every adjustable input in plain English. Set your profile, show or hide reference levels, pick a theme, and toggle components so the visuals match your style and timeframe.
Trading Profile : Scalping / Day Trade / Swing / Investment — automatically adjusts core lengths.
−1…+1 Levels : Show reference lines at ±1.
Smoothing & Length : EMA smoothing for The Line.
OS/OB Zones & Show Fill : Optional background shade plus gentle gradient fills beyond ±1.
Theme : Presets (Default, Blue–Orange, Green–Red, Teal–Fuchsia, Aqua–Purple, Black–Green, Black–White) or Custom .
Divergences : Turn on detection at pivot highs/lows. Length sets left/right bars. HP filter asks that at least one oscillator anchor sits outside ±1.
Participation : Choose MFI , Volume , Delta Volume , or MFI + Vol + Delta . Set the window; optionally smooth it.
Trend Radar : Up or down stripes just beyond ±1 based on a fast/slow EMA spread. Tune Fast and Slow .
Velocity Pulse : Symbols appear only when volatility exits the 40–60 zone; use Fast / Slow to adjust sensitivity.
Fractal Map : Vertical dividers at time boundaries. Auto selects per timeframe, or pick Daily / Weekly / Monthly / Yearly / 5 Years .
Signals : Show All , only OS/OB , or only Divergence markers (shared height for quick scanning).
Alerts - OS/OB Conditions : Fire when The Line enters extremes (crosses above +1 or below −1).
Alerts - OS/OB Signals : Fire when The Line re‑enters the band (comes back inside from > +1 or < −1).
Alerts - Divergence Conditions : Raw regular divergences right when the pivot forms (no HP filter).
Alerts - Divergence Signals : Confirmed regular divergences that pass the HP filter.
⚡️ Showcase
A visual gallery of the indicator's components. Each image highlights one layer at a time—The Line, OS/OB fills, Trend Radar, Participation, Velocity Pulse, Fractal Map, Divergences, and Signals—so you can quickly recognize how each looks on a live chart.
The Line
Participation
Trend Radar
Velocity Pulse
Fractal Map
Divergences
Signals
Overbought/Oversold
📒 Usage
Hands‑on guidance for reading the line, thresholds, and add‑ons in live markets. Learn when to favor continuation vs. mean‑reversion, how to weigh participation and volatility, and where to set invalidation and targets.
Scale : 0 = balance. ±1 = adaptive extremes. A push beyond ±1 isn’t an automatic fade — check trend stripes, participation, and volatility.
Trend vs Mean‑Revert : With bull stripes, favor pullback buys on OS re‑entries; with bear stripes, favor fades on OB re‑entries.
Participation : Strong positive shading supports continuation; weak/negative during new highs is a caution flag.
Volatility Pulse : Symbols only appear when energy is high. In trends they often mark expansion; counter‑trend they can precede snap‑backs.
Divergences : Raw is early; HP is selective. Treat HP as higher‑quality context, not a stand‑alone signal.
Risk : Use nearby structure (swing points, session highs/lows, or a fractal divider) for invalidation. Scale targets around 0 / ±1 and current vol.
Profiles : If entries feel late/early, try a different profile before hand‑tuning every length.
🚨 Alerts
What you can be notified about and how to turn it on. Covers entering extremes, re‑entries from extremes, and divergence detections, with a recommended schedule (once per bar close).
OS/OB Condition — Entered Overbought → when The Line moves up through +1.
OS/OB Condition — Entered Oversold → when The Line moves down through −1.
OS/OB Signal — Re‑Entry from Overbought/Oversold → when The Line comes back inside from an extreme.
Divergence Condition — Bullish/Bearish (raw) → printed as soon as a regular divergence is detected.
Divergence Signal — Bullish/Bearish (confirmed) → only fires when the high‑probability filter passes.
⚠️ Disclaimer
These tools are exclusively available on the TradingView platform.
Our charting tools are intended solely for informational and educational purposes and should not be regarded as financial, investment, or trading advice. They are not designed to predict market movements or offer specific recommendations. Users should be aware that past performance is not indicative of future results and should not rely on these tools for financial decisions. By using these charting tools, the purchaser agrees that the seller and creator hold no responsibility for any decisions made based on information provided by the tools. The purchaser assumes full responsibility and liability for any actions taken and their consequences, including potential financial losses or investment outcomes that may result from the use of these products.
By purchasing, the customer acknowledges and accepts that neither the seller nor the creator is liable for any undesired outcomes stemming from the development, sale, or use of these products. Additionally, the purchaser agrees to indemnify the seller from any liability. If invited through the Friends and Family Program, the purchaser understands that any provided discount code applies only to the initial purchase of Candela's subscription. The purchaser is responsible for canceling or requesting cancellation of their subscription if they choose not to continue at the full retail price. In the event the purchaser no longer wishes to use the products, they must unsubscribe from the membership service, if applicable.
We do not offer reimbursements, refunds, or chargebacks. Once these Terms are accepted at the time of purchase, no reimbursements, refunds, or chargebacks will be issued under any circumstances.
By continuing to use these charting tools, the user confirms their understanding and acceptance of these Terms as outlined in this disclaimer.

Behdad v2 Daily Weekly Monthly HLC & SessionsThis indicator plots the highest and lowest as well as the closing price of the market for daily, weekly and monthly periods. It is also a great help for trading by identifying the range of sessions and fractals.
Extended Majors Rotation System | AlphaNattExtended Majors Rotation System | AlphaNatt
A sophisticated cryptocurrency rotation system that dynamically allocates capital to the strongest trending major cryptocurrencies using multi-layered relative strength analysis and adaptive filtering techniques.
"In crypto markets, the strongest get stronger. This system identifies and rides the leaders while avoiding the laggards through mathematical precision."
━━━━━━━━━━━━━━━━━━━━━━━━━━━━━━━━━━━━━━━━
📊 SYSTEM OVERVIEW
The Extended Majors Rotation System (EMRS) is a quantitative momentum rotation strategy that:
Analyzes 10 major cryptocurrencies simultaneously
Calculates relative strength between all possible pairs (45 comparisons)
Applies fractal dimension analysis to identify trending behavior
Uses adaptive filtering to reduce noise while preserving signals
Dynamically allocates to the mathematically strongest asset
Implements multi-layer risk management through market regime filters
Core Philosophy:
Rather than trying to predict which cryptocurrency will perform best, the system identifies which one is already performing best relative to all others and maintains exposure until leadership changes.
━━━━━━━━━━━━━━━━━━━━━━━━━━━━━━━━━━━━━━━━
🎯 WHAT MAKES THIS SYSTEM UNEQUIVOCALLY UNIQUE
1. True Relative Strength Matrix
Unlike simple momentum strategies that look at individual asset performance, EMRS calculates the complete relative strength matrix between all assets. Each asset is compared against every other asset using fractal analysis, creating a comprehensive strength map of the entire crypto market.
2. Hurst Exponent Integration
The system employs the Hurst Exponent to distinguish between:
Trending behavior (H > 0.5) - where momentum is likely to persist
Mean-reverting behavior (H < 0.5) - where reversals are likely
Random walk (H ≈ 0.5) - where no edge exists
This ensures the system only takes positions when mathematical evidence of persistence exists.
3. Dual-Layer Filtering Architecture
Combines two advanced filtering techniques:
Laguerre Polynomial Filters: Provides low-lag smoothing with minimal distortion
Kalman-like Adaptive Smoothing: Adjusts filter parameters based on market volatility
This dual approach preserves important price features while eliminating noise.
4. Market Regime Awareness
The system monitors overall crypto market conditions through multiple lenses and only operates when:
The broad crypto market shows positive technical structure
Sufficient trending behavior exists across major assets
Risk conditions are favorable
5. Rank-Based Selection with Trend Confirmation
Rather than simply choosing the top-ranked asset, the system requires:
High relative strength ranking
Positive individual trend confirmation
Alignment with market regime
This multi-factor approach reduces false signals and whipsaws.
━━━━━━━━━━━━━━━━━━━━━━━━━━━━━━━━━━━━━━━━
🛡️ SYSTEM ROBUSTNESS & DEVELOPMENT METHODOLOGY
Pre-Coding Design Philosophy
This system was completely designed before any code was written . The mathematical framework, indicator selection, and parameter ranges were determined through:
Theoretical analysis of market microstructure
Study of persistence and mean reversion in crypto markets
Mathematical modeling of relative strength dynamics
Risk framework development based on regime theory
No Post-Optimization
Zero parameter fitting: All parameters remain at their originally designed values
No curve fitting: The system uses the same settings across all market conditions
No cherry-picking: Parameters were not adjusted after seeing results
This approach ensures the system captures genuine market dynamics rather than historical noise
Parameter Robustness Testing
Extensive testing was conducted to ensure stability:
Sensitivity Analysis: System maintains positive expectancy across wide parameter ranges
Walk-Forward Analysis: Consistent performance across different time periods
Regime Testing: Performs in both trending and choppy conditions
Out-of-Sample Validation
System was designed on a selection of 10 assets
System was tested on multiple baskets of 10 other random tokens, to simualte forwards testing
Performance remains consistent across baskets
No adjustments made based on out-of-sample results
━━━━━━━━━━━━━━━━━━━━━━━━━━━━━━━━━━━━━━━━
📈 PERFORMANCE METRICS DISPLAYED
The system provides real-time performance analytics:
Risk-Adjusted Returns:
Sharpe Ratio: Measures return per unit of total risk
Sortino Ratio: Measures return per unit of downside risk
Omega Ratio: Probability-weighted ratio of gains vs losses
Maximum Drawdown: Largest peak-to-trough decline
Benchmark Comparison:
Live comparison against Bitcoin buy-and-hold strategy
Both equity curves displayed with gradient effects
Performance metrics shown for both strategies
Visual representation of outperformance/underperformance
━━━━━━━━━━━━━━━━━━━━━━━━━━━━━━━━━━━━━━━━
🔧 OPERATIONAL MECHANICS
Asset Universe:
The system analyzes 10 major cryptocurrencies, customizable through inputs:
Bitcoin (BTC)
Ethereum (ETH)
Solana (SOL)
XRP
BNB
Dogecoin (DOGE)
Cardano (ADA)
Chainlink (LINK)
Additional majors
Signal Generation Process:
Calculate relative strength matrix
Apply Hurst Exponent analysis to each ratio
Rank assets by aggregate relative strength
Confirm individual asset trend
Verify market regime conditions
Allocate to highest-ranking qualified asset
Position Management:
Single asset allocation (no diversification)
100% in strongest trending asset or 100% cash
Daily rebalancing at close
No leverage employed in base system
━━━━━━━━━━━━━━━━━━━━━━━━━━━━━━━━━━━━━━━━
📊 VISUAL INTERFACE
Information Dashboard:
System state indicator (ON/OFF)
Current allocation display
Real-time performance metrics
Sharpe, Sortino, Omega ratios
Maximum drawdown tracking
Net profit multiplier
Equity Curves:
Cyan curve: System performance with gradient glow effect
Magenta curve: Bitcoin HODL benchmark with gradient
Visual comparison of both strategies
Labels indicating current values
Alert System:
Alerts fire when allocation changes
Displays selected asset symbol
"CASH" alert when system goes defensive
━━━━━━━━━━━━━━━━━━━━━━━━━━━━━━━━━━━━━━━━
⚠️ IMPORTANT CONSIDERATIONS
Appropriate Use Cases:
Medium to long-term crypto allocation
Systematic approach to crypto investing
Risk-managed exposure to cryptocurrency markets
Alternative to buy-and-hold strategies
Limitations:
Daily rebalancing required
Not suitable for high-frequency trading
Requires liquid markets for all assets
Best suited for spot trading (no derivatives)
Risk Factors:
Cryptocurrency markets are highly volatile
Past performance does not guarantee future results
System can underperform in certain market conditions
Not financial advice - for educational purposes only
━━━━━━━━━━━━━━━━━━━━━━━━━━━━━━━━━━━━━━━━
🎓 THEORETICAL FOUNDATION
The system is built on several academic principles:
1. Momentum Anomaly
Extensive research shows that assets exhibiting strong relative momentum tend to continue outperforming in the medium term (Jegadeesh & Titman, 1993).
2. Fractal Market Hypothesis
Markets exhibit fractal properties with periods of persistence and mean reversion (Peters, 1994). The Hurst Exponent quantifies these regimes.
3. Adaptive Market Hypothesis
Market efficiency varies over time, creating periods where momentum strategies excel (Lo, 2004).
4. Cross-Sectional Momentum
Relative strength strategies outperform time-series momentum in cryptocurrency markets due to the high correlation structure.
━━━━━━━━━━━━━━━━━━━━━━━━━━━━━━━━━━━━━━━━
💡 USAGE GUIDELINES
Capital Requirements:
Suitable for any account size
No minimum capital requirement
Scales linearly with account size
Implementation:
Can be traded manually with daily signals
Suitable for automation via alerts
Works with any broker supporting crypto
━━━━━━━━━━━━━━━━━━━━━━━━━━━━━━━━━━━━━━━━
📝 FINAL NOTES
The Extended Majors Rotation System represents a systematic, mathematically-driven approach to cryptocurrency allocation. By combining relative strength analysis with fractal market theory and adaptive filtering, it aims to capture the persistent trends that characterize crypto bull markets while avoiding the drawdowns of buy-and-hold strategies.
The system's robustness comes not from optimization, but from sound mathematical principles applied consistently. Every component was chosen for its theoretical merit before any backtesting occurred, ensuring the system captures genuine market dynamics rather than historical artifacts.
"In the race between cryptocurrencies, bet on the horse that's already winning - but only while the track conditions favour racing."
━━━━━━━━━━━━━━━━━━━━━━━━━━━━━━━━━━━━━━━━
Developed by AlphaNatt | Quantitative Rotation Systems
Version: 1.0
Strategy Type: Momentum Rotation
Classification: Systematic Trend Following
Not financial advice. Always DYOR.

[DEM] Pullback Signal (With Backtesting) Pullback Signal (With Backtesting) is a sophisticated fractal-based indicator that identifies potential reversal opportunities by detecting swing highs and lows followed by pullback conditions in the opposite direction. The indicator uses complex fractal logic to identify pivot points where price forms a local high or low over a customizable period (default 3 bars), then generates buy signals when an upward fractal is identified and the current close is below the previous close, or sell signals when a downward fractal occurs and the current close is above the previous close. This approach captures the classic pullback scenario where price retraces after forming a swing point, potentially offering favorable risk-reward entry opportunities. The indicator includes comprehensive backtesting functionality that tracks signal accuracy, average returns, and signal frequency over time, displaying these performance metrics in a detailed statistics table to help traders evaluate the historical effectiveness of the pullback strategy across different market conditions.
Price Action [BreakOut] InternalKey Features and Functionality
Support & Resistance (S/R): The script automatically identifies and draws support and resistance lines based on a user-defined "swing period." These lines are drawn from recent pivot points, and users can customize their appearance, including color, line style (solid, dashed, dotted), and extension (left, right, or both). The indicator can also display the exact price of each S/R level.
Trendlines: It draws trendlines connecting pivot highs and pivot lows. This feature helps visualize the current trend direction. Users can choose to show only the newest trendlines, customize their length and style, and select the source for the pivot points (e.g., candle close or high/low shadow).
Price Action Pivots: This is a core component that identifies and labels different types of pivots based on price action: Higher Highs (HH), Lower Highs (LH), Higher Lows (HL), and Lower Lows (LL). These pivots are crucial for understanding market structure and identifying potential trend changes. The script marks these pivots with shapes and can display their price values.
Fractal Breakouts: The script identifies and signals "fractal breakouts" and "breakdowns" when the price closes above a recent high pivot or below a recent low pivot, respectively. These signals are visually represented with up (⬆) and down (⬇) arrow symbols on the chart.
Customization and Alerts: The indicator is highly customizable. You can toggle on/off various features (S/R, trendlines, pivots, etc.), adjust colors, line styles, and text sizes. It also includes an extensive list of alert conditions, allowing traders to receive notifications for:
Price Crossovers: When the close price crosses over or under a support or resistance level.
Trendline Breaks: When the price breaks above an upper trendline or below a lower trendline.
Fractal Breaks: When a fractal breakout or breakdown occurs.

Information-Geometric Market DynamicsInformation-Geometric Market Dynamics
The Information Field: A Geometric Approach to Market Dynamics
By: DskyzInvestments
Foreword: Beyond the Shadows on the Wall
If you have traded for any length of time, you know " the feeling ." It is the frustration of a perfect setup that fails, the whipsaw that stops you out just before the real move, the nagging sense that the chart is telling you only half the story. For decades, technical analysis has relied on interpreting the shadows—the patterns left behind by price. We draw lines on these shadows, apply indicators to them, and hope they reveal the future.
But what if we could stop looking at the shadows and, instead, analyze the object casting them?
This script introduces a new paradigm for market analysis: Information-Geometric Market Dynamics (IGMD) . The core premise of IGMD is that the price chart is merely a one-dimensional projection of a much richer, higher-dimensional reality—an " information field " generated by the collective actions and beliefs of all market participants.
This is not just another collection of indicators. It is a unified framework for measuring the geometry of the market's information field—its memory, its complexity, its uncertainty, its causal flows—and making high-probability decisions based on that deeper reality. By fusing advanced mathematical and informational concepts, IGMD provides a multi-faceted lens through which to view market behavior, moving beyond simple price action into the very structure of market information itself.
Prepare to move beyond the flatland of the price chart. Welcome to the information field.
The IGMD Framework: A Multi-Kernel Approach
What is a Kernel? The Heart of Transformation
In mathematics and data science, a kernel is a powerful and elegant concept. At its core, a kernel is a function that takes complex, often inscrutable data and transforms it into a more useful format. Think of it as a specialized lens or a mathematical "probe." You cannot directly measure abstract concepts like "market memory" or "trend quality" by looking at a price number. First, you must process the raw price data through a specific mathematical machine—a kernel—that is designed to output a measurement of that specific property. Kernels operate by performing a sort of "similarity test," projecting data into a higher-dimensional space where hidden patterns and relationships become visible and measurable.
Why do creators use them? We use kernels to extract features —meaningful pieces of information—that are not explicitly present in the raw data. They are the essential tools for moving beyond surface-level analysis into the very DNA of market behavior. A simple moving average can tell you the average price; a suite of well-chosen kernels can tell you about the character of the price action itself.
The Alchemist's Challenge: The Art of Fusion
Using a single kernel is a challenge. Using five distinct, computationally demanding mathematical engines in unison is an immense undertaking. The true difficulty—and artistry—lies not just in using one kernel, but in fusing the outputs of many . Each kernel provides a different perspective, and they can often give conflicting signals. One kernel might detect a strong trend, while another signals rising chaos and uncertainty. The IGMD script's greatest strength is its ability to act as this alchemist, synthesizing these disparate viewpoints through a weighted fusion process to produce a single, coherent picture of the market's state. It required countless hours of testing and calibration to balance the influence of these five distinct analytical engines so they work in harmony rather than cacophony.
The Five Kernels of Market Dynamics
The IGMD script is built upon a foundation of five distinct kernels, each chosen to probe a unique and critical dimension of the market's information field.
1. The Wavelet Kernel (The "Microscope")
What it is: The Wavelet Kernel is a signal processing function designed to decompose a signal into different frequency scales. Unlike a Fourier Transform that analyzes the entire signal at once, the wavelet slides across the data, providing information about both what frequencies are present and when they occurred.
The Kernels I Use:
Haar Kernel: The simplest wavelet, a square-wave shape defined by the coefficients . It excels at detecting sharp, sudden changes.
Daubechies 2 (db2) Kernel: A more complex and smoother wavelet shape that provides a better balance for analyzing the nuanced ebb and flow of typical market trends.
How it Works in the Script: This kernel is applied iteratively. It first separates the finest "noise" (detail d1) from the first level of trend (approximation a1). It then takes the trend a1 and repeats the process, extracting the next level of cycle (d2) and trend (a2), and so on. This hierarchical decomposition allows us to separate short-term noise from the long-term market "thesis."
2. The Hurst Exponent Kernel (The "Memory Gauge")
What it is: The Hurst Exponent is derived from a statistical analysis kernel that measures the "long-term memory" or persistence of a time series. It is the definitive measure of whether a series is trending (H > 0.5), mean-reverting (H < 0.5), or random (H = 0.5).
How it Works in the Script: The script employs a method based on Rescaled Range (R/S) analysis. It calculates the average range of price movements over increasingly larger time lags (m1, m2, m4, m8...). The slope of the line plotting log(range) vs. log(lag) is the Hurst Exponent. Applying this complex statistical analysis not to the raw price, but to the clean, wavelet-decomposed trend lines, is a key innovation of IGMD.
3. The Fractal Dimension Kernel (The "Complexity Compass")
What it is: This kernel measures the geometric complexity or "jaggedness" of a price path, based on the principles of fractal geometry. A straight line has a dimension of 1; a chaotic, space-filling line approaches a dimension of 2.
How it Works in the Script: We use a version based on Ehlers' Fractal Dimension Index (FDI). It calculates the rate of price change over a full lookback period (N3) and compares it to the sum of the rates of change over the two halves of that period (N1 + N2). The formula d = (log(N1 + N2) - log(N3)) / log(2) quantifies how much "longer" and more convoluted the price path was than a simple straight line. This kernel is our primary filter for tradeable (low complexity) vs. untradeable (high complexity) conditions.
4. The Shannon Entropy Kernel (The "Uncertainty Meter")
What it is: This kernel comes from Information Theory and provides the purest mathematical measure of information, surprise, or uncertainty within a system. It is not a measure of volatility; a market moving predictably up by 10 points every bar has high volatility but zero entropy .
How it Works in the Script: The script normalizes price returns by the ATR, categorizes them into a discrete number of "bins" over a lookback window, and forms a probability distribution. The Shannon Entropy H = -Σ(p_i * log(p_i)) is calculated from this distribution. A low H means returns are predictable. A high H means returns are chaotic. This kernel is our ultimate gauge of market conviction.
5. The Transfer Entropy Kernel (The "Causality Probe")
What it is: This is by far the most advanced and computationally intensive kernel in the script. Transfer Entropy is a non-parametric measure of directed information flow between two time series. It moves beyond correlation to ask: "Does knowing the past of Volume genuinely reduce our uncertainty about the future of Price?"
How it Works in the Script: To make this work, the script discretizes both price returns and the chosen "driver" (e.g., OBV) into three states: "up," "down," or "neutral." It then builds complex conditional probability tables to measure the flow of information in both directions. The Net Transfer Entropy (TE Driver→Price minus TE Price→Driver) gives us a direct measure of causality . A positive score means the driver is leading price, confirming the validity of the move. This is a profound leap beyond traditional indicator analysis.
Chapter 3: Fusion & Interpretation - The Field Score & Dashboard
Each kernel is a specialist providing a piece of the puzzle. The Field Score is where they are fused into a single, comprehensive reading. It's a weighted sum of the normalized scores from all five kernels, producing a single number from -1 (maximum bearish information field) to +1 (maximum bullish information field). This is the ultimate "at-a-glance" metric for the market's net state, and it is interpreted through the dashboard.
The Dashboard: Your Mission Control
Field Score & Regime: The master metric and its plain-English interpretation ("Uptrend Field", "Downtrend Field", "Transitional").
Kernel Readouts (Wave Align, H(w), FDI, etc.): The live scores of each individual kernel. This allows you to see why the Field Score is what it is. A high Field Score with all components in agreement (all green or red) is a state of High Coherence and represents a high-quality setup.
Market Context: Standard metrics like RSI and Volume for additional confluence.
Signals: The raw and adjusted confluence counts and the final, calculated probability scores for potential long and short entries.
Pattern: Shows the dominant candlestick pattern detected within the currently forming APEX range box and its calculated confidence percentage.
Chapter 4: Mastering the Controls - The Inputs Menu
Every parameter is a lever to fine-tune the IGMD engine.
📊 Wavelet Transform: Kernel ( Haar for sharp moves, db2 for smooth trends) and Scales (depth of analysis) let you tune the script's core microscope to your asset's personality.
📈 Hurst Exponent: The Window determines if you're assessing short-term or long-term market memory.
🔍 Fractal Dimension & ⚡ Entropy Volatility: Adjust the lookback windows to make these kernels more or less sensitive to recent price action. Always keep "Normalize by ATR" enabled for Entropy for consistent results.
🔄 Transfer Entropy: Driver lets you choose what causal force to measure (e.g., OBV, Volume, or even an external symbol like VIX). The throttle setting is a crucial performance tool, allowing you to balance precision with script speed.
⚡ Field Fusion • Weights: This is where you can customize the model's "brain." Increase the weights for the kernels that best align with your trading philosophy (e.g., w_hurst for trend followers, w_fdi for chop avoiders).
📊 Signal Engine: Mode offers presets from Conservative to Aggressive . Min Confluence sets your evidence threshold. Dynamic Confluence is a powerful feature that automatically adapts this threshold to the market regime.
🎨 Visuals & 📏 Support/Resistance: These inputs give you full control over the chart's appearance, allowing you to toggle every visual element for a setup that is as clean or as data-rich as you desire.
Chapter 5: Reading the Battlefield - On-Chart Visuals
Pattern Boxes (The Large Rectangles): These are not simple range boxes. They appear when the Field Score crosses a significance threshold, signaling a potential ignition point.
Color: The color reflects the dominant candlestick pattern that has occurred within that box's duration (e.g., green for Bull Engulf).
Label: Displays the dominant pattern, its duration in bars, and a calculated Confidence % based on field strength and pattern clarity.
Bar Pattern Boxes (The Small Boxes): If enabled, these highlight individual, significant candlestick patterns ( BE for Bull Engulf, H for Hammer) on a bar-by-bar basis.
Signal Markers (▲ and ▼): These appear only when the Signal Engine's criteria are all met. The number is the calculated Probability Score .
RR Rails (Dashed Lines): When a signal appears, these lines automatically plot the Entry, Stop Loss (based on ATR), and two Take Profit targets (based on Risk/Reward ratios). They dynamically break and disappear as price touches each level.
Support & Resistance Lines: Plots of the highest high ( Resistance ) and lowest low ( Support ) over a lookback, providing key structural levels.
Chapter 6: Development Philosophy & A Final Word
One single question: " What is the market really doing? " It represents a triumph of complexity, blending concepts from signal processing, chaos theory, and information theory into a cohesive framework. It is offered for educational and analytical purposes and does not constitute financial advice. Its goal is to elevate your analysis from interpreting flat shadows to measuring the rich, geometric reality of the market's information field.
As the great mathematician Benoit Mandelbrot , father of fractal geometry, noted:
"Clouds are not spheres, mountains are not cones, coastlines are not circles, and bark is not smooth, nor does lightning travel in a straight line."
Neither does the market. IGMD is a tool designed to navigate that beautiful, complex, and fractal reality.
— Dskyz, Trade with insight. Trade with anticipation.

ZenAlgo - ADXThis open-source indicator builds upon the official Average Directional Index (ADX) implementation by TradingView. It preserves the core logic of the original ADX while introducing additional visualization features, configurability, and analytical overlays to assist with directional strength analysis.
Core Calculation
The script computes the ADX, +DI, and -DI based on smoothed directional movement and true range over a user-defined length. The smoothing is performed using Wilder’s method, as in the original implementation.
True Range is calculated from the current high, low, and previous close.
Directional Movement components (+DM, -DM) are derived by comparing the change in highs and lows between consecutive bars.
These values are then smoothed, and the +DI and -DI are expressed as percentages of the smoothed True Range.
The difference between +DI and -DI is normalized to derive DX, which is further smoothed to yield the ADX value.
The indicator includes a selectable signal line (SMA or EMA) applied to the ADX for crossover-based visualization.
Visualization Enhancements
Several plots and conditions have been added to improve interpretability:
Color-coded histograms and lines visualize DI relative to a configurable threshold (default: 25). Colors follow the ZenAlgo color scheme.
Dynamic opacity and gradient coloring are used for both ADX and DI components, allowing users to distinguish weak/moderate/strong directional trends visually.
Mirrored ADX is internally calculated for certain overlays but not directly plotted.
The script also provides small circles and diamonds to highlight:
Crossovers between ADX and its signal line.
DI crossing above or below the 25 threshold.
Rising ADX confirmed by rising DI values, with point size reflecting ADX strength.
Divergence Detection
The indicator includes optional detection of fractal-based divergences on the DI curve:
Regular and hidden bullish and bearish divergences are identified based on relative fractal highs/lows in both price and DI.
Detected divergences are optionally labeled with 'R' (Regular) or 'H' (Hidden), and color-coded accordingly.
Fractal points are defined using 5-bar patterns to ensure consistency and reduce false positives.
ADX/DI Table
When enabled, a floating table displays live values and summaries:
ADX value , trend direction (rising/falling), and qualitative strength.
DI composite , trend direction, and relative strength.
Contextual power dynamics , describing whether bulls or bears are gaining or losing strength.
The background colors of the table reflect current trend strength and direction.
Interpretation Guidelines
ADX indicates the strength of a trend, regardless of its direction. Values below 20 are often considered weak, while those above 40 suggest strong trending conditions.
+DI and -DI represent bullish and bearish directional movements, respectively. Crossovers between them are used to infer trend direction.
When ADX is rising and either +DI or -DI is dominant and increasing, the trend is likely strengthening.
Divergences between DI and price may suggest potential reversals but should be interpreted cautiously and not in isolation.
The threshold line (default 25) provides a basic filter for ignoring low-strength conditions. This can be adjusted depending on the market or timeframe.
Added Value over Existing Indicators
Fully color-graded ADX and DI display for better visual clarity.
Optional signal MA over ADX with crossover markers.
Rich contextual labeling for both divergence and threshold events.
Power dynamics commentary and live table help users contextualize current momentum.
Customizable options for smoothing type, divergence display, table position, and visual offsets.
These additions aim to improve situational awareness without altering the fundamental meaning of ADX/DI values.
Limitations and Disclaimers
As with any ADX-based tool, this indicator does not indicate market direction alone —it measures strength, not trend bias.
Divergence detection relies on fractal patterns and may lag or produce false positives in sideways markets.
Signal MA crossovers and DI threshold breaks are not entry signals , but contextual markers that may assist with timing or filtering other systems.
The table text and labels are for visual assistance and do not replace proper technical analysis or market context.

kaka-Buff横盘系统与CVD和LVP
作用:此指标用于识别市场横盘(震荡)区间,检测累积成交量差额(CVD)背离(基于分形和参考方法),并标记基于大成交量K线的关键价格水平(Large Volume Price, LVP)。它通过结合横盘信号、成交量背离和关键价格水平,帮助交易者识别潜在的趋势反转或延续。指标还绘制可自定义的指数移动平均线(EMA)以辅助趋势分析。主要功能:横盘检测:使用EMA标准差(STD)、平均真实波幅(ATR)、平均方向指数(ADX)和布林带宽度(BB宽度)识别低波动性的横盘区间。
分形CVD背离:通过分形枢轴点和成交量差额计算,检测看涨(“+RD”)和看跌(“-RD”)背离,以标签形式显示在图表上。
参考CVD背离:在成交量分布区域(VAH、VAL、POC)内识别简单的CVD背离(基于价格和成交量差额高/低点),以绿色/红色三角形显示。
大成交量价格(LVP):在回看周期(可自主设置长度)内标记最大成交量K线的最高/最低价,绘制线和标签,指示关键支撑/阻力位。
EMA线:绘制20、50、100和200周期的EMA,带开关控制和可自定义颜色,用于趋势可视化。
表格:以可自定义的表格(字体大小/颜色均可调节)显示横盘指标(EMA STD、ATR、ADX、BB宽度)和整体横盘状态。
警报:提供横盘进入/退出、分形CVD背离、参考CVD背离和LVP价格突破的警报。
Consolidation System with CVD and LVP
Purpose: This indicator identifies market consolidation zones, detects Cumulative Volume Delta (CVD) divergences (both fractal-based and reference-based), and marks significant price levels based on large volume bars (Large Volume Price, LVP). It helps traders identify potential trend reversals or continuations by combining consolidation signals, volume-based divergence, and key price levels. The indicator also plots customizable Exponential Moving Averages (EMAs) to aid in trend analysis.Key Features:Consolidation Detection: Uses EMA Standard Deviation (STD), Average True Range (ATR), Average Directional Index (ADX), and Bollinger Bands (BB) width to identify low-volatility consolidation zones.
Fractal CVD Divergence: Detects bullish ("+RD") and bearish ("-RD") divergences using fractal pivot points and a volume delta calculation, displayed as labels on the chart.
Reference CVD Divergence: Identifies simpler CVD divergences (based on price and volume delta highs/lows) within volume profile zones (VAH, VAL, POC), shown as green/red triangles.
Large Volume Price (LVP): Marks the high/low of the highest volume bar within a lookback period with lines and labels, indicating key support/resistance levels.
EMA Lines: Plots EMA 20, 50, 100, and 200 with toggle switches and customizable colors for trend visualization.
Table: Displays consolidation metrics (EMA STD, ATR, ADX, BB width) and overall consolidation status in a customizable table.
Alerts: Provides alerts for consolidation entry/exit, fractal CVD divergences, reference CVD divergences, and LVP price crossings.

Sentival | QuantEdgeBIntroducing Sentival by QuantEdgeB.
An Adaptive Multi-Factor Indicator for Market Valuation & Trend Strength
____
Overview
The Sentival Valuation System is a medium-term, multi-factor valuation tool designed to assess market conditions using a combination of momentum, mean reversion, and risk-adjusted metrics. It provides traders and investors with a dynamic score reflecting market valuation, ranging from strongly oversold to strongly overbought conditions.
This system leverages a diverse range of technical indicators, including momentum oscillators, volatility measures, risk ratios, and mean-reversion metrics, providing a holistic view of market conditions.
____
1. Key Features
🛠 Multi-Factor Valuation Model
Sentival aggregates nine different indicators, normalizing and rescaling them into a standardized z-score-based valuation system. The final output represents an average of the selected indicators, allowing for flexible customization based on the user’s preference.
📊 Customizable Indicator Selection
Users can enable or disable any of the nine valuation factors, ensuring the system adapts to different market environments, trading styles, and assets.
🔄 Multi-Timeframe Adaptability
Sentival can be used across different time horizons, making it suitable for short-term mean reversion, medium-term traders, or long-term valuation analysis by simply adjusting the timeframe and indicator settings. This flexibility allows traders to adapt Sentival to various market conditions and trading objectives.
🎨 Intuitive Dashboard & Color Coding
- Dynamic Heatmap & Dashboard: Displays valuation strength across multiple factors.
- Gradient-Based Overbought/Oversold Signals: Clear color-coded signals for easy interpretation.
- Background Highlighting: Optional oversold/overbought background zones.
🏆 Statistical & Risk-Based Insights
- Standardized Rescaling & Z-Score Analysis to prevent bias from individual indicators.
- Risk-Adjusted Metrics such as Sharpe, Sortino, and Omega Ratios help assess the overall market risk appetite.
- Trend Following Mode (TF Display): Users can enable the "Trend Following" option to display the trend direction, helping to align valuation signals with the broader market trend.
____
2. How It Works
Sentival is a multi-factor trend and momentum analysis system, designed to track market cycle shifts using a combination of volatility, momentum, risk assessment, and valuation mechanisms. Instead of focusing on one dimension of the market, Sentival integrates multiple methodologies to cross-validate signals and reduce noise. Each indicator in Sentival plays a specific role, ensuring confirmation across different market conditions.
How Each Component Works Together
1️⃣ Chande Momentum Oscillator (CMO)
• A momentum-based measure that determines whether price action is dominated by upward or downward forces.
• Works well in combination with volatility measures to confirm whether a move is sustainable.
2️⃣ Disparity Index
• Measures the distance between price and its moving average, acting as an overextension filter.
• Ensures that trend-following signals are not driven by short-term spikes but sustained trends.
3️⃣ Bollinger Bands % (BB%)
• A volatility measure that indicates how far price is from the statistical mean.
• Helps identify trend exhaustion points where price moves become unstable.
4️⃣ Relative Strength Index (RSI)
• A trend confirmation layer, ensuring that momentum strength aligns with price movement.
• Adds an additional check to prevent false breakouts.
5️⃣ Rate of Change (RoC)
• Captures the speed of price movement, ensuring that the market has enough momentum for trend continuation.
• Works well with risk indicators to filter weaker moves.
6️⃣ Price Z-Score
• A statistical tool to measure how far price is from its long-term equilibrium.
• Helps prevent entering overstretched trends too late.
7️⃣ Risk Ratios (Sharpe, Sortino, Omega)
• This is the risk-adjusted performance component, ensuring that trends have a healthy risk-reward balance.
• Helps determine when a trend has structurally strong backing rather than speculative movement.
8️⃣ Hurst Cycle Analysis
• Measures the persistence of trends by analyzing price fractals.
• Ensures that the market regime is either trending or mean-reverting, improving trade confidence.
9️⃣ Commodity Channel Index (CCI)
• Helps identify strong trend conditions, adding another layer of momentum confirmation.
• Works well with other oscillators to prevent misreading counter-trends.
🔗 Why These Components Work Well Together
• Momentum + Volatility + Risk → Instead of relying on a single category, Sentival merges multiple dimensions of market behavior into a cohesive signal.
• Filters Out False Signals → Combining momentum oscillators, volatility measures, and risk-adjusted metrics ensures high-confidence entries.
• Adaptability Across Market Regimes → Whether the market is trending, consolidating, or volatile, the system adjusts dynamically.
• Cross-Validation for Trend Strength → If multiple components align, it increases certainty that a trend is real and sustainable.
____
3. Sentival Scanner - table breakdown
The dashboard-style table generated is designed to give traders a holistic market view at a glance. It processes a variety of technical signals and distills them into readable labels, visual strength bars, and actionable trend states. Here's a breakdown of what each section means:
1. Direction
This section analyzes whether the average Z-score (a composite of several indicators) is increasing, decreasing, or neutral over time. It does this using a smoothed trend of the Z-score, comparing recent values to older ones.
2. Momentum
Momentum is derived from the rate of change (RoC) of the average Z-score. It evaluates how strong the current move is. If momentum is above a certain positive threshold, it’s considered positive, if below a negative threshold, it’s negative, otherwise it’s neutral.
3. Impulse
Impulse reflects the velocity of momentum — in other words, is the market speeding up or slowing down? High positive values suggest strong acceleration (strong impulse), while negative values show deceleration or stalling.
4. Drive
This metric combines momentum and velocity to create a descriptive phrase that captures the market’s behavior. For example:
• “Strong Upside” means strong momentum with acceleration.
• “Fading Downside” means bearish momentum losing steam.
• “Neutral” appears when momentum is indecisive.
5. Deviation Distance
This represents how far the market price is from fair value in terms of standard deviation units (σ). It’s calculated using Z-scores and classified as:
• +1σ, +2σ, etc., for overvalued regions.
• −1σ, −2σ, etc., for undervalued areas.
• “At Fair Value” if close to the mean.
6. Bull and Bear Strength Bars
The system computes both bullish and bearish strength, using distance from fair value, the rate of change, and the velocity. These strengths are displayed as progress bars, giving a quick visual cue of conviction. The table labels them as:
• “Bull Conviction” if there's a long bias.
• “Bull Potential” if bullish but undecided.
• “Bear Conviction” or “Bear Potential” for short-side equivalents.
7. Trend Signal
This is a simple label that tells you if the scanner recommends a Long, Short, or Cash (neutral) stance based on threshold logic. It is based on whether the average Z-score crosses above a long threshold or below a short one.
8. Stage
The “Stage” label summarizes the valuation environment based on the composite Z-score:
• Strong Undervalued
• Moderately Undervalued
• Fair Value
• Overvalued, etc.
This stage helps traders know whether they are operating in cheap or expensive territory statistically.
Summary
Overall, this table merges advanced technical signals like momentum, volatility, valuation, and risk into a digestible format that updates dynamically with each bar. The goal is to provide traders with a 360° perspective on market conditions, tailored for both trend-following and mean-reversion strategies.
___________
4. Sentival Valuation Score & Interpretation
🔹 Sentival Score Ranges
- 📉 Strongly Oversold (-2 and below) → Market is extremely undervalued; potential reversal.
- 📉 Moderately Oversold (-1.5 to -2) → Discounted market conditions, buying interest may emerge.
- 📉 Slightly Oversold (-0.5 to -1.5) → Possible accumulation phase.
- ⚖ Fair Value (-0.5 to +0.5) → Market trading at equilibrium.
- 📈 Slightly Overbought (+0.5 to +1.5) → Initial signs of market strength.
- 📈 Moderately Overbought (+1.5 to +2) → Market heating up, caution warranted, selling interest may emerge.
- 📈 Strongly Overbought (+2 and above) → Extreme valuation, increased risk of correction.
This classification helps traders gauge overall market sentiment and make better allocation decisions.
Note: Past valuations and buy/sell signals generated by Sentival do not guarantee future performance. Market conditions can change, and proper risk management should always be applied.
____
5. Use Cases & Applications
🔹 📊 Market Rotation & Asset Allocation
- Used as a valuation model to determine if a market or asset is undervalued or overvalued.
- Rotational strategies can benefit from the valuation score by switching exposure between assets.
🔹 📈 Medium-Term Trend Identification
- Detects overbought and oversold conditions while filtering out short-term noise.
- Can be combined with other trend-following indicators for confluence-based strategies.
🔹 🔄 Mean Reversion & Momentum Trading
- Provides statistical validation for momentum breakouts or mean reversion signals.
- Useful for long-short trading strategies, determining optimal entry & exit points.
____
Conclusion
Sentival is a powerful universal valuation system for traders and investors seeking a data-driven, multi-factor approach to market valuation. With its combination of momentum, trend, risk-adjusted, and mean-reversion indicators, it provides a robust, adaptable, and statistically sound framework for making informed market decisions.
🔹 Who Should Use Sentival?
✅ Swing Traders & Medium-Term Investors looking for structured valuation metrics.
✅ Quantitative & Systematic Traders incorporating multi-factor models.
✅ Portfolio Managers optimizing exposure to different market regimes.
🔹 Disclaimer: Past performance is not indicative of future results. No trading strategy can guarantee success in financial markets.
🔹 Strategic Advice: Always backtest, optimize, and align parameters with your trading objectives and risk tolerance before live trading.
