RSI_Heikinashi📜 Title:
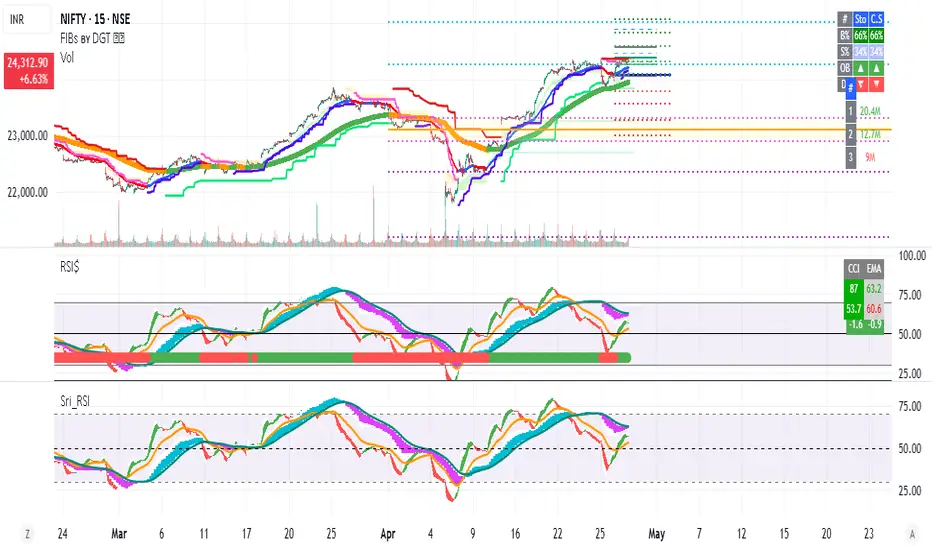
Heikin-Ashi RSI Candle Plot with Multi-Timeframe Analysis and EMA Overlay
📖 Full Description:
This is an original custom indicator that transforms the traditional Relative Strength Index (RSI) into a Heikin-Ashi (HA) candle representation, allowing traders to visualize RSI trends with greater clarity, less noise, and multi-timeframe perspective.
🛠️ Core Concept and Original Method:
Rather than plotting a single RSI line, this script recalculates RSI into a Heikin-Ashi candle format, using a double EMA smoothing method on the RSI data itself.
Here's how the transformation works:
RSI Calculation:
RSI is computed traditionally using Wilder's Moving Average (RMA) for smoothing gains and losses.
The RSI period and price source are fully customizable (default length = 28, source = close).
Heikin-Ashi Style Smoothing (applied to RSI):
The HA Close is calculated as the EMA of the average between the current RSI and previous HA Close.
The HA Open is calculated as the EMA of the average between the previous HA Open and the current HA Close.
The HA High and HA Low are dynamically calculated based on the maximum/minimum values of the current RSI, HA Open, and HA Close.
Smoothing is done via 5-period EMA, which adds a unique layer of trend smoothing without traditional price-based HA calculation.
Multi-Timeframe Comparison:
In addition to plotting the chart timeframe HA RSI, the indicator retrieves the 1-hour timeframe HA RSI using request.security.
This allows traders to align trades with higher timeframe RSI trends, a powerful technique for multi-timeframe confirmation.
50 EMA Overlay:
A 50-period Exponential Moving Average (EMA) is plotted over both the chart timeframe HA RSI and the 1-hour HA RSI.
EMA acts as a trend filter or dynamic support/resistance for RSI behavior.
RSI Bands and Visual Aids:
Standard RSI bands at 70 (Overbought), 50 (Midline), and 30 (Oversold) are plotted.
A shaded background between the 30–70 levels helps highlight RSI range-bound movements versus breakout momentum.
🔥 Why this script is original and useful:
Unique Application:
This is not a simple RSI plot or standard Heikin-Ashi candle — it is a specialized smoothing method applied directly to RSI values for a clearer, noise-reduced momentum reading.
Multi-Timeframe Advantage:
Unlike typical RSI indicators, it includes a 1-hour timeframe comparison alongside the chart timeframe, improving decision-making across intraday and swing strategies.
Advanced Smoothing Logic:
Double EMA smoothing of RSI and HA-style recalculations offer a much smoother signal than traditional RSI or basic RSI/EMA crossovers.
Visualized Trend Strength:
Using colored candles instead of just a line enhances readability and gives an intuitive sense of momentum direction, strength, and possible reversals.
Fully Customizable:
Traders can adjust the RSI period and source depending on asset volatility or timeframe preferences.
📋 How to Use:
Look for HA RSI candles color changes for early momentum shifts.
Use the 50 EMA crossovers on HA RSI to confirm larger trend changes.
Compare chart timeframe vs 1H timeframe HA RSI for stronger signal alignment.
Watch for overbought/oversold breaks beyond the 70/30 bands for trade entries or exits.
⚙️ Inputs:
RSI Length (Default: 28)
RSI Source (Default: Close)
📢 Important Note:
This script is originally conceptualized and custom-built.
It is not a mashup of existing open-source indicators and introduces a new smoothing technique for RSI visualization.
🙏 Credits:
Script developed by Sri_RSI.
在脚本中搜索"Heikin Ashi"
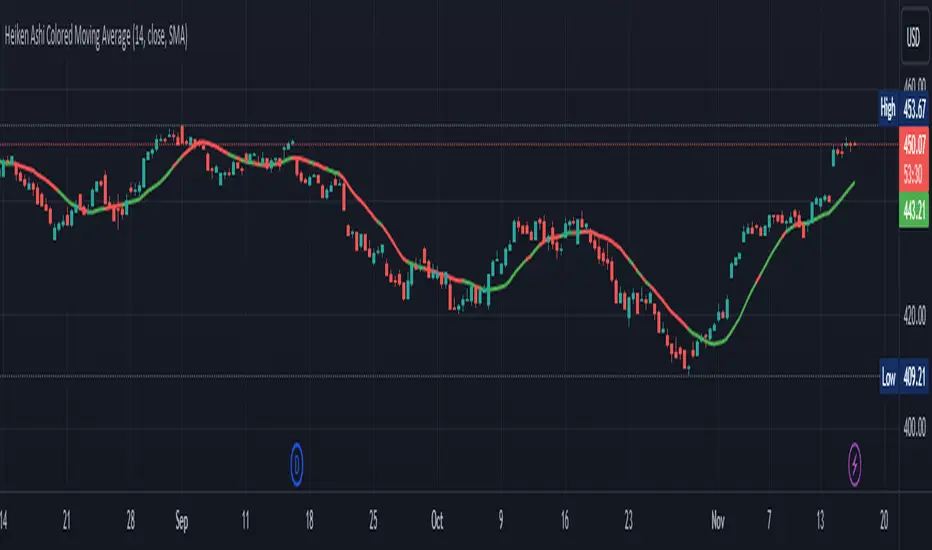
Heiken Ashi Colored Moving AverageThis indicator is meant to plot a moving average but the color of the moving average will change based on Heikin Ashi. Its seems to be slightly off, I would love any suggestions on improving this indicator.
Thanks
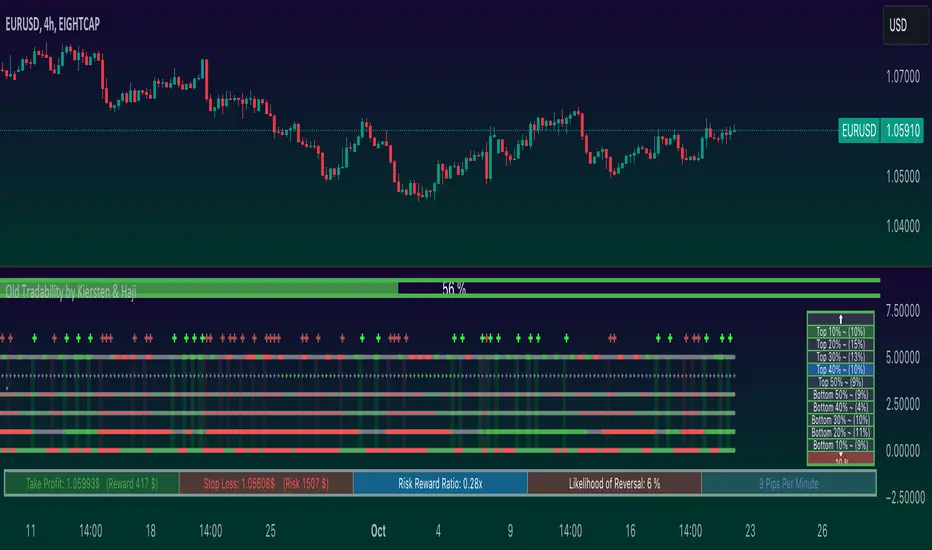
Old Tradability by Kiersten & HajiIntroduction:
The "Old Tradability" is a meticulously crafted indicator designed exclusively for TradingView users. It brings together the power of various well-respected indicators, offering traders a comprehensive tool to gauge market conditions and make informed decisions. Whether you're a novice trader looking for a reliable indicator or a seasoned professional seeking to add another layer to your analytical toolbox, Old Tradability is tailored to provide actionable insights.
Core Features:
Dual Level Analysis:
Long-Term Trend Analysis: At its core, Old Tradability emphasizes the identification of prevailing long-term market trends. To achieve this, it leverages the capabilities of some of the most recognized indicators in the trading world, such as:
MACD (Moving Average Convergence Divergence): Known for its reliability in spotting trend changes and momentum.
MFI (Money Flow Index): A valuable tool to evaluate the flow of money into and out of an asset, often used to predict overbought or oversold conditions.
Heikin Ashi: A unique form of candlestick charting that filters market noise, helping traders understand the market sentiment and trend direction more clearly.
Short-Term Analysis Using MinMax Normalization: The indicator doesn't stop at just identifying the long-term trend. Recognizing the importance of short-term price movements, Old Tradability applies MinMax Normalization on shorter time frames. This technique adjusts the scale of data, making it easier to spot potential reversals or continuation patterns.
Strategic Trading Recommendations:
The principle is simple yet effective. When the long-term trend is bullish and the short-term analysis places the asset in the bottom 20%, it presents a potential buying opportunity. Conversely, if the long-term trend is bearish and the short-term places the asset in the top 20%, traders might consider it as a selling signal.
Integrated Risk Management Alerts:
One of the standout features of Old Tradability is its built-in risk management system. This feature ensures that traders are not only informed about potential trade setups but also about the inherent risks associated.
The system sends out timely alerts for what it deems as "perfect setups," allowing traders to act swiftly and decisively. This minimizes the chance of missing out on lucrative trades while also providing an extra layer of security by notifying users about unfavorable conditions.
Conclusion:
The Old Tradability Indicator is more than just a tool; it's a comprehensive trading companion. Its dual-level analysis ensures that traders have a holistic view of the market, while its integrated risk management alerts keep them one step ahead. If you're looking for a dependable, detailed, and actionable indicator on TradingView, Old Tradability might just be the perfect addition to your trading strategy. Happy trading!
HeikinAshi / MS-Signal (HA-MS)Hello?
Traders, welcome.
If you "Follow", you can always get new information quickly.
Please also click "Boost".
Have a good day.
-------------------------------------
I would like to take the time to explain the indicators needed for trading among the two indicator formulas previously disclosed.
The HA-MS indicator is an indicator created using the Heikin Ashi formula and the MACD formula.
Therefore, the reliability of the indicator is considered to be high.
If you want a comprehensive indicator, you can share the chart being published as an idea and use the MRHAB-T indicator.
The shared indicators can be used without any restrictions if you are a paid member of TradingView.
(Free members have many restrictions on sharing charts.)
The MS-Signal indicator using MACD is an indicator composed of M-Signal and S-Signal lines.
I made it possible to display the M-Signal line of the 1D, 1W, and 1M charts separately so that the trend can be checked on other timeframe charts.
Therefore, by looking at the 15m chart or 1h chart to check the overall trend when trading, we prevented getting caught up in temporary volatility, that is, a whipsaw, and made this M-Signal line to be used as support and resistance.
If you touch these M-Signal lines when a surge or plunge occurs, it means that there is a high possibility of indicating support or resistance.
If the 5EMA line on the 1D chart rises above the 5EMA line enough to be called a soaring moving average, it means that there is a high possibility of a sudden movement.
Therefore, the 5EMA line of the 1D chart is displayed separately so that it can be checked in time frames other than 1D (15m, 1h charts, etc.).
This 5EMA line can also be used as support and resistance like the M-Signal line of the 1D, 1W, and 1M charts described above.
The MS-Signal indicator is for viewing trends.
So, if the price stays above the MS-Signal indicator and the MS-Signal indicator turns into a bullish sign, it means that the uptrend is likely to continue.
Conversely, if the price stays below the MS-Signal indicator and the MS-Signal indicator turns to a bearish sign, then the downtrend is likely to continue.
Therefore, even if it temporarily rises above the MS-Signal indicator, it cannot be said that it will show an uptrend unless it is converted to an uptrend.
So, when the price surges and rises above the MS-Signal indicator, it is important to hold the price until the MS-Signal indicator turns into an uptrend.
If the HA-Low line or HA-High line is passing through these movements, you should respond by looking at whether you are supported or resisted on these lines.
The HA-Low line and the HA-High line are lines created for trading using Heikin Ashi candles.
Therefore, it can be interpreted that if it is supported by the HA-Low or HA-High line, it is highly likely to show an uptrend.
However, since the HA-Low and HA-High lines are calculated together with the RSI indicator, they are displayed on the chart as interactions.
The HA-Low line is a line created near the low point,
The HA-High line is a line created near the high point.
Therefore, if it shows support at the HA-Low line, it is time to buy.
And, if the price rises and rises above the HA-High line, it is likely to show a sharp movement.
Because of this movement, the HA-Low line is called the buy line, and the HA-High line is called the soaring line.
Since the HA-High line is a soaring line, if it is resisted by the HA-High line, it also means that there is a high possibility of a sharp decline.
If you see support at the HA-High line, you can buy it, but as I said, it is a sharp rise line, so you have to respond from a short-term perspective.
The Heikin Ashi body indicator is significant as it marks the first trend reversal.
So, you can see the first reversal move, either when the price first makes a move from a downtrend to an uptrend, or when the price first makes a move from an uptrend to a downtrend.
For example, if the price is in a downtrend and stops falling and moves sideways or rises slightly, the Heikin Ashi body indicator is likely to turn into an uptrend.
If this turns into a bullish sign, aggressive buying is possible.
However, since there is a high possibility that it will not rise higher and fall immediately, it is better to think of a trading strategy when it shows support by rising above the 5EMA line, HA-Low line, and MS-Signal indicator.
Let's assume that from an uptrend in price, the Heikin Ashi body indicator turns to a downtrend.
Then, if you touch the 5EMA line, the HA-High line, and the MS_Signal indicator, I think you can buy some time to think about a selling strategy.
-------------------------------------------------- -
It doesn't matter how you trade and what tools you use.
What matters is whether you can create a trading strategy.
We tend to spend more time on analysis like chart analysis, economic analysis.
Also, many analytical techniques are studied to do this kind of analysis.
I have spent a lot of time studying various analysis techniques and putting a lot of effort into using them in trading.
However, I realized that acquiring all of these things did not make me a good trader.
The indicators released today also do not mean much in reality.
It merely provides minimal information for creating a trading strategy.
I think it is better to put aside the idea of investing a lot of time in chart analysis and economic analysis and proceeding with trading.
Instead, I recommend spending a lot of time thinking about how to buy at the point or section you are trading, how to sell if the price rises, and how to stop loss if the price falls.
Quickly learn that learning difficult analytical techniques doesn't make you profitable on your trades.
I hope you understand.
An analytical technique or tool that allows you to earn a steady income is the best technique.
Creating a trading strategy is not difficult.
It's just that it feels difficult because I haven't organized my thoughts until now.
trading strategy
1. Investment period
2. Investment scale
3. Trading method and profit realization method
You just need to think in order and then start trading.
The most important thing in this trading strategy is the investment period.
The most important thing is whether to trade the coin (token) you want to trade by investing for a period such as the same day, short term, mid term, or long term.
This is because even though this first button is not connected properly, the following fund management and trading methods are all wrong.
I hope the day will come soon when you can play with the movement of the chart and get away from wrestling with the chart.
thank you.
---------------------------------

[jav] HeikinAshized OscillatorsThis script allows to HeikinAshize different commonly used centered oscillators.
It plots them like Heikin Ashi candles. In this way, we can eliminate some of the noise and uncertainty that is inherent to applying only one calculation period to the oscillators.
Applying Heikin Ashi to an oscillator might be advantageous compared to applying it directly to the chart, because you are not altering price readings. The obvious advantage is the clear visualization of the trend directions without noise.
INPUTS
The oscillators included are:
Relative Strength Index (RSI)
Stochastic
Stochastic RSI
Fisher transform
Inverse Fisher Transform of RSI (IFTRSI)
Commodity Channel Index (CCI)
Money Flow Index (MFI)
Chande Momentum Oscillator (CMO)
Momentum (MOM)
True Strength Index (TSI)
Williams' Percent Range (WPR).
Apart from the choice of one of these indicators, only two more inputs are required:
the main (median) period and
the % of variability of this period.
RESULTS
The script calculates 4 evenly spaced periods from that data (period and variability), e.g. for a period of 50 and a variability of 30%, the script calculates oscillator values for 4 different periods evenly spaced around 50, (35, 45, 55, 65) and uses these 4 values to draw the Heikin Ashi candle.
The script also plots the usual upper/lower (overbought/oversold) values, as well as the central line.
CREDITS
The interesting concept of applying Heikin Ashi to an oscillator was recently introduced in Tradingview by @JayRogers . Many thanks for the idea.
For Heikin Ashi calculations, the useful script by @allanster was taken as a reference.
Any improvements, modifications or suggestions are welcome.

Victoria Overlay - HTF 200 + VWAP + ATR Stop + MA TrioConsolidated road to minions
Buy Setup:
EMA1 crosses above SMA3.
RSI confirms above 50.
Volume increasing (confirming momentum).
Candle closes above SMA1 base.
Sell Setup:
EMA1 crosses below SMA3.
RSI drops below 50 or exits overbought.
Volume confirms (declining or reversing).
Candle closes below SMA1 base.
Tips:
Think of EMA1 as the scalper’s trigger.
SMA3 is your momentum check.
SMA1 (base) = short-term bias.
Avoid entries during low-volume chop.
Use for day trades or tight scalps; exits happen fast.
Overlay (Smoothed Heikin Ashi + Swing + VWAP + ATR Stop + 200-SMA)
Purpose: Multi-layer trend confirmation + clean structure.
Type: Swing alignment tool.
🟩 BUY / CALL Conditions
Green “Buy (Gated)” arrow appears.
Price is above VWAP, above 200-SMA, and above ATR stop.
ATR stop (green line) sits under price → support confirmed.
Heikin-Ashi candles are green/lime.
Bias label says “Above VWAP | Above 200 | Swing Up”.
🟥 SELL / PUT Conditions
Red “Sell (Gated)” arrow appears.
Price is below VWAP, below 200-SMA, and below ATR stop.
ATR stop (red line) sits above price → resistance confirmed.
Heikin-Ashi candles are red.
Bias label says “Below VWAP | Below 200 | Swing Down”.
Exit / Risk Control:
Close position when price crosses ATR stop.
If Heikin candles flip color, momentum is reversing.
Best Use Cases:
For next-day or multi-hour swing entries.
Use ATR Stop for dynamic stop loss.
Stay out when the bias label is mixed (e.g. “Above VWAP | Below 200 | Swing Down”).
Pro Tip:
On big news days, let VWAP reset post-open before acting on arrows — filters fake signals.
RSI Panel Pro (v6)
Purpose: Strength + exhaustion confirmation.
Type: Momentum filter.
Key Levels:
Overbought: 80+ → take profits soon.
Oversold: 20– → watch for bounce setups.
Bull regime: RSI above 60 = momentum strong.
Bear regime: RSI below 40 = weakness.
Buy / Entry Signals:
RSI crosses up from below 40 or 20.
RSI line is above RSI-EMA (gray line).
Higher timeframe RSI (if used) is also rising.
Trim / Exit:
RSI drops under 60 after being strong.
RSI crosses below its EMA.
Sell / Put Setup:
RSI fails at 60 or drops below 40.
RSI crosses under EMA after a bounce.
Tips:
Pair RSI panel with Victoria Overlay — only take gated buys when RSI confirms.
RSI < 40 but above 20 = “loading zone” for reversals.
RSI > 70 = overextended → wait for confirmation before entering.
Combined Execution Rules
Goal What to Watch Action
Entry (CALL) EMA1 > SMA3, Buy (Gated) arrow, RSI rising > 50 Buy call / open long
Entry (PUT) EMA1 < SMA3, Sell (Gated) arrow, RSI < 50 Buy put / open short
Exit Early Price crosses ATR stop or RSI flips under EMA Exit trade / protect gains
Trend Filter VWAP + 200-SMA alignment Only trade in that direction
Avoid Trades Conflicting bias label or low volume Stay flat
Pro Tips
VWAP → Intraday mean: above = bullish control, below = bearish control.
ATR Stop → Dynamic trailing stop: never widen it manually.
Smoothed Heikin-Ashi → filters noise: trend stays until color flips twice.
RSI Panel → confirms whether to hold through pullbacks.
If RSI and Overlay disagree — wait, not trade.

Heikin FlowHeikin Flow
by Ben Deharde, 2025
Overview
Heikin Flow is a trend and momentum oscillator built on a smoothed reverse-Heikin-Ashi baseline. It quantifies the distance between price and this baseline, then colors the histogram to reflect both direction and acceleration/deceleration. Use it standalone to read trend energy and shifts, or pair it with Heikin Rider for momentum-aware breakout confirmation.
What It Does
Computes a reverse-HA baseline and optionally smooths it with a selectable MA.
Plots a histogram of distance (price minus baseline) to visualize directional pressure.
Colors the histogram by trend state (above/below baseline) and momentum (accelerating vs. decelerating).
Provides alerts on zero-line crosses to spotlight potential momentum regime changes.
The histogram also helps to spot divergence between price and momentum (e.g., price making new highs while the histogram weakens).
How It Works
Reverse-HA Baseline
Heikin Flow derives a “reverse close” value from Heikin Ashi context (using prior HA open/close with current bar range) to capture underlying pressure. This value is range-bounded to avoid extremes, then optionally smoothed. The resulting line acts as a soft directional baseline.
Smoothing (Noise Control)
Choose SMA/EMA/HMA/VWMA/RMA and a length to control baseline responsiveness. Shorter lengths react faster, longer lengths emphasize trend consistency by filtering noise—useful when pairing with breakout tools like Rider.
Trend & Momentum Logic
Trend: If price is above the baseline, the environment is considered uptrend; below indicates downtrend.
Momentum: The change in distance bar-to-bar distinguishes acceleration (growing distance) from deceleration (shrinking distance).
This dual readout helps you see not just direction, but the quality of that direction—strong push vs. weakening move.
Coloring (Aligned with Heikin Rider Palette)
Deep Blue: Uptrend & accelerating
Light Blue: Uptrend & decelerating
Deep Red: Downtrend & accelerating
Soft Orange: Downtrend & decelerating
This mirrors the palette logic from Heikin Rider for immediate visual consistency across the suite.
How to use
Read the histogram above/below zero (price–baseline) as directional bias; watch color changes for momentum context.
Use zero-line crosses as momentum regime shifts; confirm with price action or Heikin Rider breakout signals.
Watch for divergence between price action and the histogram as an early clue of weakening moves.
Adjust smoothing method/length to fit your market and timeframe—faster for scalping, slower to highlight sustained trends.
Inputs
Smoothing Type & Length for the baseline (SMA/EMA/HMA/VWMA/RMA)
Info Box toggles (display and formatting)
Live Mode option for real-time vs. confirmed-bar behavior (avoids inadvertent lookahead)
Originality
Heikin Flow adapts the HA-driven methodology to an oscillator that focuses on distance-to-baseline and momentum quality, using a reverse-HA construction and flexible MA smoothing—complementing Heikin Rider’s smoothed HA envelope breakout design for a cohesive, momentum-aware workflow.
Alerts
Bullish Heikin Flow Cross — distance crosses above 0 (on bar close)
Bearish Heikin Flow Cross — distance crosses below 0 (on bar close)

Enhanced Buy/Sell Pressure, Volume, and Trend Bar analysisEnhanced Buy/Sell Pressure, Volume, and Trend Bar Analysis Indicator
Overview
This indicator is designed to help traders identify buy and sell pressure, volume changes, and overall trend direction in the market. It combines multiple concepts like price action, volume, and trend analysis, candlestick anaysis to provide a comprehensive view of market dynamics. The visual elements are intuitive, making it suitable for traders at different levels. This indicator works together with Enhanced Pressure MTF Screener which is a screener based of this indicator to make it easier to see Bullish/Bearish pressures and trend across multiple timeframes.
Image below: is the Enhanced Buy/Sell Pressure, Volume, and Trend Bar Analysis with the Enhanced Pressure MTF Screener indicator both active together.
Key Features
1.Buy/Sell Pressure Identification
Buy Pressure: Calculated based on price movement where the close price is higher than the opening price.
Sell Pressure: Calculated when the closing price is equal to or lower than the opening price.These pressures help you understand whether buyers or sellers are more dominant for each bar.
2.Volume Analysis
Normalized Volume: Volume data is normalized, making it easier to compare volume levels over different periods.
Volume Histogram: The volume is also presented as a histogram for easy visualization, showing whether the current volume is higher or lower compared to the average.
3.Simplified Coloring Option
You can choose to simplify the coloring of bars to reflect the dominant pressure: green for bullish pressure and red for bearish pressure. This makes it visually easier to identify who is in control. When simplified coloring is disabled, the bars' colors will represent the combined effect of buy and sell pressure.
4.Heikin-Ashi Candles for Pressure Calculation
The indicator includes an option to use Heikin-Ashi candles instead of traditional candles to calculate buy and sell pressure. Heikin-Ashi candles are known for smoothing out price action and providing a clearer trend representation.
5.Trend Background Coloring
This feature uses exponential moving averages (EMAs) to determine the trend:
Short-Term EMA vs. Long-Term EMA: When the short-term EMA is above the long-term EMA, the trend is considered bullish, and vice versa.
The background color changes based on the identified trend: green for an uptrend and red for a downtrend. This feature helps visualize the overall market direction at a glance.
6.Signals for Key Price Actions
The indicator plots various symbols to signal important price movements:
Bullish Close (▲): Indicates a strong upward movement where the close price crosses above the open.
Bearish Close (▼): Indicates a downward movement where the close price falls below the open.
Higher High (•): Highlights new highs compared to previous bars, useful for confirming an uptrend.
Lower Low (•): Highlights lower lows compared to previous bars, which can indicate a downtrend or bearish pressure.
Calculations Explained
1.Buy and Sell Pressure Calculation
The buy pressure is determined by the price range (high - low) if the closing price is above the opening price, indicating an increase in value.
The sell pressure is similarly calculated when the closing price is equal to or below the opening price.
The indicator uses the Average True Range (ATR) for normalization. Normalizing helps you compare pressure across different periods, regardless of market volatility.
2.Volume Normalization
Volume Normalization: To make volume comparable across different periods, the indicator normalizes it using the Simple Moving Average (SMA) of volume over a user-defined length.
Volume Histogram: The histogram provides a clear representation of volume changes compared to the average, making it easier to spot unusual activity that may indicate market shifts.
3.Combined Pressure Calculation
The indicator calculates a combined pressure value by subtracting sell pressure from buy pressure.
When combined pressure is positive, buying is dominant, and when negative, selling is dominant. This helps in visually understanding the ongoing momentum.
4.Trend Calculation
The indicator uses two EMAs to determine the trend:
Short-Term EMA (default 14-period) to capture recent price movements.
Long-Term EMA (default 50-period) to provide a broader trend perspective.
By comparing these EMAs on a higher timeframe, the indicator can identify whether the trend is up or down, making it easier for traders to align their trades with the larger market movement.
Inputs and Customization
The indicator provides several options for customization, allowing you to adjust it to your preferences:
SMA Length: Determines the lookback period for moving averages and volume normalization. A longer length provides more smoothing, whereas a shorter length makes the indicator more responsive.
Buy/Sell/Volume Colors: Customize the colors used to represent buying, selling, and volume to suit your preferences.
Heikin Ashi Option: Toggle between using Heikin Ashi or traditional OHLC (Open-High-Low-Close) candles for pressure calculations.
Trend Timeframe and EMA Periods: You can choose different timeframes and EMA periods for trend analysis to suit your trading strategy.
How to Use This Indicator
Identifying Market Momentum: Use the buy/sell pressure columns to see which side (buyers or sellers) is in control. Positive pressure combined with green color indicates strong buying, while red indicates selling.
Volume Confirmation: Check the volume area plot and histogram. High volume coupled with strong pressure is a sign of conviction, meaning the current move has backing from market participants.
Trend Identification: The trend background color helps identify the overall trend direction. Trade in the direction of the trend (e.g., take long positions during a green background).
Signal Indicators: The plotted symbols like "Bullish Close" and "Bearish Close" provide visual signals of key price actions, useful for timing entry or exit points.
Practical use Example
Scenario: The market is consolidating, and you see alternating green and red bars.
Action: Wait for a consistent sequence of green bars (buy pressure) along with a green background (uptrend) to consider going long, although you can go long without having a green background, the background adds confirmation layer.
Scenario: The market has several bearish closes (red ▼ symbols) accompanied by increasing volume.
Action: This could indicate strong selling pressure. If the background also turns red, it might be a good time to exit long positions or consider shorting.
Higher timeframe pressure and volume: Another way to use the indicator is to check buy/sell volume and pressure of the higher timeframe say weekly or daily or any timeframe you consider higher, once you’ve identified or feel confident in which direction the bar is going along with the full picture of trend, you can go to the lower timeframe and wait for it to sync with the higher timeframe to consider a long or a short. It is also easier to see when markets sync up by also applying the Enhanced Pressure MTF Screener which works in companion to this indicator.
Visual Cues and Interpretation
Combined Pressure Plot: The green and red column plot at the bottom of the chart represents the dominance between buying and selling. Tall green bars signify strong buying, while tall red bars indicate selling dominance.
Trend Background: Helps visualize the overall direction without manually drawing trend lines. When the background turns green, it generally indicates that the shorter-term moving average has crossed above the longer-term average—a sign of a bullish trend.
To Summarize shortly
The Enhanced Buy/Sell Pressure, Volume, and Trend Bar Analysis Indicator is an advanced but simple tool designed to help traders visually understand market dynamics. It combines different aspects of market analysis of candle pressure from buyers and sellers, volume confirmation, and trend identification into a single view, which can assist both new and experienced traders in making informed trading decisions.
This indicator:
Saves time by simplifying market analysis.
Provides clear visual cues for buy/sell pressure, volume, and trend.
Offers customizable settings to suit individual trading styles.
Always, I am happy to share my creations with you all for free. If you guys have cool ideas you would like to share, or suggestions for improvements the comment is below and I hope this overview gave an idea of how to use the indicator :D

New Age MACD █ NEW AGE MACD 🚀
It's 2025. We're still using indicators from the 90s... but who says they have to LOOK like the 90s? 😎
Traders deserve beautiful tools. Clean aesthetics. Modern vibes. Welcome to the New Age.
Based on CM_MacD_Ult_MTF by ChrisMoody - now reimagined with stunning neon visuals, dynamic glow effects, and an interface that actually looks good on your chart.
Same powerful MACD logic. Fresh new drip. ✨
█ FEATURES ✨
🔮 Neon Line Glow - MACD line glows dynamically based on trend
⚡ Multi-Timeframe - View any timeframe MACD on your current chart
🎯 4-Color Histogram - Gradient colors show momentum strength
🔀 Smart Fill - Beautiful fill between MACD & Signal
🔵 Cross Markers - Visual dots at bullish/bearish crossovers
📋 Elegant Dashboard - Real-time stats with cyan frame design
█ GLOW EFFECT ✨
The signature feature - a beautiful neon glow surrounding the MACD line:
💡 5 transparent layers create a smooth gradient glow
💡 Color follows trend direction automatically
💡 No chart scaling issues - glow follows the line perfectly
🟢 MACD > Signal → Cyan neon glow
🔴 MACD < Signal → Red neon glow
█ HISTOGRAM COLORS 📊
4 colors show momentum state at a glance:
| State | Color | Meaning |
|--------------------|---------------|----------------------|
| Above zero + rising | 🟢 Cyan bright | Strong bullish |
| Above zero + falling| 🟢 Cyan dim | Bullish but fading |
| Below zero + falling| 🔴 Red bright | Strong bearish |
| Below zero + rising | 🔴 Red dim | Bearish but recovering|
█ SIGNALS 🎯
🟢 Bull Cross → MACD crosses above Signal line
🔴 Bear Cross → MACD crosses below Signal line
🟢 Above Zero → MACD crosses above zero line
🔴 Below Zero → MACD crosses below zero line
█ SOURCE SETTINGS ⚙️
Choose the correct source for your chart type:
📊 NORMAL CANDLES:
Source: close (default)
✓ Standard closing price
✓ Most accurate readings
📊 HEIKIN ASHI CANDLES:
Source: ohlc4
✓ Formula: (Open + High + Low + Close) / 4
✓ Smoother MACD line
✓ Fewer false signals
💡 Quick Guide:
Normal Candles → close
Heikin Ashi → ohlc4
█ SETTINGS 🛠️
Timeframe:
⏰ Use Current Chart Resolution
🕐 Use Different Timeframe (MTF)
MACD Settings:
📈 Fast Length (default: 12)
📉 Slow Length (default: 26)
📊 Signal Length (default: 9)
Display Options:
📈 Show MACD & Signal Line
🔵 Show Dots at Cross
📊 Show Histogram
🔀 Show Fill Between MACD & Signal
✨ Show MACD Line Glow
🎨 MACD Color Change on Cross
🎨 Histogram 4 Colors
📋 Show Dashboard
█ DASHBOARD 📋
Elegant dark theme with cyan frame:
| Field | Description |
|-----------|------------------------------------|
| Value | Current MACD value |
| Signal | Signal line value |
| Histogram | MACD minus Signal |
| Zone | Strong Bull / Bullish / Bearish / Strong Bear |
| Trend | Bullish / Bearish |
| Momentum | Strong Up / Fading / Recovering / Strong Down |
| Signal | Current crossover status |
█ RECOMMENDED SETTINGS 📈
| Style | Chart | Source | Fast/Slow/Sig |
|------------------|-----------|--------|---------------|
| Scalping | Normal | close | 8 / 17 / 9 |
| Day Trading | Normal | close | 12 / 26 / 9 |
| Swing Trading | Heikin Ashi| ohlc4 | 12 / 26 / 9 |
| Position Trading | Heikin Ashi| ohlc4 | 19 / 39 / 9 |
█ ALERTS 🔔
🟢 MACD Bullish Cross
🔴 MACD Bearish Cross
🟢 MACD Above Zero
🔴 MACD Below Zero
█ USAGE TIPS 💡
📈 Quick Trend: Look at glow color for instant trend read
📊 Momentum: Watch histogram color transitions
🔍 Divergence: Compare price action with MACD peaks
⏰ Confluence: Use MTF for higher timeframe confirmation
█ COLOR SCHEME 🎨
| Element | Bullish | Bearish |
|------------|-----------|-----------|
| MACD Line | 🔵 Cyan | 🔴 Red |
| Glow | 🔵 Cyan | 🔴 Red |
| Histogram | 🔵 Cyan | 🔴 Red |
| Fill | 🔵 Cyan | 🔴 Red |
| Signal | ⚪ White | ⚪ White |
| Dashboard | 🔵 Cyan frame | 🔵 Cyan frame |
█ CREDITS 👏
Original concept: CM_MacD_Ult_MTF by ChrisMoody
Enhanced version: New Age MACD by RadisaBTC
If you find this indicator useful, please leave a 👍 and follow for more updates!
Because good trading deserves good design. 💎
Happy Trading! 🚀📈

Grok/Claude Turtle Soup Alert SystemReplaces previous Turtle Soup Strategy/Indicator as Tradingview will not let me update it.
# 🥣 Turtle Soup Strategy (Enhanced)
## A Mean-Reversion Strategy Based on Failed Breakouts
---
## Historical Origins
### The Original Turtle Traders (1983-1988)
The Turtle Trading system is one of the most famous experiments in trading history. In 1983, legendary commodities trader **Richard Dennis** made a bet with his partner **William Eckhardt** about whether great traders were born or made. Dennis believed trading could be taught; Eckhardt believed it was innate.
To settle the debate, Dennis recruited 23 ordinary people through newspaper ads—including a professional blackjack player, a fantasy game designer, and an accountant—and taught them his trading system in just two weeks. He called them "Turtles" after turtle farms he had visited in Singapore, saying *"We are going to grow traders just like they grow turtles in Singapore."*
The results were extraordinary. Over the next five years, the Turtles reportedly earned over **$175 million in profits**. The experiment proved Dennis right: trading could indeed be taught.
#### The Original Turtle Rules:
- **Entry:** Buy when price breaks above the 20-day high (System 1) or 55-day high (System 2)
- **Exit:** Sell when price breaks below the 10-day low (System 1) or 20-day low (System 2)
- **Stop Loss:** 2x ATR (Average True Range) from entry
- **Position Sizing:** Based on volatility (ATR)
- **Philosophy:** Pure trend-following—catch big moves by riding breakouts
The Turtle system was a **trend-following** strategy that assumed breakouts would lead to sustained trends. It worked brilliantly in trending markets but suffered during choppy, range-bound conditions.
---
### The Turtle Soup Strategy (1990s)
In the 1990s, renowned trader **Linda Bradford Raschke** (along with Larry Connors) observed something interesting: many of the breakouts that the Turtle system traded actually *failed*. Price would spike above the 20-day high, trigger Turtle buy orders, then immediately reverse—trapping the breakout traders.
Raschke realized these failed breakouts were predictable and tradeable. She developed the **Turtle Soup** strategy, which does the *exact opposite* of the original Turtle system:
> *"Instead of buying the breakout, we wait for it to fail—then fade it."*
The name "Turtle Soup" is a clever play on words: the strategy essentially "eats" the Turtles by trading against them when their breakouts fail.
#### Original Turtle Soup Rules:
- **Setup:** Price makes a new 20-day high (or low)
- **Qualifier:** The previous 20-day high must be at least 3-4 days old (not a fresh breakout)
- **Entry Trigger:** Price reverses back inside the channel (failed breakout)
- **Entry:** Go SHORT (against the failed breakout above), or LONG (against the failed breakdown below)
- **Philosophy:** Mean-reversion—fade false breakouts and profit from trapped traders
#### Turtle Soup Plus One Variant:
Raschke also developed a more conservative variant called "Turtle Soup Plus One" which waits for the *next bar* after the breakout to confirm the failure before entering. This reduces false signals but may miss some opportunities.
---
## Our Enhanced Turtle Soup Strategy
We have taken the classic Turtle Soup concept and enhanced it with modern technical indicators and filters to improve signal quality and adapt to today's markets.
### Core Logic Preserved
The fundamental strategy remains true to Raschke's original concept:
| Turtle (Original) | Turtle Soup (Our Strategy) |
|-------------------|---------------------------|
| BUY breakout above 20-day high | SHORT when that breakout FAILS |
| SELL breakout below 20-day low | LONG when that breakdown FAILS |
| Trend-following | Mean-reversion |
| "The trend is your friend" | "Failed breakouts trap traders" |
---
### Enhancements & Improvements
#### 1. RSI Exhaustion Filter
**Addition:** RSI must confirm exhaustion before entry
- **For SHORT entries:** RSI > 60 (buyers exhausted)
- **For LONG entries:** RSI < 40 (sellers exhausted)
**Why:** The original Turtle Soup had no momentum filter. Adding RSI ensures we only fade breakouts when the market is showing signs of exhaustion, significantly reducing false signals. This enhancement was inspired by later traders who found RSI extremes (originally 90/10, softened to 60/40) dramatically improved win rates.
#### 2. ADX Trending Filter
**Addition:** ADX must be > 20 for trades to execute
**Why:** While the original Turtle Soup was designed for ranging markets, we found that requiring *some* trend strength (ADX > 20) actually improves results. This ensures we're trading in markets with enough directional movement to create meaningful failed breakouts, rather than random noise in dead markets.
#### 3. Heikin Ashi Smoothing
**Addition:** Optional Heikin Ashi calculations for breakout detection
**Why:** Heikin Ashi candles smooth out price noise and make trend reversals more visible. When enabled, the strategy uses HA values to detect breakouts and failures, reducing whipsaws from erratic price spikes.
#### 4. Dynamic Donchian Channels with Regime Detection
**Addition:** Color-coded channels based on market regime
- 🟢 **Green:** Bullish regime (uptrend + DI+ > DI- + OBV bullish)
- 🔴 **Red:** Bearish regime (downtrend + DI- > DI+ + OBV bearish)
- 🟡 **Yellow:** Neutral regime
**Why:** Visual regime detection helps traders understand the broader market context. The original Turtle Soup had no regime awareness—our enhancement lets traders see at a glance whether conditions favor the strategy.
#### 5. Volume Spike Detection (Optional)
**Addition:** Optional filter requiring volume surge on the breakout bar
**Why:** Failed breakouts are more significant when they occur on high volume. A volume spike on the breakout bar (default 1.2x average) indicates more traders got trapped, creating stronger reversal potential.
#### 6. ATR-Based Stops and Targets
**Addition:** Configurable ATR-based stop losses and profit targets
- **Stop Loss:** 1.5x ATR (default)
- **Profit Target:** 2.0x ATR (default)
**Why:** The original Turtle Soup used fixed stop placement. ATR-based stops adapt to current volatility, providing tighter stops in calm markets and wider stops in volatile conditions.
#### 7. Signal Cooldown
**Addition:** Minimum bars between trades (default 5)
**Why:** Prevents overtrading during choppy conditions where multiple failed breakouts might occur in quick succession.
#### 8. Real-Time Info Panel
**Addition:** Comprehensive dashboard showing:
- Current regime (Bullish/Bearish/Neutral)
- RSI value and zone
- ADX value and trending status
- Breakout status
- Bars since last high/low
- Current setup status
- Position status
**Why:** Gives traders instant visibility into all strategy conditions without needing to check multiple indicators.
---
## Entry Rules Summary
### SHORT Entry (Fading Failed Breakout Above)
1. ✅ Price breaks ABOVE the 20-period Donchian high
2. ✅ Previous 20-period high was at least 1 bar ago
3. ✅ Price closes back BELOW the Donchian high (failed breakout)
4. ✅ RSI > 60 (exhausted buyers)
5. ✅ ADX > 20 (trending market)
6. ✅ Cooldown period met
→ **Enter SHORT**, betting the breakout will fail
### LONG Entry (Fading Failed Breakdown Below)
1. ✅ Price breaks BELOW the 20-period Donchian low
2. ✅ Previous 20-period low was at least 1 bar ago
3. ✅ Price closes back ABOVE the Donchian low (failed breakdown)
4. ✅ RSI < 40 (exhausted sellers)
5. ✅ ADX > 20 (trending market)
6. ✅ Cooldown period met
→ **Enter LONG**, betting the breakdown will fail
---
## Exit Rules
1. **ATR Stop Loss:** Position closed if price moves 1.5x ATR against entry
2. **ATR Profit Target:** Position closed if price moves 2.0x ATR in favor
3. **Channel Exit:** Position closed if price breaks the exit channel in the opposite direction
4. **Mid-Channel Exit:** Position closed if price returns to channel midpoint
---
## Best Market Conditions
The Turtle Soup strategy performs best when:
- ✅ Markets are prone to false breakouts
- ✅ Volatility is moderate (not too low, not extreme)
- ✅ Price is oscillating within a broader range
- ✅ There are clear support/resistance levels
The strategy may struggle when:
- ❌ Strong trends persist (breakouts follow through)
- ❌ Volatility is extremely low (no meaningful breakouts)
- ❌ Markets are in news-driven directional moves
---
## Default Settings
| Parameter | Default | Description |
|-----------|---------|-------------|
| Lookback Period | 20 | Donchian channel period |
| Min Bars Since Extreme | 1 | Bars since last high/low |
| RSI Length | 14 | RSI calculation period |
| RSI Short Level | 60 | RSI must be above this for shorts |
| RSI Long Level | 40 | RSI must be below this for longs |
| ADX Length | 14 | ADX calculation period |
| ADX Threshold | 20 | Minimum ADX for trades |
| ATR Period | 20 | ATR calculation period |
| ATR Stop Multiplier | 1.5 | Stop loss distance in ATR |
| ATR Target Multiplier | 2.0 | Profit target distance in ATR |
| Cooldown Period | 5 | Minimum bars between trades |
| Volume Multiplier | 1.2 | Volume spike threshold |
---
## Philosophy
> *"The Turtle system made millions by following breakouts. The Turtle Soup strategy makes money when those breakouts fail. In trading, there's always someone on the other side of the trade—this strategy profits by being the smart money that fades the trapped breakout traders."*
The beauty of the Turtle Soup strategy is its elegant simplicity: it exploits a known, repeatable pattern (failed breakouts) while using modern filters (RSI, ADX) to improve timing and reduce false signals.
---
## Credits
- **Original Turtle System:** Richard Dennis & William Eckhardt (1983)
- **Turtle Soup Strategy:** Linda Bradford Raschke & Larry Connors (1990s)
- **RSI Enhancement:** Various traders who discovered RSI extremes improve reversal detection
- **This Implementation:** Enhanced with Heikin Ashi smoothing, regime detection, ADX filtering, and comprehensive visualization
---
*"We're not following the turtles—we're making soup out of them."* 🥣

Grok/Claude Turtle Soup Strategy # 🥣 Turtle Soup Strategy (Enhanced)
## A Mean-Reversion Strategy Based on Failed Breakouts
---
## Historical Origins
### The Original Turtle Traders (1983-1988)
The Turtle Trading system is one of the most famous experiments in trading history. In 1983, legendary commodities trader **Richard Dennis** made a bet with his partner **William Eckhardt** about whether great traders were born or made. Dennis believed trading could be taught; Eckhardt believed it was innate.
To settle the debate, Dennis recruited 23 ordinary people through newspaper ads—including a professional blackjack player, a fantasy game designer, and an accountant—and taught them his trading system in just two weeks. He called them "Turtles" after turtle farms he had visited in Singapore, saying *"We are going to grow traders just like they grow turtles in Singapore."*
The results were extraordinary. Over the next five years, the Turtles reportedly earned over **$175 million in profits**. The experiment proved Dennis right: trading could indeed be taught.
#### The Original Turtle Rules:
- **Entry:** Buy when price breaks above the 20-day high (System 1) or 55-day high (System 2)
- **Exit:** Sell when price breaks below the 10-day low (System 1) or 20-day low (System 2)
- **Stop Loss:** 2x ATR (Average True Range) from entry
- **Position Sizing:** Based on volatility (ATR)
- **Philosophy:** Pure trend-following—catch big moves by riding breakouts
The Turtle system was a **trend-following** strategy that assumed breakouts would lead to sustained trends. It worked brilliantly in trending markets but suffered during choppy, range-bound conditions.
---
### The Turtle Soup Strategy (1990s)
In the 1990s, renowned trader **Linda Bradford Raschke** (along with Larry Connors) observed something interesting: many of the breakouts that the Turtle system traded actually *failed*. Price would spike above the 20-day high, trigger Turtle buy orders, then immediately reverse—trapping the breakout traders.
Raschke realized these failed breakouts were predictable and tradeable. She developed the **Turtle Soup** strategy, which does the *exact opposite* of the original Turtle system:
> *"Instead of buying the breakout, we wait for it to fail—then fade it."*
The name "Turtle Soup" is a clever play on words: the strategy essentially "eats" the Turtles by trading against them when their breakouts fail.
#### Original Turtle Soup Rules:
- **Setup:** Price makes a new 20-day high (or low)
- **Qualifier:** The previous 20-day high must be at least 3-4 days old (not a fresh breakout)
- **Entry Trigger:** Price reverses back inside the channel (failed breakout)
- **Entry:** Go SHORT (against the failed breakout above), or LONG (against the failed breakdown below)
- **Philosophy:** Mean-reversion—fade false breakouts and profit from trapped traders
#### Turtle Soup Plus One Variant:
Raschke also developed a more conservative variant called "Turtle Soup Plus One" which waits for the *next bar* after the breakout to confirm the failure before entering. This reduces false signals but may miss some opportunities.
---
## Our Enhanced Turtle Soup Strategy
We have taken the classic Turtle Soup concept and enhanced it with modern technical indicators and filters to improve signal quality and adapt to today's markets.
### Core Logic Preserved
The fundamental strategy remains true to Raschke's original concept:
| Turtle (Original) | Turtle Soup (Our Strategy) |
|-------------------|---------------------------|
| BUY breakout above 20-day high | SHORT when that breakout FAILS |
| SELL breakout below 20-day low | LONG when that breakdown FAILS |
| Trend-following | Mean-reversion |
| "The trend is your friend" | "Failed breakouts trap traders" |
---
### Enhancements & Improvements
#### 1. RSI Exhaustion Filter
**Addition:** RSI must confirm exhaustion before entry
- **For SHORT entries:** RSI > 60 (buyers exhausted)
- **For LONG entries:** RSI < 40 (sellers exhausted)
**Why:** The original Turtle Soup had no momentum filter. Adding RSI ensures we only fade breakouts when the market is showing signs of exhaustion, significantly reducing false signals. This enhancement was inspired by later traders who found RSI extremes (originally 90/10, softened to 60/40) dramatically improved win rates.
#### 2. ADX Trending Filter
**Addition:** ADX must be > 20 for trades to execute
**Why:** While the original Turtle Soup was designed for ranging markets, we found that requiring *some* trend strength (ADX > 20) actually improves results. This ensures we're trading in markets with enough directional movement to create meaningful failed breakouts, rather than random noise in dead markets.
#### 3. Heikin Ashi Smoothing
**Addition:** Optional Heikin Ashi calculations for breakout detection
**Why:** Heikin Ashi candles smooth out price noise and make trend reversals more visible. When enabled, the strategy uses HA values to detect breakouts and failures, reducing whipsaws from erratic price spikes.
#### 4. Dynamic Donchian Channels with Regime Detection
**Addition:** Color-coded channels based on market regime
- 🟢 **Green:** Bullish regime (uptrend + DI+ > DI- + OBV bullish)
- 🔴 **Red:** Bearish regime (downtrend + DI- > DI+ + OBV bearish)
- 🟡 **Yellow:** Neutral regime
**Why:** Visual regime detection helps traders understand the broader market context. The original Turtle Soup had no regime awareness—our enhancement lets traders see at a glance whether conditions favor the strategy.
#### 5. Volume Spike Detection (Optional)
**Addition:** Optional filter requiring volume surge on the breakout bar
**Why:** Failed breakouts are more significant when they occur on high volume. A volume spike on the breakout bar (default 1.2x average) indicates more traders got trapped, creating stronger reversal potential.
#### 6. ATR-Based Stops and Targets
**Addition:** Configurable ATR-based stop losses and profit targets
- **Stop Loss:** 1.5x ATR (default)
- **Profit Target:** 2.0x ATR (default)
**Why:** The original Turtle Soup used fixed stop placement. ATR-based stops adapt to current volatility, providing tighter stops in calm markets and wider stops in volatile conditions.
#### 7. Signal Cooldown
**Addition:** Minimum bars between trades (default 5)
**Why:** Prevents overtrading during choppy conditions where multiple failed breakouts might occur in quick succession.
#### 8. Real-Time Info Panel
**Addition:** Comprehensive dashboard showing:
- Current regime (Bullish/Bearish/Neutral)
- RSI value and zone
- ADX value and trending status
- Breakout status
- Bars since last high/low
- Current setup status
- Position status
**Why:** Gives traders instant visibility into all strategy conditions without needing to check multiple indicators.
---
## Entry Rules Summary
### SHORT Entry (Fading Failed Breakout Above)
1. ✅ Price breaks ABOVE the 20-period Donchian high
2. ✅ Previous 20-period high was at least 1 bar ago
3. ✅ Price closes back BELOW the Donchian high (failed breakout)
4. ✅ RSI > 60 (exhausted buyers)
5. ✅ ADX > 20 (trending market)
6. ✅ Cooldown period met
→ **Enter SHORT**, betting the breakout will fail
### LONG Entry (Fading Failed Breakdown Below)
1. ✅ Price breaks BELOW the 20-period Donchian low
2. ✅ Previous 20-period low was at least 1 bar ago
3. ✅ Price closes back ABOVE the Donchian low (failed breakdown)
4. ✅ RSI < 40 (exhausted sellers)
5. ✅ ADX > 20 (trending market)
6. ✅ Cooldown period met
→ **Enter LONG**, betting the breakdown will fail
---
## Exit Rules
1. **ATR Stop Loss:** Position closed if price moves 1.5x ATR against entry
2. **ATR Profit Target:** Position closed if price moves 2.0x ATR in favor
3. **Channel Exit:** Position closed if price breaks the exit channel in the opposite direction
4. **Mid-Channel Exit:** Position closed if price returns to channel midpoint
---
## Best Market Conditions
The Turtle Soup strategy performs best when:
- ✅ Markets are prone to false breakouts
- ✅ Volatility is moderate (not too low, not extreme)
- ✅ Price is oscillating within a broader range
- ✅ There are clear support/resistance levels
The strategy may struggle when:
- ❌ Strong trends persist (breakouts follow through)
- ❌ Volatility is extremely low (no meaningful breakouts)
- ❌ Markets are in news-driven directional moves
---
## Default Settings
| Parameter | Default | Description |
|-----------|---------|-------------|
| Lookback Period | 20 | Donchian channel period |
| Min Bars Since Extreme | 1 | Bars since last high/low |
| RSI Length | 14 | RSI calculation period |
| RSI Short Level | 60 | RSI must be above this for shorts |
| RSI Long Level | 40 | RSI must be below this for longs |
| ADX Length | 14 | ADX calculation period |
| ADX Threshold | 20 | Minimum ADX for trades |
| ATR Period | 20 | ATR calculation period |
| ATR Stop Multiplier | 1.5 | Stop loss distance in ATR |
| ATR Target Multiplier | 2.0 | Profit target distance in ATR |
| Cooldown Period | 5 | Minimum bars between trades |
| Volume Multiplier | 1.2 | Volume spike threshold |
---
## Philosophy
> *"The Turtle system made millions by following breakouts. The Turtle Soup strategy makes money when those breakouts fail. In trading, there's always someone on the other side of the trade—this strategy profits by being the smart money that fades the trapped breakout traders."*
The beauty of the Turtle Soup strategy is its elegant simplicity: it exploits a known, repeatable pattern (failed breakouts) while using modern filters (RSI, ADX) to improve timing and reduce false signals.
---
## Credits
- **Original Turtle System:** Richard Dennis & William Eckhardt (1983)
- **Turtle Soup Strategy:** Linda Bradford Raschke & Larry Connors (1990s)
- **RSI Enhancement:** Various traders who discovered RSI extremes improve reversal detection
- **This Implementation:** Enhanced with Heikin Ashi smoothing, regime detection, ADX filtering, and comprehensive visualization
---
*"We're not following the turtles—we're making soup out of them."* 🥣

ZS Master Vision Pro - Advanced Multi-Timeframe Trading SystemZS MASTER VISION PRO - PROFESSIONAL TRADING SUITE
Created by Zakaria Safri
A comprehensive, all-in-one trading system combining multiple proven technical analysis methods into a single, powerful indicator. Designed for traders who demand precision, clarity, and actionable signals across all timeframes.
KEY FEATURES
CORE TREND ALGORITHM
Adaptive ATR-based trend detection with dynamic support and resistance zones. Features Type A and Type B signal modes for different trading styles, strong signal detection in key reversal zones, and optional EMA source smoothing for noise reduction.
MULTI-LAYER EMA CLOUD SYSTEM
Five customizable EMA cloud layers for multi-timeframe analysis with theme-adaptive color coding across five professional themes. Optional line display for detailed MA tracking with configurable periods from scalping to position trading.
WAVE TREND OSCILLATOR
Advanced momentum oscillator with channel-based calculations featuring smart reversal detection at extreme overbought and oversold levels. Includes directional strength confirmation and customizable sensitivity with adjustable reaction periods.
DIVERGENCE SCANNER
Detects four types of divergence automatically:
- Regular Bullish: Price making lower lows while oscillator making higher lows
- Regular Bearish: Price making higher highs while oscillator making lower highs
- Hidden Bullish: Trend continuation signals in uptrends
- Hidden Bearish: Trend continuation signals in downtrends
Automatic fractal-based detection with clear visual labels on chart.
MARKET BIAS INDICATOR
Heikin Ashi-based trend strength analysis with real-time bias calculation showing Bullish or Bearish combined with Strong or Weak conditions. Smoothed for cleaner signals and perfect for trend confirmation.
MOMENTUM SYSTEM
Proprietary momentum calculation using adaptive smoothing with growing and falling state detection. Normalized values for consistent interpretation and responsive to rapid market changes.
DYNAMIC SUPPORT AND RESISTANCE
Automatic pivot-based support and resistance level detection with adjustable left and right bar lookback. Non-repainting levels with visual clarity through color-coded lines.
LIVE INFORMATION DASHBOARD
Real-time market analysis panel displaying current trend direction, market bias based on Heikin Ashi, Wave Trend status and value, and momentum trend with state. Customizable display options with theme-adaptive colors.
VISUAL CUSTOMIZATION
FIVE PROFESSIONAL COLOR THEMES:
Pro - Modern green and red color scheme (default)
Classic - Traditional teal and red combination
Cyberpunk - Neon cyan and magenta contrast
Ocean - Blue and orange contrast
Sunset - Gold and red warmth
SIGNAL STYLES:
Labels with emoji indicators (BUY with rocket, SELL with bear, STRONG with lightning)
Arrows for clean minimal appearance
Triangles for classic approach
DISPLAY OPTIONS:
Color-coded candles following trend direction
Trend background highlighting for instant trend recognition
Optional EMA line display for detailed analysis
Adjustable transparency levels for personal preference
SMART ALERTS
Pre-configured alert conditions for all major signals:
Buy signals for standard entry opportunities
Sell signals for standard exit or short opportunities
Strong buy signals for high-confidence long entries
Strong sell signals for high-confidence short entries
Bullish divergence detection alerts
Bearish divergence detection alerts
Alert messages automatically include ticker symbol, current price, and specific signal type for quick decision making.
HOW TO USE
FOR TREND TRADERS:
Enable EMA Clouds with focus on Cloud 5 featuring 50 and 200 period moving averages. Wait for trend background color change to confirm direction. Enter on STRONG signals aligned with higher timeframe trend direction. Use support and resistance levels for strategic exits.
FOR SWING TRADERS:
Enable Wave Trend Oscillator information display. Look for oversold and overbought reversal setups. Confirm potential reversals with divergence scanner. Enter on smart reversal signals with proper risk management.
FOR SCALPERS:
Use Type B signal mode for more frequent trading signals. Enable Cloud 1 with 5 and 13 periods for quick trend confirmation. Focus on momentum growing and falling states for entry timing. Take quick entries on regular buy and sell signals.
FOR POSITION TRADERS:
Use Type A mode with higher ATR multiplier set to 3.0 or above. Enable only Cloud 5 with 50 and 200 periods for major trend confirmation. Only take STRONG signals for highest probability setups. Hold positions through minor pullbacks and noise.
RECOMMENDED SETTINGS
STOCKS ON DAILY TIMEFRAME:
Trend Period: 180
ATR Period: 155
ATR Multiplier: 2.1
Signal Mode: Type A
FOREX ON HOURLY AND 4-HOUR TIMEFRAMES:
Trend Period: 150
ATR Period: 120
ATR Multiplier: 2.5
Signal Mode: Type A
CRYPTOCURRENCY ON 15-MINUTE AND 1-HOUR TIMEFRAMES:
Trend Period: 100
ATR Period: 80
ATR Multiplier: 3.0
Signal Mode: Type B
SCALPING ON 1-MINUTE AND 5-MINUTE TIMEFRAMES:
Trend Period: 50
ATR Period: 40
ATR Multiplier: 2.0
Signal Mode: Type B
WHAT IS INCLUDED
Trend Analysis using ATR-based adaptive algorithm
Five EMA Cloud Layers for multi-timeframe confluence
Wave Trend Oscillator for momentum and reversal detection
Divergence Scanner detecting four types of divergence
Market Bias using Heikin Ashi-based trend strength
Momentum System with advanced momentum tracking
Support and Resistance Levels with automatic pivot detection
Live Dashboard showing real-time market analysis
Smart Alerts featuring six pre-configured alert types
Five Color Themes offering professional visual options
TECHNICAL DETAILS
CALCULATION METHODS:
Average True Range (ATR) for volatility adaptation
Exponential Moving Average (EMA) and Simple Moving Average (SMA) for trend smoothing
Wave Trend channel oscillator for momentum analysis
Fractal-based divergence detection algorithm
Heikin Ashi transformation for bias calculation
Logarithmic momentum calculation for precision
PERFORMANCE CHARACTERISTICS:
Optimized for maximum speed and efficiency
No repainting signals ensuring reliability
Works on all timeframes from 1 minute to monthly
Compatible with all instruments including stocks, forex, crypto, and futures
RISK DISCLAIMER
This indicator is a technical analysis tool and should not be used as the sole basis for trading decisions. Always use proper risk management and never risk more than you can afford to lose. Combine with other analysis methods and practice on demo accounts first. Past performance does not guarantee future results. Trading carries substantial risk and is not suitable for all investors.
SUPPORT AND UPDATES
Regular updates and continuous improvements
Based on proven technical analysis principles
Developed following Pine Coders best practices and standards
Clean, well-documented, and optimized code structure
WHY CHOOSE ZS MASTER VISION PRO
All-in-one solution eliminating the need for multiple indicators
Highly customizable to adapt to your specific trading style
Professional grade analysis with institutional-quality standards
Clean interface that is not cluttered or confusing
Works everywhere across all markets and all timeframes
Smart signals filtered for quality over quantity
Beautiful design featuring five professional color themes
Active development with regular improvements and updates
Transform your trading with ZS Master Vision Pro today.
Version 2.0 | Created by Zakaria Safri | Pine Script Version 5

HA Reversal + Doji 🔥 Heikin Ashi Reversal + Stochastic Filter (Precision Entry System)
This indicator is designed to detect high–quality reversal entries using a Heikin Ashi candle pattern (Doji + 2 no–wick confirmation) combined with a strict Stochastic filter that uses memory of extreme touches to control trade direction.
✅ Entry Logic
🔹 Bullish BUY Signal
A BUY is triggered only when:
A valid reversal pattern is detected:
Doji candle (pivot) 3 bars back
Followed by 2 bullish candles with no lower wicks
Stochastic touched Oversold (≤ 20) at least once before the signal
Pattern + Stoch alignment = BUY
🔹 Bearish SELL Signal
A SELL is triggered only when:
Valid bearish reversal pattern:
Doji candle (pivot) 3 bars back
Followed by 2 bearish candles with no upper wicks
Stochastic touched Overbought (≥ 80) before the signal
Pattern + Stoch alignment = SELL
🧠 Stochastic “Memory” Filter
This is not a basic OB/OS filter — it uses event memory:
If Stochastic touches Oversold, the system becomes ready for BUY
If it touches Overbought, it becomes ready for SELL
Both directions can be armed at once
Once a BUY or SELL actually triggers, memory resets to neutral
Prevents “signal spam” during chop and keeps direction meaningful
🎯 Why This Works
✔ Filters out random countertrend noise
✔ Only trades after momentum exhaustion
✔ Uses strict Heikin Ashi reversal structure
✔ Works great across crypto, forex, indices, metals
✔ Designed for precision entries and swing continuation traps
⚙️ Customizable Options
Doji detection mode (body % / ticks / hybrid)
Wick tolerance
Heikin Ashi source (chart or calculated)
Stochastic source (raw or smoothed)
Option to avoid duplicate same-direction signals
Visual aids: pattern markers, blocked signals, doji debugging
📌 Best Use Cases
Reversal scalping on 5m/15m
Swing entries on 1H/4H
Trend exhaustion confirmation
Smart Money Concepts entry refinement
Entry timing after liquidity sweeps
🚨 Important
This is not a repainting system. Signals are generated at bar close only. Always combine with proper risk management and market context.
Let me know if you want:
✅ A shorter description
✅ An SEO optimized TradingView title
✅ A strategy version with backtesting
✅ Alerts version for automation

EMA inFusion Pro - Multiple SourcesEMA Fusion Pro: Dynamic Trend & Momentum Strategy with Three Exit Modes
EMA Fusion Pro is a highly customizable, multi-exit trend-following strategy designed for traders who value both precision and flexibility. By leveraging exponential moving averages (EMA), average directional index (ADX), and volume analysis, this strategy aims to capture trending market moves while offering three distinct exit modes for optimal risk management across varying market conditions.
Strategy Overview
This strategy systematically identifies potential entry points using a moving average crossover with highly configurable data sources (including price, volume, rate of change, or their Heikin Ashi versions) and filters signal quality with ADX trend strength and volume spikes. Each trade is managed with one of three advanced exit methodologies—reverse signal, ATR-based stop/take profit, or fixed percentage—giving you the control to adapt your risk profile to different market regimes.
Key Features
Customizable EMA Source: Calculate the core trend-filtering EMA from price (default), volume, rate of change, or their Heikin Ashi counterparts for unique market perspectives.
Trend Filter with ADX: Confirm entries only when the trend is strong, as measured by the user-adjustable ADX threshold.
Volume Spike Confirmation: Optional filter to only take trades with above-average volume activity, reducing false signals.
Three Exit Modes:
Reverse Signal: Exit trades when a new, opposite entry signal occurs.
ATR-Based Stop/Take Profit: Dynamic risk management using multiples of the average true range (ATR) for both take profit and stop loss.
Percent-Based Stop/Take Profit: Fixed-percentage risk management with user-defined thresholds.
Visual Annotations: Signal markers, EMA line color-coded by source, trend background coloring, and optional ATR/percent-based TP/SL levels.
Info Panel: Real-time display of all core indicators, current trading mode, exit parameters, and position status for quick oversight.
How It Works
Entry Logic: A crossover signal (above/below the EMA) triggers a new entry, but only if both ADX trend strength and (optionally) volume spike conditions are met.
Exit Logic: Three selectable modes allow you to exit trades on reverse signals, at a dynamic ATR-based profit or loss, or at a fixed percentage gain/loss.
Flexible Data Analysis: The EMA source can be chosen from six options—standard price, volume, rate of change, or their Heikin Ashi variants—allowing experimentation with different market dimensions.
Risk Management: All exits are precisely controlled, either by the next opposing signal, by volatility-adjusted levels, or by fixed risk/reward ratios.
Backtest & Optimization: The strategy is fully backtestable within TradingView’s Strategy Tester, with adjustable parameters for optimization.
Customization & Usage
Indicator Source: Select your preferred data type for EMA calculation, opening the door to creative strategy variations (e.g., volume momentum, pure price trend, rate of change divergence).
Filter Toggles: Enable/disable ADX and volume filters as desired—useful for different market environments.
Exit Mode Selection: Switch between reverse, ATR, or percent-based exits with a single parameter—ideal for adapting to ranging vs. trending markets.
Visual Clarity: The EMA line color reflects its underlying source, and the info panel summarizes all critical values for easy monitoring.
Who Should Use This Strategy?
Trend Followers seeking to ride strong moves with multiple exit options.
Experienced Traders who want to experiment with different data types (volume, momentum, Heikin Ashi) for trend analysis.
Algorithmic Traders looking for a robust, flexible base to build upon with their own ideas.
Getting Started
Apply the script to your chart and review default settings.
Customize parameters—EMA length, ADX threshold, volume settings, exit type—as desired.
Backtest on multiple instruments and timeframes to evaluate performance.
Optimize filters, exit rules, and risk parameters for your preferred trading style.
Monitor with the real-time info panel and trade alerts.
Disclaimer
This script is for educational and entertainment purposes only. It is not financial advice. Past performance is not indicative of future results. Always conduct thorough testing and consider your risk tolerance before trading real capital.
— Happy Trading —
Feel free to adapt, share, and contribute to this open-source strategy!

ARMA(Autoregressive Moving Average) Model -DeepALGO-📊 ARMA Model Indicator
This script is a custom indicator based on the ARMA (Autoregressive Moving Average) model, one of the fundamental and widely used models in time series analysis.
While ARMA is typically employed in statistical software, this implementation makes it accessible directly on TradingView, allowing traders to visualize and apply the dynamics of ARMA in financial markets with ease.
🧩 What is the ARMA Model?
The ARMA model explains time series data by combining two components: Autoregression (AR) and Moving Average (MA).
AR (Autoregression) component
Captures the dependence of current values on past values, modeling the inherent autocorrelation of the series.
MA (Moving Average) component
Incorporates past forecast errors (residuals), smoothing out randomness and noise while improving predictive capability.
By combining these two aspects, ARMA models can capture both the underlying structure of the data and the random fluctuations, providing a more robust description of price behavior than simple averages alone.
⚙️ Design of This Script
In classical statistics, ARMA coefficients are estimated using the ACF (Autocorrelation Function) and PACF (Partial Autocorrelation Function). However, this process is often too complex for trading environments.
This script simplifies the approach:
The coefficients theta (θ) and epsilon (ε) are fixed, automatically derived from the chosen AR and MA periods.
This eliminates the need for statistical estimation, making the indicator easy to apply with simple parameter adjustments.
The goal is not academic rigor, but practical usability for traders.
🔧 Configurable Parameters
AR Period (p): Order of the autoregressive part.
MA Period (q): Order of the moving average part. Shorter periods yield faster responsiveness, while longer periods produce smoother outputs.
Offset: Shifts the line forward or backward for easier comparison.
Smoothing Period: Additional smoothing to reduce noise.
Source: Choose from Close, HL2, HLC3, High, or Low.
🎯 Advantages Compared to Traditional Moving Averages
Commonly used moving averages such as SMA (Simple Moving Average) and EMA (Exponential Moving Average) are intuitive but have limitations:
SMA applies equal weights to past data, which makes it slow to respond to new price changes.
EMA emphasizes recent data, providing faster response but often introducing more noise and reducing smoothness.
The ARMA-based approach provides two key advantages:
Balance of Responsiveness and Smoothness
AR terms capture autocorrelation while MA terms correct residuals, resulting in a smoother line that still reacts more quickly than SMA or EMA.
Flexible Adaptation
By adjusting the MA period (q), traders can fine-tune how closely the model follows price fluctuations—ranging from rapid short-term responses to stable long-term trend recognition.
📈 Practical Use Cases
The ARMA indicator can be applied in several practical ways:
Trend Direction Estimation
The slope and position of the ARMA line can provide a straightforward read of bullish or bearish market conditions.
Trend Reversal Identification
Changes in the ARMA line’s direction may signal early signs of a reversal, often with faster reaction compared to traditional moving averages.
Confirmation with Other Indicators
Combine ARMA with oscillators such as RSI or MACD to improve the reliability of signals.
Combination with Heikin-Ashi
Heikin-Ashi candles smooth out price action and highlight trend changes. When used together with ARMA, they can significantly enhance reversal detection. For example, if Heikin-Ashi indicates a potential reversal and the ARMA line simultaneously changes direction, the confluence provides a stronger and more reliable trading signal.
⚠️ Important Notes
Risk of Overfitting
Excessive optimization of AR or MA periods may lead to overfitting, where the indicator fits historical data well but fails to generalize to future market conditions. Keep parameter choices simple and consistent.
Weakness in Sideways Markets
ARMA works best in trending environments. In range-bound conditions, signals may become noisy or less reliable. Consider combining it with range-detection tools or volume analysis.
Not a Standalone System
This indicator should not be used in isolation for trading decisions. It is best employed as part of a broader analysis framework, combining multiple indicators and fundamental insights.
💡 Summary
This script brings the theoretical foundation of ARMA into a practical, chart-based tool for traders.
It is particularly valuable for those who find SMA too lagging or EMA too noisy, offering a more nuanced balance between responsiveness and smoothness.
By capturing both autocorrelation and residual structure, ARMA provides a deeper view of market dynamics.
Combined with tools such as Heikin-Ashi or oscillators, it can significantly enhance trend reversal detection and strategy reliability.

Bollinger Bands % | QuantEdgeB📊 Introducing Bollinger Bands % (BB%) by QuantEdgeB
🛠️ Overview
BB% | QuantEdgeB is a volatility-aware momentum tool that maps price within a Bollinger envelope onto a normalized scale. By letting you choose the base moving average (SMA, EMA, DEMA, TEMA, HMA, ALMA, EHMA, THMA, RMA, WMA, VWMA, T3, LSMA) and even Heikin-Ashi sources, it adapts to your style while keeping readings consistent across symbols and timeframes. Clear thresholds and color-coded visuals make it easy to spot emerging strength, fading moves, and potential mean-reversions.
✨ Key Features
• 🔹 Flexible Baseline
Pick from 12 MA types (plus Heikin-Ashi source option) to tailor responsiveness and smoothness.
• 🔹 Normalized Positioning
Price is expressed as a percentage of the band range, yielding an intuitive 0–100 style read (can exceed in extreme trends).
• 🔹 Actionable Thresholds
Default Long 55 / Short 45 levels provide simple, objective triggers.
• 🔹 Visual Clarity
Color-coded candles, shaded OB/OS zones, and adaptive color themes speed up decision-making.
• 🔹 Ready-to-Alert
Built-in alerts for long/short transitions.
📐 How It Works
1️⃣ Band Construction
A moving average (your choice) defines the midline; volatility (standard deviation) builds upper/lower bands.
2️⃣ Normalization
The indicator measures where price sits between the lower and upper band, scaling that into a bounded oscillator (BB%).
3️⃣ Signal Logic
• ✅ Long when BB% rises above 55 (strength toward the top of the envelope).
• ❌ Short when BB% falls below 45 (weakness toward the bottom).
4️⃣ OB/OS Context
Shaded regions above/below typical ranges highlight exhaustion and potential snap-backs.
⚙️ Custom Settings
• Base MA Type: SMA, EMA, DEMA, TEMA, HMA, ALMA, EHMA, THMA, RMA, WMA, VWMA, T3, LSMA
• Source Mode: Classic price or Heikin-Ashi (close/open/high/hlc3)
• Base Length: default 40
• Band Width: standard deviation-based (2× SD by default)
• Long / Short Thresholds: defaults 55 / 45
• Color Mode: Alpha, MultiEdge, TradingSuite, Premium, Fundamental, Classic, Warm, Cold, Strategy
• Candles & Labels: optional candle coloring and signal markers
👥 Ideal For
✅ Trend Followers — Ride strength as price compresses near the upper band.
✅ Swing/Mean-Reversion Traders — Fade extremes when BB% stretches into OB/OS zones.
✅ Multi-Timeframe Analysts — Compare band position consistently across periods.
✅ System Builders — Use BB% as a normalized feature for strategies and filters.
📌 Conclusion
BB% | QuantEdgeB delivers a clean, normalized read of price versus its volatility envelope—adaptable via rich MA/source options and easy to automate with thresholds and alerts.
🔹 Key Takeaways:
1️⃣ Normalized view of price inside the volatility bands
2️⃣ Flexible baseline (12+ MA choices) and Heikin-Ashi support
3️⃣ Straightforward 55/45 triggers with clear visual context
📌 Disclaimer: Past performance is not indicative of future results. No strategy guarantees success.
📌 Strategic Advice: Always backtest, tune parameters, and align with your risk profile before live trading.
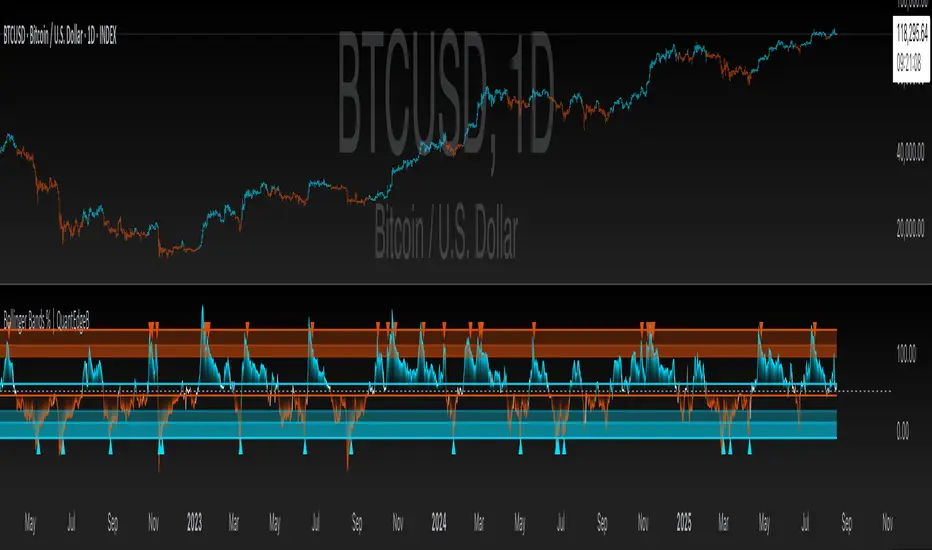
True OHLC - [CrossTrade] True OHLC Data Indicator
This indicator displays the actual open, high, low, and close prices when viewing Heikin Ashi charts.
Heikin Ashi candles use modified price calculations that smooth out price action, but this means you can't see the real price levels where trades actually occurred. This indicator pulls the genuine OHLC data and plots it on top of your Heikin Ashi chart.
The indicator includes alert conditions that reference these real price values, making it useful for strategies and alert systems that need accurate price data instead of the modified Heikin Ashi values.
Customize the colors, line thickness, and plot style (circles, lines, or crosses) to fit your chart preferences.

Alpha - Combined BreakoutThis Pine Script indicator, "Alpha - Combined Breakout," is a combination between Smart Money Breakout Signals and UT Bot Alert, The UT Bot Alert indicator was initially developer by Yo_adriiiiaan
The idea of original code belongs HPotter.
This Indicator helps you identify potential trading opportunities by combining two distinct strategies: Smart Money Breakout and a modified UT Bot (likely a variation of the Ultimate Trend Bot). It provides visual signals, draws lines for potential take profit (TP) and stop loss (SL) levels, and includes a dashboard to track performance metrics.
Tutorial:
Understanding and Using the "Alpha - Combined Breakout" Indicator
This indicator is designed for traders looking for confirmation of market direction and potential entry/exit points by blending structural analysis with a trend-following oscillator.
How it Works (General Concept)
The indicator combines two main components:
Smart Money Breakout: This part identifies significant breaks in market structure, which "smart money" traders often use to gauge shifts in supply and demand. It looks for higher highs/lows or lower highs/lows and flags when these structural points are broken.
UT Bot: This is a trend-following component that generates buy and sell signals based on price action relative to an Average True Range (ATR) based trailing stop.
You can choose to use these signals independently or combined to generate trading alerts and visual cues on your chart. The dashboard provides a quick overview of how well the signals are performing based on your chosen settings and display mode.
Parameters and What They Do
Let's break down each input parameter:
1. Smart Money Inputs
These settings control how the indicator identifies market structure and breakouts.
swingSize (Market Structure Time-Horizon):
What it does: This integer value defines the number of candles used to identify significant "swing" (pivot) points—highs and lows.
Effect: A larger swingSize creates a smoother market structure, focusing on longer-term trends. This means signals might appear less frequently and with some delay but could be more reliable for higher timeframes or broader market movements. A smaller swingSize will pick up more minor market structure changes, leading to more frequent but potentially noisier signals, suitable for lower timeframes or scalping.
Analogy: Think of it like a zoom level on your market structure map. Higher values zoom out, showing only major mountain ranges. Lower values zoom in, showing every hill and bump.
bosConfType (BOS Confirmation Type):
What it does: This string input determines how a Break of Structure (BOS) is confirmed. You have two options:
'Candle Close': A breakout is confirmed only if a candle's closing price surpasses the previous swing high (for bullish) or swing low (for bearish).
'Wicks': A breakout is confirmed if any part of the candle (including its wick) surpasses the previous swing high or low.
Effect: 'Candle Close' provides stronger, more conservative confirmation, as it implies sustained price movement beyond the structure. 'Wicks' provides earlier, more aggressive signals, as it captures momentary breaches of the structure.
Analogy: Imagine a wall. 'Candle Close' means the whole person must get over the wall. 'Wicks' means even a finger touching over the top counts as a breach.
choch (Show CHoCH):
What it does: A boolean (true/false) input to enable or disable the display of "Change of Character" (CHoCH) labels. CHoCH indicates the first structural break against the current dominant trend.
Effect: When true, it helps identify early signs of a potential trend reversal, as it marks where the market's "character" (its tendency to make higher highs/lows or lower lows/highs) first changes.
BULL (Bullish Color) & BEAR (Bearish Color):
What they do: These color inputs allow you to customize the visual appearance of bullish and bearish signals and lines drawn by the Smart Money component.
Effect: Purely cosmetic, helps with visual identification on the chart.
sm_tp_sl_multiplier (SM TP/SL Multiplier (ATR)):
What it does: A float value that acts as a multiplier for the Average True Range (ATR) to calculate the Take Profit (TP) and Stop Loss (SL) levels specifically when you're in "Smart Money Only" mode. It uses the ATR calculated by the UT Bot's nLoss_ut as its base.
Effect: A higher multiplier creates wider TP/SL levels, potentially leading to fewer trades but larger wins/losses. A lower multiplier creates tighter TP/SL levels, potentially leading to more frequent but smaller wins/losses.
2. UT Bot Alerts Inputs
These parameters control the behavior and sensitivity of the UT Bot component.
a_ut (UT Key Value (Sensitivity)):
What it does: This integer value adjusts the sensitivity of the UT Bot.
Effect: A higher value makes the UT Bot less sensitive to price fluctuations, resulting in fewer and potentially more reliable signals. A lower value makes it more sensitive, generating more signals, which can include more false signals.
Analogy: Like a noise filter. Higher values filter out more noise, keeping only strong signals.
c_ut (UT ATR Period):
What it does: This integer sets the look-back period for the Average True Range (ATR) calculation used by the UT Bot. ATR measures market volatility.
Effect: This period directly influences the calculation of the nLoss_ut (which is a_ut * xATR_ut), thus defining the distance of the trailing stop loss and take profit levels. A longer period makes the ATR smoother and less reactive to sudden price spikes. A shorter period makes it more responsive.
h_ut (UT Signals from Heikin Ashi Candles):
What it does: A boolean (true/false) input to determine if the UT Bot calculations should use standard candlestick data or Heikin Ashi candlestick data.
Effect: Heikin Ashi candles smooth out price action, often making trends clearer and reducing noise. Using them for UT Bot signals can lead to smoother, potentially delayed signals that stay with a trend longer. Standard candles are more reactive to raw price changes.
3. Line Drawing Control Buttons
These crucial boolean inputs determine which type of signals will trigger the drawing of TP/SL/Entry lines and flags on your chart. They act as a priority system.
drawLinesUtOnly (Draw Lines: UT Only):
What it does: If checked (true), lines and flags will only be drawn when the UT Bot generates a buy/sell signal.
Effect: Isolates UT Bot signals for visual analysis.
drawLinesSmartMoneyOnly (Draw Lines: Smart Money Only):
What it does: If checked (true), lines and flags will only be drawn when the Smart Money Breakout logic generates a bullish/bearish breakout.
Effect: Overrides drawLinesUtOnly if both are checked. Isolates Smart Money signals.
drawLinesCombined (Draw Lines: UT & Smart Money (Combined)):
What it does: If checked (true), lines and flags will only be drawn when both a UT Bot signal AND a Smart Money Breakout signal occur on the same bar.
Effect: Overrides both drawLinesUtOnly and drawLinesSmartMoneyOnly if checked. Provides the strictest entry criteria for line drawing, looking for strong confluence.
Dashboard Metrics Explained
The dashboard provides performance statistics based on the lines drawing control button selected. For example, if "Draw Lines: UT Only" is active, the dashboard will show stats only for UT Bot signals.
Total Signals: The total number of buy or sell signals generated by the selected drawing mode.
TP1 Win Rate: The percentage of signals where the price reached Take Profit 1 (TP1) before hitting the Stop Loss.
TP2 Win Rate: The percentage of signals where the price reached Take Profit 2 (TP2) before hitting the Stop Loss.
TP3 Win Rate: The percentage of signals where the price reached Take Profit 3 (TP3) before hitting the Stop Loss. (Note: TP1, TP2, TP3 are in order of distance from entry, with TP3 being furthest.)
SL before any TP rate: This crucial metric shows the number of times the Stop Loss was hit / the percentage of total signals where the stop loss was triggered before any of the three Take Profit levels were reached. This gives you a clear picture of how often a trade resulted in a loss without ever moving into profit target territory.
Short Tutorial: How to Use the Indicator
Add to Chart: Open your TradingView chart, go to "Indicators," search for "Alpha - Combined Breakout," and add it to your chart.
Access Settings: Once added, click the gear icon next to the indicator name on your chart to open its settings.
Choose Your Signal Mode:
For UT Bot only: Uncheck "Draw Lines: Smart Money Only" and "Draw Lines: UT & Smart Money (Combined)". Ensure "Draw Lines: UT Only" is checked.
For Smart Money only: Uncheck "Draw Lines: UT Only" and "Draw Lines: UT & Smart Money (Combined)". Ensure "Draw Lines: Smart Money Only" is checked.
For Combined Signals: Check "Draw Lines: UT & Smart Money (Combined)". This will override the other two.
Adjust Parameters:
Start with default settings. Observe how the signals appear on your chosen asset and timeframe.
Refine Smart Money: If you see too many "noisy" market structure breaks, increase swingSize. If you want earlier breakouts, try "Wicks" for bosConfType.
Refine UT Bot: Adjust a_ut (Sensitivity) to get more or fewer UT Bot signals. Change c_ut (ATR Period) if you want larger or smaller TP/SL distances. Experiment with h_ut to see if Heikin Ashi smoothing suits your trading style.
Adjust TP/SL Multiplier: If using "Smart Money Only" mode, fine-tune sm_tp_sl_multiplier to set appropriate risk/reward levels.
Interpret Signals & Lines:
Buy/Sell Flags: These indicate the presence of a signal based on your selected drawing mode.
Entry Line (Blue Solid): This is where the signal was generated (usually the close price of the signal candle).
SL Line (Red/Green Solid): Your calculated stop loss level.
TP Lines (Dashed): Your three calculated take profit levels (TP1, TP2, TP3, where TP3 is the furthest target).
Smart Money Lines (BOS/CHoCH): These lines indicate horizontal levels where market structure breaks occurred. CHoCH labels might appear at the first structural break against the prior trend.
Monitor Dashboard: Pay attention to the dashboard in the top right corner. This dynamically updates to show the win rates for each TP and, crucially, the "SL before any TP rate." Use these statistics to evaluate the effectiveness of the indicator's signals under your current settings and chosen mode.
*
Set Alerts (Optional): You can set up alerts for any of the specific signals (UT Bot Long/Short, Smart Money Bullish/Bearish, or the "Line Draw" combined signals) to notify you when they occur, even if you're not actively watching the chart.
By following this tutorial, you'll be able to effectively use and customize the "Alpha - Combined Breakout" indicator to suit your trading strategy.

Better MACD📘 Better MACD – Adaptive Momentum & Divergence Suite
Better MACD is a comprehensive momentum-trend tool that evolves the traditional MACD into a multi-dimensional, divergence-aware oscillator. It leverages exponential smoothing across logarithmic rate-of-change of OHLC data, adaptive signal processing, and intelligent divergence detection logic to provide traders with earlier, smoother, and more reliable momentum signals.
This indicator is built for professional-level analysis, suitable for scalping, swing trading, and trend-following systems.
🧬 Core Concept
Unlike the classic MACD which subtracts two EMAs of price, Better MACD constructs a signal by:
Applying logarithmic transformation on the change between OHLC components (Close, High, Low, Open).
Using double EMA smoothing to filter noise and volatility, Triangular method. 1st to 2nd Smoothing.
Averaging and de-biasing the results through a custom linear regression model, 4th Smoothing.
Subtracting a fast SMA and slow SMA response to yield a dynamic MACD value, 3rd Smoothing.
The result is a smooth, adaptive, and high-resolution MACD-style oscillator that responds more naturally to trend conditions and price geometry.
🧠 Features Breakdown
1. 📈 Multi-Layer MACD Engine
Src1: Smoothed Log Rate-of-Change on Close
Src2: Smoothed Log Rate-of-Change on High
Src3: Smoothed Log Rate-of-Change on Low
Src4: Smoothed Log Rate-of-Change on Open
These are blended using highest high, lowest low, and average Close price over a configurable window for more complete trend detection. The open-based Src4 is subtracted using SMA.
2. 🧮 Signal Line
A fast EMA (signalLength) of the Better MACD value is used for crossover logic.
Crossovers of MACD and Signal line signal potential entries or exits.
3. 📊 MACD Histogram
Visualizes the difference between MACD and Signal line.
Dynamically color-coded:
Green/Light Green for bullish impulse
Red/Pink for bearish impulse
Width and color intensity reflect strength and momentum slope.
🎨 Visual Enhancements
Feature Description
✅ Ribbon Fill Optional fill between MACD and Signal line, colored by trend direction
✅ Zero-Line Background Background highlights above/below 0 to easily read bullish/bearish bias
✅ Crossover Highlights Tiny circles plotted when MACD crosses Signal line
🔍 Divergence Detection Suite
The script includes a full Divergence Engine to detect:
🔼 Bullish Regular Divergence (Price lower lows + Indicator higher lows)
🔽 Bearish Regular Divergence (Price higher highs + Indicator lower highs)
🟢 Bullish Hidden Divergence (Price higher lows + Indicator lower lows)
🔴 Bearish Hidden Divergence (Price lower highs + Indicator higher highs)
🧩 Divergence Modes:
Supports both Regular, Hidden, or Both simultaneously
Detects from either Close Price or Heikin Ashi-derived candles
Uses dynamic pivot tracking with configurable lookback and divergence sensitivity
Divergence lines are labeled, colored, and plotted in real-time
🔁 Styling & Customization:
Choose from Solid, Dashed, or Dotted line styles
Configure separate colors and widths for all divergence types
Control number of divergence lines visible or only show the most recent
Divergences update live without repainting
⚠️ Alerts
Alerts are built-in for real-time notification:
MACD Histogram reversals (rising → falling, or vice versa)
Divergence signals (all 4 types, grouped and individually)
Combines seamlessly with TradingView alerts for actionable triggers
🔧 Input Controls (Grouped by Purpose)
Better MACD Group
1st–4th Smoothing Lengths: Controls responsiveness of MACD core engine
Signal Length: Smoothness of signal line
Toggles for crossover highlights, zero cross fills, and ribbon fills
Divergence Settings
Enable/disable divergence lines
Choose divergence type (Regular, Hidden, Both)
Set confirmation requirements
Customize pivot detection and bar search depth
Styling Options
Colors, line widths, and line styles for each divergence type
Heikin Ashi Mode for smoother pivots and divergences
🧠 How to Use
✅ For Trend Traders:
Use MACD > Signal + Histogram > 0 → Bullish confirmation
MACD < Signal + Histogram < 0 → Bearish confirmation
Wait for pullbacks with hidden divergences to enter in trend direction
✅ For Reversal Traders:
Look for Regular Divergences at trend exhaustion points
Combine with price action (e.g., support/resistance or candle pattern)
✅ For Swing & Day Traders:
Enable Heikin Ashi Mode for smoother divergence pivots
Use zero line background + histogram color to time entries
📌 Summary
Feature Description
🚀 Advanced MACD Core Smoother, more reliable, multi-source-based MACD
🔍 Divergence Engine Detects 4 divergence types with pivot logic
🎯 Real-Time Alerts Alerts for histogram slope and divergences
🎛️ Deep Customization Full styling, smoothing, and detection controls
📉 Heikin Ashi Support Improved signal quality in trend-based markets

Ultimate Scalping Tool[BullByte]Overview
The Ultimate Scalping Tool is an open-source TradingView indicator built for scalpers and short-term traders released under the Mozilla Public License 2.0. It uses a custom Quantum Flux Candle (QFC) oscillator to combine multiple market forces into one visual signal. In plain terms, the script reads momentum, trend strength, volatility, and volume together and plots a special “candlestick” each bar (the QFC) that reflects the overall market bias. This unified view makes it easier to spot entries and exits: the tool labels signals as Strong Buy/Sell, Pullback (a brief retracement in a trend), Early Entry, or Exit Warning . It also provides color-coded alerts and a small dashboard of metrics. In practice, traders see green/red oscillator bars and symbols on the chart when conditions align, helping them scalp or trend-follow without reading multiple separate indicators.
Core Components
Quantum Flux Candle (QFC) Construction
The QFC is the heart of the indicator. Rather than using raw price, it creates a candlestick-like bar from the underlying oscillator values. Each QFC bar has an “open,” “high/low,” and “close” derived from calculated momentum and volatility inputs for that period . In effect, this turns the oscillator into intuitive candle patterns so traders can recognize momentum shifts visually. (For comparison, note that Heikin-Ashi candles “have a smoother look because take an average of the movement”. The QFC instead represents exact oscillator readings, so it reflects true momentum changes without hiding price action.) Colors of QFC bars change dynamically (e.g. green for bullish momentum, red for bearish) to highlight shifts. This is the first open-source QFC oscillator that dynamically weights four non-correlated indicators with moving thresholds, which makes it a unique indicator on its own.
Oscillator Normalization & Adaptive Weights
The script normalizes its oscillator to a fixed scale (for example, a 0–100 range much like the RSI) so that various inputs can be compared fairly. It then applies adaptive weighting: the relative influence of trend, momentum, volatility or volume signals is automatically adjusted based on current market conditions. For instance, in very volatile markets the script might weight volatility more heavily, or in a strong trend it might give extra weight to trend direction. Normalizing data and adjusting weights helps keep the QFC sensitive but stable (normalization ensures all inputs fit a common scale).
Trend/Momentum/Volume/Volatility Fusion
Unlike a typical single-factor oscillator, the QFC oscillator fuses four aspects at once. It may compute, for example, a trend indicator (such as an ADX or moving average slope), a momentum measure (like RSI or Rate-of-Change), a volume-based pressure (similar to MFI/OBV), and a volatility measure (like ATR) . These different values are combined into one composite oscillator. This “multi-dimensional” approach follows best practices of using non-correlated indicators (trend, momentum, volume, volatility) for confirmation. By encoding all these signals in one line, a high QFC reading means that trend, momentum, and volume are all aligned, whereas a neutral reading might mean mixed conditions. This gives traders a comprehensive picture of market strength.
Signal Classification
The script interprets the QFC oscillator to label trades. For example:
• Strong Buy/Sell : Triggered when the oscillator crosses a high-confidence threshold (e.g. breaks clearly above zero with strong slope), indicating a well-confirmed move. This is like seeing a big green/red QFC candle aligned with the trend.
• Pullbacks : Identified when the trend is up but momentum dips briefly. A Pullback Buy appears if the overall trend is bullish but the oscillator has a short retracement – a typical buying opportunity in an uptrend. (A pullback is “a brief decline or pause in a generally upward price trend”.)
• Early Buy/Sell : Marks an initial swing in the oscillator suggesting a possible new trend, before it is fully confirmed. It’s a hint of momentum building (an early-warning signal), not as strong as the confirmed “Strong” signal.
• Exit Warnings : Issued when momentum peaks or reverses. For instance, if the QFC bars reach a high and start turning red/green opposite, the indicator warns that the move may be ending. In other words, a Momentum Peak is the point of maximum strength after which weakness may follow.
These categories correspond to typical trading concepts: Pullback (temporary reversal in an uptrend), Early Buy (an initial bullish cross), Strong Buy (confirmed bullish momentum), and Momentum Peak (peak oscillator value suggesting exhaustion).
Filters (DI Reversal, Dynamic Thresholds, HTF EMA/ADX)
Extra filters help avoid bad trades. A DI Reversal filter uses the +DI/–DI lines (from the ADX system) to require that the trend direction confirms the signal . For example, it might ignore a buy signal if the +DI is still below –DI. Dynamic Thresholds adjust signal levels on-the-fly: rather than fixed “overbought” lines, they move with volatility so signals happen under appropriate market stress. An optional High-Timeframe EMA or ADX filter adds a check against a larger timeframe trend: for instance, only taking a trade if price is above the weekly EMA or if weekly ADX shows a strong trend. (Notably, the ADX is “a technical indicator used by traders to determine the strength of a price trend”, so requiring a high-timeframe ADX avoids trading against the bigger trend.)
Dashboard Metrics & Color Logic
The Dashboard in the Ultimate Scalping Tool (UST) serves as a centralized information hub, providing traders with real-time insights into market conditions, trend strength, momentum, volume pressure, and trade signals. It is highly customizable, allowing users to adjust its appearance and content based on their preferences.
1. Dashboard Layout & Customization
Short vs. Extended Mode : Users can toggle between a compact view (9 rows) and an extended view (13 rows) via the `Short Dashboard` input.
Text Size Options : The dashboard supports three text sizes— Tiny, Small, and Normal —adjustable via the `Dashboard Text Size` input.
Positioning : The dashboard is positioned in the top-right corner by default but can be moved if modified in the script.
2. Key Metrics Displayed
The dashboard presents critical trading metrics in a structured table format:
Trend (TF) : Indicates the current trend direction (Strong Bullish, Moderate Bullish, Sideways, Moderate Bearish, Strong Bearish) based on normalized trend strength (normTrend) .
Momentum (TF) : Displays momentum status (Strong Bullish/Bearish or Neutral) derived from the oscillator's position relative to dynamic thresholds.
Volume (CMF) : Shows buying/selling pressure levels (Very High Buying, High Selling, Neutral, etc.) based on the Chaikin Money Flow (CMF) indicator.
Basic & Advanced Signals:
Basic Signal : Provides simple trade signals (Strong Buy, Strong Sell, Pullback Buy, Pullback Sell, No Trade).
Advanced Signal : Offers nuanced signals (Early Buy/Sell, Momentum Peak, Weakening Momentum, etc.) with color-coded alerts.
RSI : Displays the Relative Strength Index (RSI) value, colored based on overbought (>70), oversold (<30), or neutral conditions.
HTF Filter : Indicates the higher timeframe trend status (Bullish, Bearish, Neutral) when using the Leading HTF Filter.
VWAP : Shows the V olume-Weighted Average Price and whether the current price is above (bullish) or below (bearish) it.
ADX : Displays the Average Directional Index (ADX) value, with color highlighting whether it is rising (green) or falling (red).
Market Mode : Shows the selected market type (Crypto, Stocks, Options, Forex, Custom).
Regime : Indicates volatility conditions (High, Low, Moderate) based on the **ATR ratio**.
3. Filters Status Panel
A secondary panel displays the status of active filters, helping traders quickly assess which conditions are influencing signals:
- DI Reversal Filter: On/Off (confirms reversals before generating signals).
- Dynamic Thresholds: On/Off (adjusts buy/sell thresholds based on volatility).
- Adaptive Weighting: On/Off (auto-adjusts oscillator weights for trend/momentum/volatility).
- Early Signal: On/Off (enables early momentum-based signals).
- Leading HTF Filter: On/Off (applies higher timeframe trend confirmation).
4. Visual Enhancements
Color-Coded Cells : Each metric is color-coded (green for bullish, red for bearish, gray for neutral) for quick interpretation.
Dynamic Background : The dashboard background adapts to market conditions (bullish/bearish/neutral) based on ADX and DI trends.
Customizable Reference Lines : Users can enable/disable fixed reference lines for the oscillator.
How It(QFC) Differs from Traditional Indicators
Quantum Flux Candle (QFC) Versus Heikin-Ashi
Heikin-Ashi candles smooth price by averaging (HA’s open/close use averages) so they show trend clearly but hide true price (the current HA bar’s close is not the real price). QFC candles are different: they are oscillator values, not price averages . A Heikin-Ashi chart “has a smoother look because it is essentially taking an average of the movement”, which can cause lag. The QFC instead shows the raw combined momentum each bar, allowing faster recognition of shifts. In short, HA is a smoothed price chart; QFC is a momentum-based chart.
Versus Standard Oscillators
Common oscillators like RSI or MACD use fixed formulas on price (or price+volume). For example, RSI “compares gains and losses and normalizes this value on a scale from 0 to 100”, reflecting pure price momentum. MFI is similar but adds volume. These indicators each show one dimension: momentum or volume. The Ultimate Scalping Tool’s QFC goes further by integrating trend strength and volatility too. In practice, this means a move that looks strong on RSI might be downplayed by low volume or weak trend in QFC. As one source notes, using multiple non-correlated indicators (trend, momentum, volume, volatility) provides a more complete market picture. The QFC’s multi-factor fusion is unique – it is effectively a multi-dimensional oscillator rather than a traditional single-input one.
Signal Style
Traditional oscillators often use crossovers (RSI crossing 50) or fixed zones (MACD above zero) for signals. The Ultimate Scalping Tool’s signals are custom-classified: it explicitly labels pullbacks, early entries, and strong moves. These terms go beyond a typical indicator’s generic “buy”/“sell.” In other words, it packages a strategy around the oscillator, which traders can backtest or observe without reading code.
Key Term Definitions
• Pullback : A short-term dip or consolidation in an uptrend. In this script, a Pullback Buy appears when price is generally rising but shows a brief retracement. (As defined by Investopedia, a pullback is “a brief decline or pause in a generally upward price trend”.)
• Early Buy/Sell : An initial or tentative entry signal. It means the oscillator first starts turning positive (or negative) before a full trend has developed. It’s an early indication that a trend might be starting.
• Strong Buy/Sell : A confident entry signal when multiple conditions align. This label is used when momentum is already strong and confirmed by trend/volume filters, offering a higher-probability trade.
• Momentum Peak : The point where bullish (or bearish) momentum reaches its maximum before weakening. When the oscillator value stops rising (or falling) and begins to reverse, the script flags it as a peak – signaling that the current move could be overextended.
What is the Flux MA?
The Flux MA (Moving Average) is an Exponential Moving Average (EMA) applied to a normalized oscillator, referred to as FM . Its purpose is to smooth out the fluctuations of the oscillator, providing a clearer picture of the underlying trend direction and strength. Think of it as a dynamic baseline that the oscillator moves above or below, helping you determine whether the market is trending bullish or bearish.
How it’s calculated (Flux MA):
1.The oscillator is normalized (scaled to a range, typically between 0 and 1, using a default scale factor of 100.0).
2.An EMA is applied to this normalized value (FM) over a user-defined period (default is 10 periods).
3.The result is rescaled back to the oscillator’s original range for plotting.
Why it matters : The Flux MA acts like a support or resistance level for the oscillator, making it easier to spot trend shifts.
Color of the Flux Candle
The Quantum Flux Candle visualizes the normalized oscillator (FM) as candlesticks, with colors that indicate specific market conditions based on the relationship between the FM and the Flux MA. Here’s what each color means:
• Green : The FM is above the Flux MA, signaling bullish momentum. This suggests the market is trending upward.
• Red : The FM is below the Flux MA, signaling bearish momentum. This suggests the market is trending downward.
• Yellow : Indicates strong buy conditions (e.g., a "Strong Buy" signal combined with a positive trend). This is a high-confidence signal to go long.
• Purple : Indicates strong sell conditions (e.g., a "Strong Sell" signal combined with a negative trend). This is a high-confidence signal to go short.
The candle mode shows the oscillator’s open, high, low, and close values for each period, similar to price candlesticks, but it’s the color that provides the quick visual cue for trading decisions.
How to Trade the Flux MA with Respect to the Candle
Trading with the Flux MA and Quantum Flux Candle involves using the MA as a trend indicator and the candle colors as entry and exit signals. Here’s a step-by-step guide:
1. Identify the Trend Direction
• Bullish Trend : The Flux Candle is green and positioned above the Flux MA. This indicates upward momentum.
• Bearish Trend : The Flux Candle is red and positioned below the Flux MA. This indicates downward momentum.
The Flux MA serves as the reference line—candles above it suggest buying pressure, while candles below it suggest selling pressure.
2. Interpret Candle Colors for Trade Signals
• Green Candle : General bullish momentum. Consider entering or holding a long position.
• Red Candle : General bearish momentum. Consider entering or holding a short position.
• Yellow Candle : A strong buy signal. This is an ideal time to enter a long trade.
• Purple Candle : A strong sell signal. This is an ideal time to enter a short trade.
3. Enter Trades Based on Crossovers and Colors
• Long Entry : Enter a buy position when the Flux Candle turns green and crosses above the Flux MA. If it turns yellow, this is an even stronger signal to go long.
• Short Entry : Enter a sell position when the Flux Candle turns red and crosses below the Flux MA. If it turns purple, this is an even stronger signal to go short.
4. Exit Trades
• Exit Long : Close your buy position when the Flux Candle turns red or crosses below the Flux MA, indicating the bullish trend may be reversing.
• Exit Short : Close your sell position when the Flux Candle turns green or crosses above the Flux MA, indicating the bearish trend may be reversing.
•You might also exit a long trade if the candle changes from yellow to green (weakening strong buy signal) or a short trade from purple to red (weakening strong sell signal).
5. Use Additional Confirmation
To avoid false signals, combine the Flux MA and candle signals with other indicators or dashboard metrics (e.g., trend strength, momentum, or volume pressure). For example:
•A yellow candle with a " Strong Bullish " trend and high buying volume is a robust long signal.
•A red candle with a " Moderate Bearish " trend and neutral momentum might need more confirmation before shorting.
Practical Example
Imagine you’re scalping a cryptocurrency:
• Long Trade : The Flux Candle turns yellow and is above the Flux MA, with the dashboard showing "Strong Buy" and high buying volume. You enter a long position. You exit when the candle turns red and dips below the Flux MA.
• Short Trade : The Flux Candle turns purple and crosses below the Flux MA, with a "Strong Sell" signal on the dashboard. You enter a short position. You exit when the candle turns green and crosses above the Flux MA.
Market Presets and Adaptation
This indicator is designed to work on any market with candlestick price data (stocks, crypto, forex, indices, etc.). To handle different behavior, it provides presets for major asset classes. Selecting a “Stocks,” “Crypto,” “Forex,” or “Options” preset automatically loads a set of parameter values optimized for that market . For example, a crypto preset might use a shorter lookback or higher sensitivity to account for crypto’s high volatility, while a stocks preset might use slightly longer smoothing since stocks often trend more slowly. In practice, this means the same core QFC logic applies across markets, but the thresholds and smoothing adjust so signals remain relevant for each asset type.
Usage Guidelines
• Recommended Timeframes : Optimized for 1 minute to 15 minute intraday charts. Can also be used on higher timeframes for short term swings.
• Market Types : Select “Crypto,” “Stocks,” “Forex,” or “Options” to auto tune periods, thresholds and weights. Use “Custom” to manually adjust all inputs.
• Interpreting Signals : Always confirm a signal by checking that trend, volume, and VWAP agree on the dashboard. A green “Strong Buy” arrow with green trend, green volume, and price > VWAP is highest probability.
• Adjusting Sensitivity : To reduce false signals in fast markets, enable DI Reversal Confirmation and Dynamic Thresholds. For more frequent entries in trending environments, enable Early Entry Trigger.
• Risk Management : This tool does not plot stop loss or take profit levels. Users should define their own risk parameters based on support/resistance or volatility bands.
Background Shading
To give you an at-a-glance sense of market regime without reading numbers, the indicator automatically tints the chart background in three modes—neutral, bullish and bearish—with two levels of intensity (light vs. dark):
Neutral (Gray)
When ADX is below 20 the market is considered “no trend” or too weak to trade. The background fills with a light gray (high transparency) so you know to sit on your hands.
Bullish (Green)
As soon as ADX rises above 20 and +DI exceeds –DI, the background turns a semi-transparent green, signaling an emerging uptrend. When ADX climbs above 30 (strong trend), the green becomes more opaque—reminding you that trend-following signals (Strong Buy, Pullback) carry extra weight.
Bearish (Red)
Similarly, if –DI exceeds +DI with ADX >20, you get a light red tint for a developing downtrend, and a darker, more solid red once ADX surpasses 30.
By dynamically varying both hue (green vs. red vs. gray) and opacity (light vs. dark), the background instantly communicates trend strength and direction—so you always know whether to favor breakout-style entries (in a strong trend) or stay flat during choppy, low-ADX conditions.
The setup shown in the above chart snapshot is BTCUSD 15 min chart : Binance for reference.
Disclaimer
No indicator guarantees profits. Backtest or paper trade this tool to understand its behavior in your market. Always use proper position sizing and stop loss orders.
Good luck!
- BullByte

Crosby Ratio | QuantumResearch ⚖️ Crosby Ratio | QuantumResearch
A Heikin-Ashi Smoothed Momentum Oscillator for Trend Strength & Market Rotation
Inspired by the Original Work of Bitcoin Magazine Pro
🔗 www.bitcoinmagazinepro.com
📘 Overview
The Crosby Ratio, as originally conceptualized by Bitcoin Magazine Pro, is a powerful tool used to evaluate the momentum and directional strength of price movement by analyzing the slope of market trends in degrees.
This enhanced implementation by QuantumResearch builds on the original concept with a Pine Script version tailored for trading charts, integrating Heikin-Ashi smoothing, ATR scaling, and customizable visual modes to fit traders' unique styles.
🧠 What Is the Crosby Ratio?
At its core, the Crosby Ratio uses angular measurement to quantify price movement — translating price trend strength into degrees. This approach allows traders to:
📈 Identify when the market is exhibiting strong upward or downward pressure
🚨 Spot overextended or overheated trend conditions
⚖ Filter out short-term noise and focus on macro momentum
🔍 1. Key Innovations by QuantumResearch
✅ Heikin-Ashi Smoothing: Reduces noise and stabilizes price action before computing momentum angles
✅ Custom atan2() Angular Function: Measures the directional angle between smoothed price changes and ATR-based scaling
✅ Dynamic Threshold Bands: Color-coded zones highlight overbought/oversold momentum regions
✅ Fully Customizable Palette: Choose from 8 visual themes with automatic color adaptation
📊 2. Interpretation Guide
Crosby Value Interpretation
> +18° 🚀 Strong bullish trend acceleration
+13° to +18° 📈 Moderate upward momentum
-9° to +13° ⚖ Neutral/transition phase
-15° to -9° 📉 Moderate bearish pressure
< -15° 🛑 Strong bearish acceleration
The indicator also features background shading when values exceed key thresholds, improving visual clarity during trend inflection points.
📌 Ideal Use Cases
🔄 Rotational Momentum Strategies: Spot the strongest assets during rapid shifts
⚡ Breakout Filtering: Confirm whether breakouts have directional strength
🧘 Noise Reduction: Heikin-Ashi smoothing filters chaotic wicks, especially in crypto
📉 Bearish Exhaustion Detection: Quickly identify when bearish momentum might be overdone
🔗 Original Inspiration & Acknowledgment
This indicator draws its core idea and naming convention from the original Crosby Ratio developed and introduced by Bitcoin Magazine Pro in their excellent write-up:
🔗 The Crosby Ratio – Bitcoin Magazine Pro
Their work on quantifying market sentiment via angle-based momentum inspired this script adaptation for TradingView with added visual features, smoothing techniques, and alerts.
⚠️ Disclaimer
This indicator is a momentum oscillator and should be used in conjunction with other confirmation tools. Market dynamics can vary, and no single metric ensures profitable trades. Always apply proper risk management.

Oracle Fear and GreedCustom Fear and Greed Oscillator with Movement Table
This indicator provides a unique perspective on market sentiment by calculating a custom fear/greed oscillator based on Heikin-Ashi candles. The oscillator is centered at 50, with values above 50 suggesting bullish sentiment ("greed") and below 50 indicating bearish sentiment ("fear"). The calculation incorporates candle body size, range, and a custom "candle strength" measure, providing an innovative approach to understanding market behavior.
Key Features:
Heikin-Ashi Based Oscillator:
Utilizes Heikin-Ashi candles to compute a custom oscillator. The value is centered at 50, with deviations indicating the prevailing market sentiment.
Dynamic Gradient Coloring:
The oscillator line is dynamically colored with a smooth gradient—from blue (representing fear) at lower values to pink (representing greed) at higher values—making it visually intuitive.
Horizontal Levels:
Two additional horizontal lines are drawn at 40.62 ("Bottom") and 60.74 ("Top"), which may serve as potential oversold and overbought boundaries respectively.
Fast Movement Metrics:
Every 5 bars, the indicator calculates the percentage change in the Heikin-Ashi close. This fast movement analysis distinguishes rapid downward moves (fast fear) from rapid upward moves (fast greed), helping to capture sudden market shifts.
Information Table:
A table in the top-right corner displays the most recent fast movement values for both fear and greed, offering quick insights into short-term market dynamics.
Usage Tips:
Adjust the smoothing period to match your preferred trading timeframe.
Use the oscillator alongside other analysis tools for more robust trading decisions.
Ideal for those looking to experiment with new approaches to sentiment analysis and momentum detection.
Disclaimer:
This indicator is intended for educational and experimental purposes. It should not be used as the sole basis for any trading decisions. Always combine with comprehensive market analysis and risk management strategies.
You can add this description when publishing your indicator on TradingView to help other users understand its features and intended use.
Standardized SuperTrend Oscillator
The Standardized SuperTrend Oscillator (SSO) is a versatile tool that transforms the SuperTrend indicator into an oscillator, offering both trend-following and mean reversion capabilities. It provides deeper insights into trends by standardizing the SuperTrend with respect to its upper and lower bounds, allowing traders to identify potential reversals and contrarian signals.
Methodology:
Lets begin with describing the SuperTrend indicator, which is the fundamental tool this script is based on.
SuperTrend:
The SuperTrend is calculated based on the average true range (ATR) and multiplier. It identifies the trend direction by placing a line above or below the price. In an uptrend, the line is below the price; in a downtrend, it's above the price.
pine_st(float src = hl2, float factor = 3., simple int len = 10) =>
float atr = ta.atr(len)
float up = src + factor * atr
up := up < nz(up ) or close > nz(up ) ? up : nz(up )
float lo = src - factor * atr
lo := lo > nz(lo ) or close < nz(lo ) ? lo : nz(lo )
int dir = na
float st = na
if na(atr )
dir := 1
else if st == nz(up )
dir := close > up ? -1 : 1
else
dir := close < lo ? 1 : -1
st := dir == -1 ? lo : up
SSO Oscillator:
The SSO is derived from the SuperTrend and the source price. It calculates the standardized difference between the SuperTrend and the source price. The standardization is achieved by dividing this difference by the distance between the upper and lower bounds of the SuperTrend.
float sso = (src - st) / (up - lo)
Components and Features:
SuperTrend of Oscillator - An additional SuperTrend based on the direction and volatility of the oscillator, behaving as the SuperTrend OF the SuperTrend. This provides further trend analysis of the underlying broad trend regime.
Reversion Tracer - The RSI of the direction of the original SuperTrend, providing a dynamic threshold for premium and discount price areas.
float rvt = ta.rsi(dir, len)
Heikin Ashi Transform - An option to apply the Heikin Ashi transform to the source price of the oscillator, providing a smoother visual representation of trends.
Display Modes - Choose between Line mode for a standard oscillator view or Candle mode, displaying the oscillator as Heikin Ashi candles for more in-depth trend analysis.
Contrarian and Reversion Signals:
Contrarian Signals - Based on the SuperTrend of the oscillator, these signals can act as potential buy or sell indications, highlighting potential trend exhaustion or premature reversals.
Reversion Signals - Generated when the oscillator crosses above or below the Reversion Tracer, signaling potential mean reversion opportunities or trend breakouts.
Utility and Use Cases:
Trend Analysis - Utilize the SSO as a trend-following tool with the added benefits of the oscillator's SuperTrend and Heikin Ashi transform.
Valuation Analysis - Leverage the oscillator's reversion signals for identifying potential mean reversion opportunities in the market.
The Standardized SuperTrend Oscillator enhances the capabilities of the SuperTrend indicator, offering a balanced approach to both trend-following and mean reversion strategies. Its customizable options and contrarian signals make it a valuable instrument for traders seeking comprehensive trend analysis and potential reversal signals.
