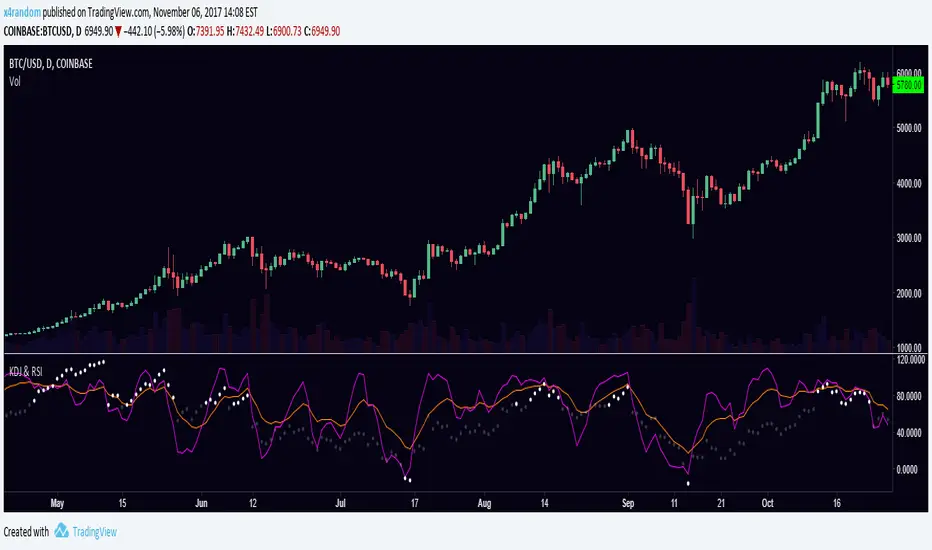
KDJ & RSIRSI and KDJ indicator combined.
KDJ: Buy when J (purple) is going up and and crossing KD (orange) from below. Sell vise versa.
RSI: Overbought when RSI is over 70, oversold when RSI is under -10.
在脚本中搜索"KDJ+股票技术分析"
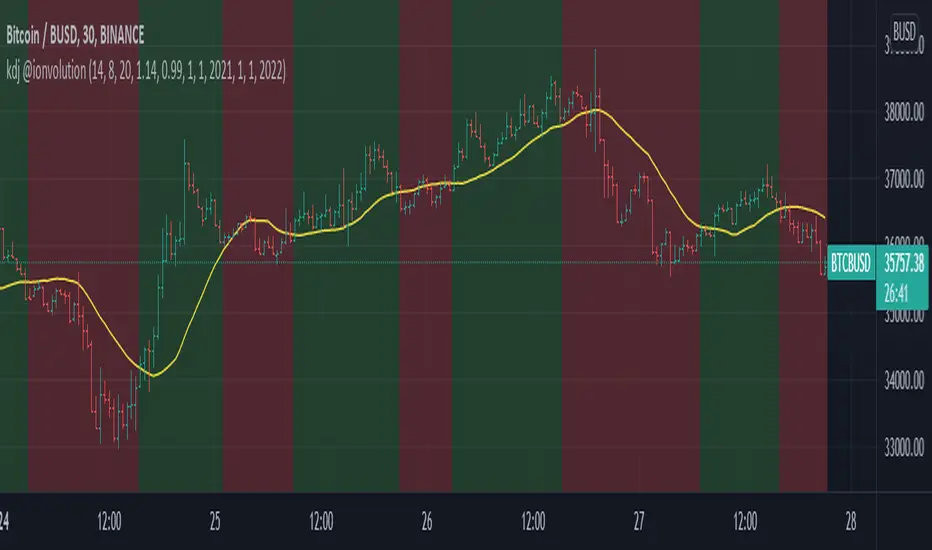
KDJ Strategy @ionvolutionBuys if there is crossover in J and D and the crossover is above an SMA defined as an input parameter
Sells if the close is below the SMA or there is a crossunder in J and D
The KDJ calculation is done using ll21LAMBOS21 script. I added start date, end date, stop loss margin and stop profit margin to ease the simulation on diferent conditions of the market.
Tested on BTCBUSD pair. Gives good results in 30m candles with K period = 7 and D period = 3, but also works fine with K period = 14 and D period = 8. It works fine when market is bullish and gives false signals in flat markets. I just developed long strategy, as it is developed to operate in SPOT trading.
KDJ Indicator-v4 - @rahulraj1255It is a v4 compatible version of the KDJ indicator code by the author iamaltcoin. It can be particularly useful when integrating this indicator with a v4 strategy code.


Combo 4+ KDJ STO RSI EMA3 Visual Trend Pine V5@RL! English !
Combo 4+ KDJ STO RSI EMA3 Visual Trend Pine V5 @ RL
Combo 4+ KDJ STO RSI EMA3 Visual Trend Pine V5 @ RL is a visual trend following indicator that groups and combines four trend following indicators. It is compiled in PINE Script Version V5 language.
• STOCH: Stochastic oscillator.
• RSI Divergence: Relative Strength Index Divergence. RSI Divergence is a difference between a fast and a slow RSI.
• KDJ: KDJ Indicator. (trend following indicator).
• EMA Triple: 3 exponential moving averages (Default display).
This indicator is intended to help beginners (and also the more experienced ones) to trade in the right direction of the market trend. It allows you to avoid the mistakes of always trading against the trend.
The calculation codes of the different indicators used are standard public codes used in the usual TradingView coding for these indicators.
The STO indicator calculation script is taken from TradingView's standard STOCH calculation.
The RSI indicator calculation script is a replica of the one created by @Shizaru.
The KDJ indicator calculation script is a replica of the one created by @iamaltcoin.
The Triple EMA indicator calculation script is a replica of the one created by @jwilcharts.
This indicator can be configured to your liking. It can even be used several times on the same graph (multi-instance), with different configurations or display of another indicator among the four that compose it, according to your needs or your tastes.
A single plot, among the 4 indicators that make it up, can be displayed at a time, but either with its own trend or with the trend of the 4 (3 by default) combined indicators (sell=green or buy=red, background color).
Trend indications (potential sell or buy areas) are displayed as a background color (bullish: green or bearish: red) when at least three of the four indicators (3 by default and configurable from 1 to 4) assume that the market is moving in the same direction. These trend indications can be configured and displayed, either only for the signal of the selected indicator and displayed, or for the signals of the four indicators together and combined (logical AND).
You can tune the input, style and visibility settings of each indicator to match your own preferences or habits.
A 'buy stop' or 'sell stop' signal is displayed (layouts) in the form of a colored square (green for 'stop buy' and red for 'stop sell'. These 'stop' signals can be configured and displayed, either only for the indicator chosen, or for the four indicators together and combined (logical OR).
Note that the presence of a Stop Long signal cancels the background color of the Long trend (green).
Likewise, the presence of a Stop Short signal cancels out the background color of the Short trend (red).
It is also made up of 3 labels:
• Trend Label
• signal Stop Label (signals Stop buy or sell )
• Info Label (Names of Long / Short / Stop Long / Stop Short indicators, and / Open / Close / High / Low ).
Each label is configurable (visibility and position on the graph).
• Trend label: indicates the number of indicators suggesting the same trend (Long or Short) as well as a strength index (PWR) of this trend: For example: 3 indicators in Short trend, 1 indicator in Long trend and 1 indicator in neutral trend will give: PWR SHORT = 2/4. (3 Short indicators - 1 Long indicator = 2 Pwr Short). And if PWR = 0 then the display is "Wait and See". It also indicates which current indicator is displayed and the display mode used (combined 1 to 4 indicators or not combined ).
• Signal Stop Label: Indicates a possible stop of the current trend.
• Label Info (Simple or Full) gives trend info for each of the 4 indicators and OHLC info for the chart (in “Full” mode).
It is possible to display this indicator several times on a chart (up to 3 indicators max with the Basic TradingView Plan and more with the paid plans), with different configurations: For example:
• 1-Stochastic - 2/4 Combined Signals - no Label displayed
• 1-RSI - Combined Signals 3/4 - Stop Label only displayed
• 1-KDJ - Combined Signals 4/4 - the 3 Labels displayed
• 1-EMA'3 - Non-combined signals (EMA only) - Trend Label displayed
Some indicators have filters / thresholds that can be configured according to your convenience and experience!
The choice of indicator colors is suitable for a graph with a "dark" theme, which you will probably need to modify for visual comfort, if you are using a "Light" mode or a custom mode.
This script is an indicator that you can run on standard chart types. It also works on non-standard chart types but the results will be skewed and different.
Non-standard charts are:
• Heikin Ashi (HA)
• Renko
• Kagi
• Point & Figure
• Range
As a reminder: No indicator is capable of providing accurate signals 100% of the time. Every now and then, even the best will fail, leaving you with a losing deal. Whichever indicator you base yourself on, remember to follow the basic rules of risk management and capital allocation.
BINANCE:BTCUSDT
**********************************************************************************************************************************************************************************************************************************************************************************
! Français !
Combo 4+ KDJ STO RSI EMA3 Visual Trend Pine V5@RL
Combo 4+ KDJ STO RSI EMA3 Visual Trend Pine V5@RL est un indicateur visuel de suivi de tendance qui regroupe et combine quatre indicateurs de suivi de tendance. Il est compilé en langage PINE Script Version V5.
• STOCH : Stochastique.
• RSI Divergence : Relative Strength Index Divergence. La Divergence RSI est une différence entre un RSI rapide et un RSI lent.
• KDJ : KDJ Indicateur. (indicateur de suivi de tendance).
• EMA Triple : 3 moyennes mobiles exponentielles (Affichage par défaut).
Cet indicateur est destiné à aider les débutants (et aussi les plus confirmé) à trader à dans le bon sens de la tendance du marché. Il permet d'éviter les erreurs qui consistent à toujours trader à contre tendance.
Les codes de calcul des différents indicateurs utilisés sont des codes publics standards utilisés dans le codage habituel de TradingView pour ces indicateurs !
Le script de calcul de l’indicateur STO est issu du calcul standard du STOCH de TradingView.
Le script de calcul de l’indicateur RSI Div est une réplique de celui créé par @Shizaru.
Le script de calcul de l’indicateur KDJ est une réplique de celui créé par @iamaltcoin.
Le script de calcul de l’indicateur Triple EMA est une réplique de celui créé par @jwilcharts
Cet indicateur peut être configuré à votre convenance. Il peut même être utilisé plusieurs fois sur le même graphique (multi-instance), avec des configurations différentes ou affichage d’un autre indicateur parmi les quatre qui le composent, selon vos besoins ou vos goûts.
Un seul tracé, parmi les 4 indicateurs qui le composent, peut être affiché à la fois mais, soit avec sa propre tendance soit avec la tendance des 4 (3 par défaut) indicateurs combinés (couleur de fond vente=vert ou achat=rouge).
Les indications de tendance (zones de vente ou d’achat potentielles) sont affichés sous la forme de couleur de fond (Haussier : vert ou baissier : rouge) lorsque au moins trois des quatre indicateurs (3 par défaut et configurable de 1 à 4) supposent que le marché évolue dans la même direction. Ces indications de tendance peuvent être configuré et affichés, soit uniquement pour le signal de l’indicateur choisi et affiché, soit pour les signaux des quatre indicateurs ensemble et combinés (ET logique).
Vous pouvez accorder les paramètres d’entrée, de style et de visibilité de chacun des indicateurs pour correspondre à vos propres préférences ou habitudes.
Un signal ‘stop achat’ ou ‘stop vente’ est affiché (layouts) sous la forme d’un carré de couleur (vert pour ‘stop achat’ et rouge pour ‘stop vente’. Ces signaux ‘stop’ peuvent être configuré et affichés, soit uniquement pour l’indicateur choisi, soit pour les quatre indicateurs ensemble et combinés (OU logique).
A noter que la présence d’un signal Stop Long annule la couleur de fond de la tendance Long (vert).
De même, la présence d’un signal Stop Short annule la couleur de fond de la tendance Short (rouge).
Il est aussi composé de 3 étiquettes (Labels) :
• Trend Label (infos de tendance)
• Signal Stop Label (signaux « Stop » achat ou vente)
• Infos Label (Noms des indicateurs Long/Short/Stop Long/Stop Short,
et /Open/Close/High/Low )
Chaque label est configurable (visibilité et position sur le graphique).
• Label Trend : indique le nombre d’indicateurs suggérant une même tendance (Long ou Short) ainsi qu’un indice de force (PWR) de cette tendance :
Par exemple : 3 indicateurs en tendance Short, 1 indicateur en tendance Long et 1 indicateur en tendance neutre donnera :
PWR SHORT = 2/4. (3 indicateurs Short – 1 indicateur Long=2 Pwr Short).
Et si PWR=0 alors l’affichage est « Wait and See » (Attendre et Observer).
Il indique aussi quel indicateur actuel est affiché et le mode d’affichage utilisé (combiné 1 à 4 indicateurs ou non combiné ).
• Signal Stop Label : Indique un possible arrêt de la tendance en cours.
• Infos Label (Simple ou complet) donne les infos de tendance de chacun des 4 indicateurs et les infos OHLC du graphique (en mode « Complet »).
Il est possible d’afficher ce même indicateur plusieurs fois sur un graphique (jusqu’à 3 indicateurs max avec le Plan Basic TradingView et plus avec les plans payants), avec des configurations différentes :
Par exemple :
• 1-Stochastique – Signaux Combinés 2/4 – aucun Label affiché
• 1-RSI – Signaux Combinés 3/4 – Label Stop uniquement affiché
• 1-KDJ – Signaux Combinés 4/4 – les 3 Labels affichés
• 1-EMA’3 - Signaux Non combinés (EMA seuls) – Trend Label affiché
Certains indicateurs ont des filtres/seuils (Thresholds) configurables selon votre convenance et votre expérience !
Le choix des couleurs de l’indicateur est adapté pour un graphique avec thème « sombre », qu’il vous faudra probablement modifier pour le confort visuel, si vous utilisez un mode « Clair » ou un mode personnalisé.
Ce script est un indicateur que vous pouvez exécuter sur des types de graphiques standard. Il fonctionne aussi sur des types de graphiques non-standard mais les résultats seront faussés et différents.
Les graphiques Non-standard sont :
• Heikin Ashi (HA)
• Renko
• Kagi
• Point & Figure
• Range
Pour rappel : Aucun indicateur n’est capable de fournir des signaux précis 100% du temps. De temps en temps, même les meilleurs échoueront, vous laissant avec une affaire perdante. Quel que soit l’indicateur sur lequel vous vous basez, n’oubliez pas de suivre les règles de base de gestion des risques et de répartition du capital.
BINANCE:BTCUSDT

RCYC Bullish Bearish Indicator
Summary: The RCYC Bullish Bearish Indicator is a custom trading tool designed to help traders identify potential bullish and bearish conditions in the market using a combination of KDJ and RSI indicators. This indicator uses color-coded candles to visually represent bullish and bearish signals, making it easy to identify trend changes on the chart. The script is particularly useful for traders who prefer visual signals and want to incorporate both trend momentum (KDJ) and relative strength (RSI) in their analysis.
Description:
The RCYC Bullish Bearish Indicator is a unique mashup of the KDJ and RSI indicators, optimized to provide a clear visual representation of market conditions through color-coded candles. This indicator not only identifies the potential trend shifts but also provides alerts for significant crossover points, enhancing a trader's ability to make informed decisions.
How It Works:
KDJ Calculation:
The KDJ is a variation of the Stochastic Oscillator that includes the %J line, which can go beyond the typical 0-100 range of %K and %D.
The KDJ component of this indicator calculates the highest high and lowest low over a specified period (KDJ Length), using these values to derive the %K line.
The %D line is a smoothed version of %K, and the %J line is derived from %K and %D using the formula: J = 3 * %K - 2 * %D.
This indicator focuses on the behavior of the %J line in relation to a mid-point level (50), identifying crossovers and crossunders that signal potential shifts in market sentiment.
RSI Calculation:
The Relative Strength Index (RSI) is a momentum oscillator that measures the speed and change of price movements. It is widely used to identify overbought or oversold conditions.
In this indicator, RSI values are adjusted and plotted to align visually with the KDJ values, providing a complementary momentum analysis.
Crossover Logic and Candle Coloring:
The indicator tracks two main events:
CrossOver50: When the %J line crosses above the 50 level, indicating potential bullish momentum.
CrossUnder50: When the %J line crosses below the 50 level, indicating potential bearish momentum.
Depending on the crossover events, the script changes the color of the candles on the chart:
Red candles on the initial crossover above 50, followed by dark blue candles to maintain bullish sentiment.
Yellow candles on the initial crossover below 50, followed by light blue candles to maintain bearish sentiment.
Alerts:
The indicator includes alert conditions for both bullish and bearish signals:
Red Candle Alert: Notifies the trader when the %J line crosses above 50.
Yellow Candle Alert: Notifies the trader when the %J line crosses below 50.
These alerts allow traders to react promptly to key market signals without continuously monitoring the chart.
Usage and Benefits:
This indicator is designed for traders looking to combine momentum and trend analysis into a single visual tool. It is particularly useful for those trading in trending markets or looking for entry/exit signals based on momentum shifts.
The color-coded candles provide an intuitive way to assess market conditions at a glance, reducing the complexity associated with analyzing multiple indicators separately.
By integrating both KDJ and RSI, the RCYC Bullish Bearish Indicator offers a balanced approach to trend detection and momentum confirmation, making it versatile for various trading styles, including scalping, swing trading, and position trading.
Originality and Usefulness:
While the indicator builds upon the familiar concepts of KDJ and RSI, it uniquely merges them into a cohesive visual tool with distinct crossover-based alerts and candle coloring.
This approach makes the indicator original, as it simplifies the interpretation of complex signals into straightforward visual cues, enhancing the decision-making process for traders who prefer chart-based analysis.

Wave N + KDJ + Volumi + SMC + IchimokuWave N + KDJ + Volume + SMC + Ichimoku Indicator
Overview
This script is a multi-layered technical indicator designed to provide traders with enhanced market insights by combining five key methodologies:
• Wave N Pattern (Price Action)
• KDJ Oscillator (Momentum)
• Volume Filtering (Confirmation)
• Smart Money Concepts (Order Blocks) (Institutional Activity)
• Ichimoku Cloud (Trend and Support/Resistance)
By integrating these components, the indicator identifies high-probability trading signals, early warnings of trend shifts, and institutional price zones to improve decision-making in volatile markets.
⸻
How It Works
1️⃣ Wave N Pattern (Price Action Structure)
The Wave N pattern is a classic price action formation that helps spot potential trend reversals and continuations:
• A Bullish Wave N is detected when a higher low and a higher high structure appears.
• A Bearish Wave N is detected when a lower high and a lower low structure forms.
2️⃣ KDJ Oscillator (Momentum & Trend Strength)
The KDJ Indicator is a variation of the Stochastic Oscillator that adds a third line, J, to amplify sensitivity to trend movements.
• J > 50 indicates bullish momentum.
• J < 50 indicates bearish momentum.
• The script includes an early warning signal when J crosses 50, suggesting a possible trend shift.
3️⃣ Volume Filtering (Trade Confirmation)
To avoid false signals, the script integrates volume confirmation:
• A signal is valid only if the volume is above the 20-period EMA of volume.
• This ensures that trade signals are supported by strong market participation.
4️⃣ Smart Money Concepts (Order Blocks)
Order Blocks represent areas of institutional interest, where large traders accumulate or distribute positions.
• The script detects bullish order blocks (potential support) and bearish order blocks (potential resistance).
• These areas help identify optimal entry and exit points.
5️⃣ Ichimoku Cloud (Trend & Dynamic Support/Resistance)
The Ichimoku Cloud is used to confirm trend direction:
• Baseline (Kijun-sen) acts as a key trend filter.
• Senkou Span A & B form the cloud (Kumo), indicating dynamic support/resistance.
• Buy signals require price to be above the baseline, while sell signals require price to be below the baseline.
⸻
Trading Signals & Visual Elements
✅ BUY Signal (Green Arrow)
Occurs when:
• A Bullish Wave N forms
• J > 50 (Bullish KDJ Signal)
• Volume is above EMA threshold
• Price is above the Ichimoku Baseline
❌ SELL Signal (Red Arrow)
Occurs when:
• A Bearish Wave N forms
• J < 50 (Bearish KDJ Signal)
• Volume is above EMA threshold
• Price is below the Ichimoku Baseline
⚠️ Early Warning (Trend Shift Signal)
• An early warning appears when J crosses 50, indicating a possible upcoming trend shift.
• The line color changes based on the potential move:
• Green/Blue → Possible Uptrend
• Red/Orange → Possible Downtrend
⸻
Why This Indicator is Unique?
Unlike simple trend-following indicators, this script:
• Combines Price Action, Momentum, Volume, and Institutional Order Flow for a multi-dimensional approach.
• Filters out weak signals using volume confirmation and Ichimoku.
• Provides early warnings before major trend shifts.
• Visualizes Smart Money Order Blocks, giving traders an edge in spotting institutional zones.
⸻
Best Timeframes & Markets
📊 Recommended Timeframes:
• 1H & 1D (works best on medium/long-term trends)
💹 Markets:
• Crypto, Forex, and Stocks
This indicator is designed for traders who value confluence and strong confirmation in their strategies. Whether you are a trend trader, swing trader, or institutional flow analyst, this tool can help refine your decision-making process.
🚀 Optimize your trades with Wave N + KDJ + Volume + SMC + Ichimoku! 🚀

[blackcat] L1 Stochastic J Price Action OscillatorLevel: 1
Background
The KDJ oscillator display consists of 3 lines (K, D and J - hence the name of the display) and 2 levels. K and D are the same lines you see when using the stochastic oscillator. The J line in turn represents the deviation of the D value from the K value. The convergence of these lines indicates new trading opportunities. Just like the Stochastic Oscillator, oversold and overbought levels correspond to the times when the trend is likely to reverse.
Function
L1 Stochastic J Price Action Oscillator with Long Strength Indicator use stochastic KDJ signal as input source and it combines with price action algorithm to form a brand-new oscillator which have less noise signal with a long signal strength indicator so as to alleviate inherent KDJ saturation issue.
Key Signal
cond --> buy signal condition from KDJ j value deduction
fastline --> fast line of new oscillator
slowline --> slow line of new oscillator
Pros and Cons
Pros:
1. it takes over KDJ's advantages
2. it can greatly reduce KDJ saturation issue
Cons:
1. no short entry signal is derived.
2. only long signal strength indicator is disclosed
Remarks
An improved version of KDJ with less satration observed.
Readme
In real life, I am a prolific inventor. I have successfully applied for more than 60 international and regional patents in the past 12 years. But in the past two years or so, I have tried to transfer my creativity to the development of trading strategies. Tradingview is the ideal platform for me. I am selecting and contributing some of the hundreds of scripts to publish in Tradingview community. Welcome everyone to interact with me to discuss these interesting pine scripts.
The scripts posted are categorized into 5 levels according to my efforts or manhours put into these works.
Level 1 : interesting script snippets or distinctive improvement from classic indicators or strategy. Level 1 scripts can usually appear in more complex indicators as a function module or element.
Level 2 : composite indicator/strategy. By selecting or combining several independent or dependent functions or sub indicators in proper way, the composite script exhibits a resonance phenomenon which can filter out noise or fake trading signal to enhance trading confidence level.
Level 3 : comprehensive indicator/strategy. They are simple trading systems based on my strategies. They are commonly containing several or all of entry signal, close signal, stop loss, take profit, re-entry, risk management, and position sizing techniques. Even some interesting fundamental and mass psychological aspects are incorporated.
Level 4 : script snippets or functions that do not disclose source code. Interesting element that can reveal market laws and work as raw material for indicators and strategies. If you find Level 1~2 scripts are helpful, Level 4 is a private version that took me far more efforts to develop.
Level 5 : indicator/strategy that do not disclose source code. private version of Level 3 script with my accumulated script processing skills or a large number of custom functions. I had a private function library built in past two years. Level 5 scripts use many of them to achieve private trading strategy.

[blackcat] L2 Improved Jeffrey Owen Cyclical SystemLevel: 2
Background
In Jeffrey Owen Katz's article "Trading stocks with a cyclical system" he introduces the Stock Rhythm System. I found the central part is quite similar to KDJ indicator and I use my own KDJ algo to enhance its performance.
Function
Jeffrey Owen Katz has a customized stochastic indicator. I used it as the engine of my own KDJ trading system. My KDJ oscillator display consists of 3 lines (K, D and J - hence the name of the display) and 2 levels. K and D are the same lines you see when using the stochastic oscillator. The J line in turn represents the deviation of the D value from the K value. The convergence of these lines indicates new trading opportunities. Just like the Stochastic Oscillator, oversold and overbought levels correspond to the times when the trend is likely to reverse. Just as the Stochastic, the KDJ has the K & D lines, plus the J. This last one represents the divergence from the K-line. When all three converge, it usually signals a possible trend forming. Labels and alerts are added for long and short entries.
Key Signal
KVal --> K.
DVal --> D.
JVal --> J.
Remarks
This is a Level 2 free and open source indicator.
Feedbacks are appreciated.

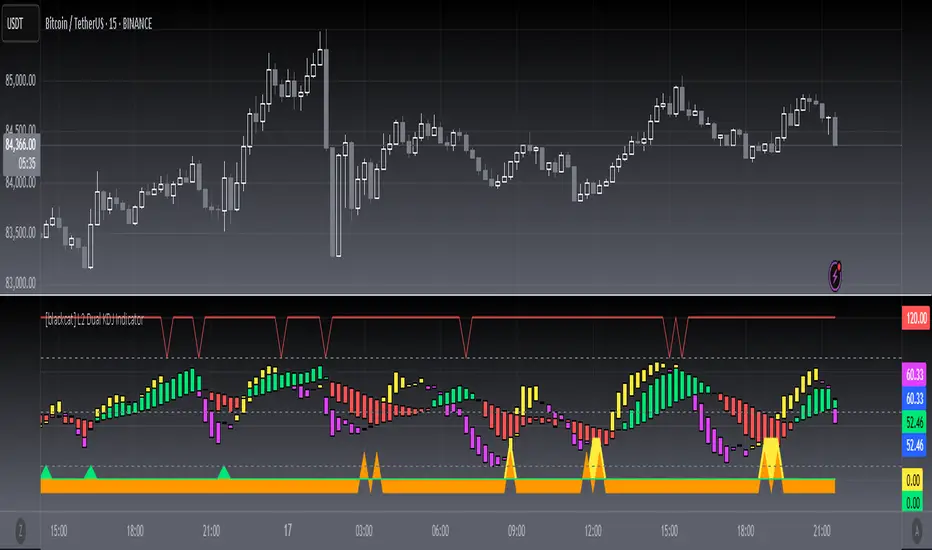
[blackcat] L2 Dual KDJ IndicatorLevel: 2
Background
I am wondering how it works with short-term and middle-term KDJ indicators put together to emulate MTF.
Function
Use a fast and a slow KDJ to combine signal together to judge trend
Key Signal
oversold --> oversold signal for long
reentry --> re-entry signal for long
addmore --> buy more signal for long
sellready --> overbought signal for short
Pros and Cons
Although it can filter out some noise, dual KDJ still have saturation issue. It may not so reliable when there are extreme market movements as similar to signle KDJ indicators.
Remarks
It improves KDJ to some extent, but it does not satisfy me yet. Keep improving.
Readme
In real life, I am a prolific inventor. I have successfully applied for more than 60 international and regional patents in the past 12 years. But in the past two years or so, I have tried to transfer my creativity to the development of trading strategies. Tradingview is the ideal platform for me. I am selecting and contributing some of the hundreds of scripts to publish in Tradingview community. Welcome everyone to interact with me to discuss these interesting pine scripts.
The scripts posted are categorized into 5 levels according to my efforts or manhours put into these works.
Level 1 : interesting script snippets or distinctive improvement from classic indicators or strategy. Level 1 scripts can usually appear in more complex indicators as a function module or element.
Level 2 : composite indicator/strategy. By selecting or combining several independent or dependent functions or sub indicators in proper way, the composite script exhibits a resonance phenomenon which can filter out noise or fake trading signal to enhance trading confidence level.
Level 3 : comprehensive indicator/strategy. They are simple trading systems based on my strategies. They are commonly containing several or all of entry signal, close signal, stop loss, take profit, re-entry, risk management, and position sizing techniques. Even some interesting fundamental and mass psychological aspects are incorporated.
Level 4 : script snippets or functions that do not disclose source code. Interesting element that can reveal market laws and work as raw material for indicators and strategies. If you find Level 1~2 scripts are helpful, Level 4 is a private version that took me far more efforts to develop.
Level 5 : indicator/strategy that do not disclose source code. private version of Level 3 script with my accumulated script processing skills or a large number of custom functions. I had a private function library built in past two years. Level 5 scripts use many of them to achieve private trading strategy.
Martingale with MACD+KDJ opening conditionsStrategy Overview:
This strategy is based on a Martingale trading approach, incorporating MACD and KDJ indicators. It features pyramiding, trailing stops, and dynamic profit-taking mechanisms, suitable for both long and short trades. The strategy increases position size progressively using a Multiplier, a key feature of Martingale systems.
Key Concepts:
Martingale Strategy: A trading system where positions are doubled or increased after a loss to recover previous losses with a single successful trade. In this script, the position size is incremented using a Multiplier for each addition.
Pyramiding: Allows adding to existing trades when market conditions are favorable, enhancing profitability during trends.
Settings:
Basic Inputs:
Initial Order: Defines the starting size of the position.
Default: 150.0
MACD Settings: Customize the fast, slow, and signal smoothing lengths.
Default: Fast Length: 9, Slow Length: 26, Signal Smoothing: 9
KDJ Settings: Customize the length and smoothing parameters for KDJ.
Default: Length: 14, Smooth K: 3, Smooth D: 3
Max Additions: Sets the number of additional positions (pyramiding).
Default: 5 (Min: 1, Max: 10)
Position Sizing: Percent to add to positions on favorable conditions.
Default: 1.0%
Martingale Multiplier:
Add Multiplier: This value controls the scaling of additional positions according to the Martingale principle. After each loss, a new position is added, and its size is increased by the Multiplier factor. For example, with a multiplier of 2, each new addition will be twice as large as the previous one, accelerating recovery if the price moves favorably.
Default: 1.0 (no multiplication)
Can be adjusted up to 10x to aggressively increase position size after losses.
Trade Execution:
Long Trades:
Entry Condition: A long position is opened when the MACD line crosses over the signal line, and the KDJ’s %K crosses above %D.
Additions (Martingale): After the initial long position, new positions are added if the price drops by the defined percentage, and each new addition is increased using the Multiplier. This continues up to the set Max Additions.
Short Trades:
Entry Condition: A short position is opened when the MACD line crosses under the signal line, and the KDJ’s %K crosses below %D.
Additions (Martingale): After the initial short position, new positions are added if the price rises by the defined percentage, and each new addition is increased using the Multiplier.
Exit Conditions:
Take Profit: Exits are triggered when the price reaches the take-profit threshold.
Stop Loss: If the price moves unfavorably, the position will be closed at the set stop-loss level.
Trailing Stop: Adjusts dynamically as the price moves in favor of the trade to lock in profits.
On-Chart Visuals:
Long Signals: Blue triangles below the bars indicate long entries, and green triangles mark additional long positions.
Short Signals: Red triangles above the bars indicate short entries, and orange triangles mark additional short positions.
Information Table:
The strategy displays a table with key metrics:
Open Price: The entry price of the trade.
Average Price: The average price of the current position.
Additions: The number of additional positions taken.
Next Add Price: The price level for the next position.
Take Profit: The price at which profits will be taken.
Stop Loss: The stop-loss level to minimize risk.
Usage Instructions:
Adjust the parameters to your trading style using the input settings.
The Multiplier amplifies your position size after each addition, so use it cautiously, especially in volatile markets.
Monitor the signals and table on the chart for entry/exit decisions and trade management.

Adaptive KDJ (MTF)Hey guys,
this is an adaptive MTF KDJ oscillator.
Pick up to 3 different timeframes, choose a weighting if you want and enjoy the beautiful signals it will show you.
The length of every timeframe is adaptive and based of the timeframe's ATR.
The plot shows the smoothed average of the 3 KDJ values.
Large triangles show KDJ crossings.
Small triangles show anticipations of possible crossings.
I found out it works best with 1m, 5m, 15m and weighting=1 for forex scalping in 1m.
Use other indicators for confluence.

ICHIMOKU Crypto Swing StrategyThis is a crypto swing strategy designed for timeframes bigger than 1h.
The main components are
ICHOMOKU
KDJ
Average High
Average Low
Rules for entry
For long: we have the ichimoku crosses between tenkan and baselines, we have a rising kdj line and at the same time we have a increase in the average high
For short: we have the ichimoku crosses between tenkan and baselines, we have a falling kdj line and at the same time we have an increase in the average low
Rules for exit
We exit when we have inverse conditions than the initial ones used for entry.
Caution
This strategy does not use a risk management, so be careful with it !
If you have any questions let me know !

Defu_RSIThis is a composite indicator, a collection of multiple indicators.
Includes:
1. in the simple RSI oversold and overbought area, I rewritten the RSI index of pine, which is more in line with the change of the relative intensity of rise and fall.
2. the red and green column line to the top is rewritten by William w% index. The red and green column indicates the top of the stage. When the column line disappears, it indicates the top of the stage. It is very reliable.
3. CCI green line: calculate CCI index through EMA weighting, smooth CCI curve and reflect trend change.
4. the j-link of KDJ variant indicates the real-time change of trend, which is used in conjunction with CCI index. Please observe carefully
5. the intra day fluctuation indicator is represented by a red orange column line below the 0 axis, and a simple filter is added to indicate the turning point of the trend.
I will continue to update when I have time
//==============The above is translated by Google , please pass the administrator
这是个复合指标,是多个指标的集合。
包含有 1. 简单RSI超卖超买区,我改写了pine自带的rsi指标,这个更加符合涨跌相对强度的变化。
2.到顶红绿柱线,由威廉W%指标改写,红绿柱表示阶段的顶部,当柱线消失时,表示阶段顶部,非常可靠。
3. CCI 绿色线,通过ema加权计算CCI指标,平滑CCI曲线,反应趋势变化。
4.用KDJ变种的J线连表示趋势的即时变化,这个配合CCI指标使用。请仔细观察
5.日内波动指示器,在0轴下方用红橙柱线表示,加了简单的过滤器,表示趋势的转折点。


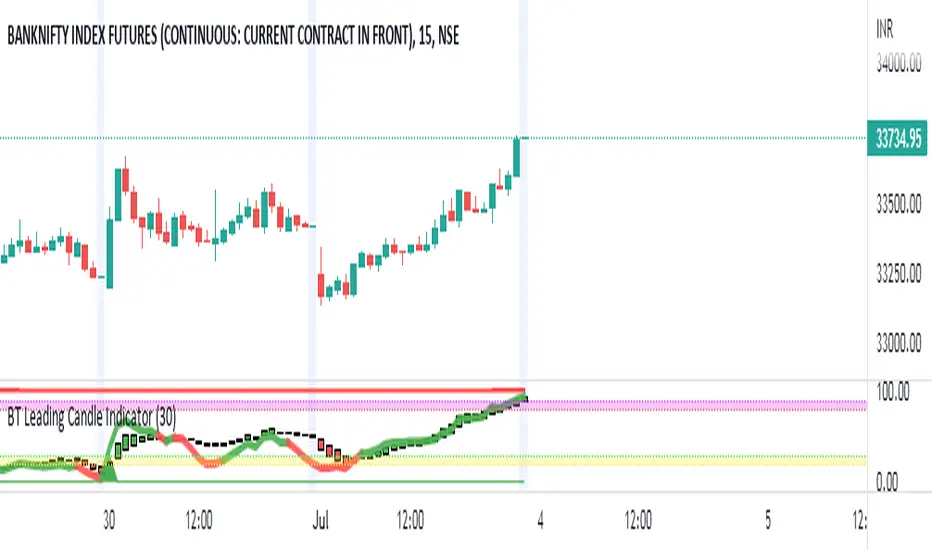
BT Leading Candle IndicatorThe oscillator display consists of 3 lines (K, D and J - hence the name of the display) and 2 levels. K and D are the same lines you see when using the stochastic oscillator. The J line in turn represents the deviation of the D value from the K value. The convergence of these lines indicates new trading opportunities. Just like the Stochastic Oscillator, oversold and overbought levels correspond to the times when the trend is likely to reverse.
Function
BT Leading KDJ Candle Indicator use candles to indicate KD relationship. E.g. yellow candles for bull (K>=D) and fuchsia candles for bear (K=D and fuchsia for K KDJ K value
d --> KDJ D value
buysig --> KD buy signal in green triangle
selsig --> KD sell signal in red triangle
leadingline --> colorful leading line for KDJ
Pros and Cons
Pros:
1. Candle height can indicates the strength of trend and different colors are used for indicating KD relationship
2. a leading line is added as aux method to confirm KDJ signal
Cons:
1. It may satruate for extreme conditions of long and short as described in the chart, which is inherent KDJ shortcoming.
2. Not accurate for long and short entries and need filtering out noise and fake signal.
Remarks
More direct to observe and confirm trend with the leading line.
Read me
In real life, I am a prolific inventor. I have successfully applied for more than 60 international and regional patents in the past 12 years. But in the past two years or so, I have tried to transfer my creativity to the development of trading strategies. Trading view is the ideal platform for me. I am selecting and contributing some of the hundreds of scripts to publish in Trading view community. Welcome everyone to interact with me to discuss these interesting pine scripts.
The scripts posted are categorized into 5 levels according to my efforts or man hours put into these works.
Level 1 : interesting script snippets or distinctive improvement from classic indicators or strategy. Level 1 scripts can usually appear in more complex indicators as a function module or element.
Level 2 : composite indicator/strategy. By selecting or combining several independent or dependent functions or sub indicators in proper way, the composite script exhibits a resonance phenomenon which can filter out noise or fake trading signal to enhance trading confidence level.
Level 3 : comprehensive indicator/strategy. They are simple trading systems based on my strategies. They are commonly containing several or all of entry signal, close signal, stop loss, take profit, re-entry, risk management, and position sizing techniques. Even some interesting fundamental and mass psychological aspects are incorporated.
Level 4 : script snippets or functions that do not disclose source code. Interesting element that can reveal market laws and work as raw material for indicators and strategies. If you find Level 1~2 scripts are helpful, Level 4 is a private version that took me far more efforts to develop.
Level 5 : indicator/strategy that do not disclose source code. private version of Level 3 script with my accumulated script processing skills or a large number of custom functions. I had a private function library built in past two years. Level 5 scripts use many
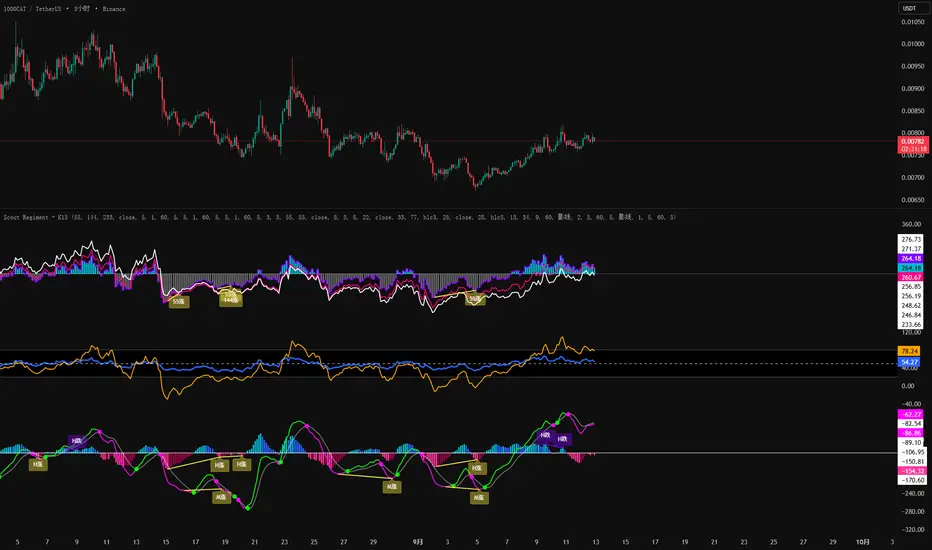
SCTI-RSKSCTI-RSK 是一个多功能技术指标合集,整合了多种常用技术指标于一个图表中,方便交易者综合分析市场状况。该指标包含以下五个主要技术指标模块,每个模块都可以单独显示或隐藏:
Stoch RSI - 随机相对强弱指数
KDJ - 随机指标
RSI - 相对强弱指数
CCI - 商品通道指数
Williams %R - 威廉指标
主要特点
模块化设计:每个指标都可以单独开启或关闭显示
交叉信号可视化:Stoch RSI和KDJ的金叉/死叉信号有彩色填充标识
多时间框架分析:支持不同长度的参数设置
直观界面:清晰的参数分组和颜色区分
适用场景
趋势判断
超买超卖区域识别
交易信号确认
多指标共振分析
English Description
SCTI-RSK is a comprehensive technical indicator that combines multiple popular indicators into a single chart for traders to analyze market conditions holistically. The indicator includes the following five main technical indicator modules, each can be toggled on/off individually:
Stoch RSI - Stochastic Relative Strength Index
KDJ - Stochastic Oscillator
RSI - Relative Strength Index
CCI - Commodity Channel Index
Williams %R - Williams Percent Range
Key Features
Modular Design: Each indicator can be shown or hidden independently
Visual Crossover Signals: Golden/Death crosses are highlighted with color fills for Stoch RSI and KDJ
Multi-Timeframe Analysis: Supports different length parameters
Intuitive Interface: Clear parameter grouping and color differentiation
Use Cases
Trend identification
Overbought/Oversold zone recognition
Trade signal confirmation
Multi-indicator confluence analysis
参数说明 (Parameter Explanation)
指标参数分为6个主要组别:
基础指标设置 - 控制各指标的显示/隐藏
Stoch RSI 设置 - 包括K值、D值、RSI长度等参数
KDJ 设置 - 包括周期、信号线等参数
RSI 设置 - 包括RSI长度、中期长度等参数
CCI 设置 - 包括CCI长度、中期长度等参数
Williams %R 设置 - 包括长度参数
使用建议 (Usage Suggestions)
初次使用时,可以先开启所有指标观察它们的相互关系
根据个人交易风格调整各指标的长度参数
关注多指标同时发出信号时的交易机会
结合价格行为和其他分析工具确认信号
更新日志 (Changelog)
v1.0 初始版本,整合五大技术指标
[blackcat] L3 Swing Whale CatcherLevel 3
Background
Whale catcher is a resonance indicator combining both customized MACD and customized KDJ. It use two resonance bands to identify oppotunities of middle-short term.
Function
When we use MACD and KDJ alone, in the trend market, the prices are arranged in the order of the moving average, and the operation is simple and the profit space is large. The MACD and KDJ diverge from reality and can be a good catch of trend reversal tops and bottoms. The disadvantage of this system is also very serious. In the volatile market, the moving average fails, and the false divergence of MACD and KDJ has become a contrarian operation. Everyone should know the degree of danger of contrarian operations in a unilateral market.
Therefore, this indicator can confirm each other by improving the performance of the separate MACD and KDJ and combining the two in one main chart. When the two resonate, a more reliable signal can be prompted.
In order to adapt to different time periods, I designed a look-up table (LUT) that automatically assigns parameters according to the icon period. It can make this indicator more stable over different time periods.
The green and purple ribbons are the trend lines of the customized version of MACD, and the red and blue ribbons are the trend lines of the customized version of KDJ. In most cases, the two trends are different, but obviously KDJ is more sensitive than MACD and is suitable for judging entry and exit points. MACD is more likely to see large-scale trends. When the two are combined, the judgment can be strengthened. For example, use the logical AND operation to combine the two.
Finally, except for the two fast and slow line combinations of MACD and KDJ. I also plot the difference column of the two. Because the performance of the two sub-levels represented by the difference bar is more conducive to obtaining the information of the trend reversal in advance. The dark green above zero and the dark red below zero are the differential columns of KDJ. Four-color difference offline is the difference column of MACD. In this way, it is not easy to be confused by the graphic expression, I hope you like it.
Remarks
Feedbacks are appreciated.

pandas_taLibrary "pandas_ta"
Level: 3
Background
Today is the first day of 2022 and happy new year every tradingviewers! May health and wealth go along with you all the time. I use this chance to publish my 1st PINE v5 lib : pandas_ta
This is not a piece of cake like thing, which cost me a lot of time and efforts to build this lib. Beyond 300 versions of this script was iterated in draft.
Function
Library "pandas_ta"
PINE v5 Counterpart of Pandas TA - A Technical Analysis Library in Python 3 at github.com
The Original Pandas Technical Analysis (Pandas TA) is an easy to use library that leverages the Pandas package with more than 130 Indicators and Utility functions and more than 60 TA Lib Candlestick Patterns.
I realized most of indicators except Candlestick Patterns because tradingview built-in Candlestick Patterns are even more powerful!
I use this to verify pandas_ta python version indicators for myself, but I realize that maybe many may need similar lib for pine v5 as well.
Function Brief Descriptions (Pls find details in script comments)
bton --> Binary to number
wcp --> Weighted Closing Price (WCP)
counter --> Condition counter
xbt --> Between
ebsw --> Even Better SineWave (EBSW)
ao --> Awesome Oscillator (AO)
apo --> Absolute Price Oscillator (APO)
xrf --> Dynamic shifted values
bias --> Bias (BIAS)
bop --> Balance of Power (BOP)
brar --> BRAR (BRAR)
cci --> Commodity Channel Index (CCI)
cfo --> Chande Forcast Oscillator (CFO)
cg --> Center of Gravity (CG)
cmo --> Chande Momentum Oscillator (CMO)
coppock --> Coppock Curve (COPC)
cti --> Correlation Trend Indicator (CTI)
dmi --> Directional Movement Index(DMI)
er --> Efficiency Ratio (ER)
eri --> Elder Ray Index (ERI)
fisher --> Fisher Transform (FISHT)
inertia --> Inertia (INERTIA)
kdj --> KDJ (KDJ)
kst --> 'Know Sure Thing' (KST)
macd --> Moving Average Convergence Divergence (MACD)
mom --> Momentum (MOM)
pgo --> Pretty Good Oscillator (PGO)
ppo --> Percentage Price Oscillator (PPO)
psl --> Psychological Line (PSL)
pvo --> Percentage Volume Oscillator (PVO)
qqe --> Quantitative Qualitative Estimation (QQE)
roc --> Rate of Change (ROC)
rsi --> Relative Strength Index (RSI)
rsx --> Relative Strength Xtra (rsx)
rvgi --> Relative Vigor Index (RVGI)
slope --> Slope
smi --> SMI Ergodic Indicator (SMI)
sqz* --> Squeeze (SQZ) * NOTE: code sufferred from very strange error, code was commented.
sqz_pro --> Squeeze PRO(SQZPRO)
xfl --> Condition filter
stc --> Schaff Trend Cycle (STC)
stoch --> Stochastic (STOCH)
stochrsi --> Stochastic RSI (STOCH RSI)
trix --> Trix (TRIX)
tsi --> True Strength Index (TSI)
uo --> Ultimate Oscillator (UO)
willr --> William's Percent R (WILLR)
alma --> Arnaud Legoux Moving Average (ALMA)
xll --> Dynamic rolling lowest values
dema --> Double Exponential Moving Average (DEMA)
ema --> Exponential Moving Average (EMA)
fwma --> Fibonacci's Weighted Moving Average (FWMA)
hilo --> Gann HiLo Activator(HiLo)
hma --> Hull Moving Average (HMA)
hwma --> HWMA (Holt-Winter Moving Average)
ichimoku --> Ichimoku Kinkō Hyō (ichimoku)
jma --> Jurik Moving Average Average (JMA)
kama --> Kaufman's Adaptive Moving Average (KAMA)
linreg --> Linear Regression Moving Average (linreg)
mgcd --> McGinley Dynamic Indicator
rma --> wildeR's Moving Average (RMA)
sinwma --> Sine Weighted Moving Average (SWMA)
ssf --> Ehler's Super Smoother Filter (SSF) © 2013
supertrend --> Supertrend (supertrend)
xsa --> X simple moving average
swma --> Symmetric Weighted Moving Average (SWMA)
t3 --> Tim Tillson's T3 Moving Average (T3)
tema --> Triple Exponential Moving Average (TEMA)
trima --> Triangular Moving Average (TRIMA)
vidya --> Variable Index Dynamic Average (VIDYA)
vwap --> Volume Weighted Average Price (VWAP)
vwma --> Volume Weighted Moving Average (VWMA)
wma --> Weighted Moving Average (WMA)
zlma --> Zero Lag Moving Average (ZLMA)
entropy --> Entropy (ENTP)
kurtosis --> Rolling Kurtosis
skew --> Rolling Skew
xev --> Condition all
zscore --> Rolling Z Score
adx --> Average Directional Movement (ADX)
aroon --> Aroon & Aroon Oscillator (AROON)
chop --> Choppiness Index (CHOP)
xex --> Condition any
cksp --> Chande Kroll Stop (CKSP)
dpo --> Detrend Price Oscillator (DPO)
long_run --> Long Run
psar --> Parabolic Stop and Reverse (psar)
short_run --> Short Run
vhf --> Vertical Horizontal Filter (VHF)
vortex --> Vortex
accbands --> Acceleration Bands (ACCBANDS)
atr --> Average True Range (ATR)
bbands --> Bollinger Bands (BBANDS)
donchian --> Donchian Channels (DC)
kc --> Keltner Channels (KC)
massi --> Mass Index (MASSI)
natr --> Normalized Average True Range (NATR)
pdist --> Price Distance (PDIST)
rvi --> Relative Volatility Index (RVI)
thermo --> Elders Thermometer (THERMO)
ui --> Ulcer Index (UI)
ad --> Accumulation/Distribution (AD)
cmf --> Chaikin Money Flow (CMF)
efi --> Elder's Force Index (EFI)
ecm --> Ease of Movement (EOM)
kvo --> Klinger Volume Oscillator (KVO)
mfi --> Money Flow Index (MFI)
nvi --> Negative Volume Index (NVI)
obv --> On Balance Volume (OBV)
pvi --> Positive Volume Index (PVI)
dvdi --> Dual Volume Divergence Index (DVDI)
xhh --> Dynamic rolling highest values
pvt --> Price-Volume Trend (PVT)
Remarks
I also incorporated func descriptions and func test script in commented mode, you can test the functino with the embedded test script and modify them as you wish.
This is a Level 3 free and open source indicator library.
Feedbacks are appreciated.
This is not the end of pandas_ta lib publication, but it is start point with pine v5 lib function and I will add more and more funcs into this lib for my own indicators.
Function Name List:
bton()
wcp()
count()
xbt()
ebsw()
ao()
apo()
xrf()
bias()
bop()
brar()
cci()
cfo()
cg()
cmo()
coppock()
cti()
dmi()
er()
eri()
fisher()
inertia()
kdj()
kst()
macd()
mom()
pgo()
ppo()
psl()
pvo()
qqe()
roc()
rsi()
rsx()
rvgi()
slope()
smi()
sqz_pro()
xfl()
stc()
stoch()
stochrsi()
trix()
tsi()
uo()
willr()
alma()
wcx()
xll()
dema()
ema()
fwma()
hilo()
hma()
hwma()
ichimoku()
jma()
kama()
linreg()
mgcd()
rma()
sinwma()
ssf()
supertrend()
xsa()
swma()
t3()
tema()
trima()
vidya()
vwap()
vwma()
wma()
zlma()
entropy()
kurtosis()
skew()
xev()
zscore()
adx()
aroon()
chop()
xex()
cksp()
dpo()
long_run()
psar()
short_run()
vhf()
vortex()
accbands()
atr()
bbands()
donchian()
kc()
massi()
natr()
pdist()
rvi()
thermo()
ui()
ad()
cmf()
efi()
ecm()
kvo()
mfi()
nvi()
obv()
pvi()
dvdi()
xhh()
pvt()

Six Meridian Divine Swords [theUltimator5]The Six Meridian Divine Sword is a legendary martial arts technique in the classic wuxia novel “Demi-Gods and Semi-Devils” (天龙八部) by Jin Yong (金庸). The technique uses powerful internal energy (qi) to shoot invisible sword-like energy beams from the six meridians of the hand. Each of the six fingers/meridians corresponds to a “sword,” giving six different sword energies.
The Six Meridian Divine Swords indicator is a compact “signal dashboard” that fuses six classic indicators (fingers)—MACD, KDJ, RSI, LWR (Williams %R), BBI, and MTM—into one pane. Each row is a traffic-light dot (green/bullish, red/bearish, gray/neutral). When all six align, the script draws a confirmation line (“All Bullish” or “All Bearish”). It’s designed for quick consensus reads across trend, momentum, and overbought/oversold conditions.
How to Read the Dashboard
The pane has 6 horizontal rows (explained in depth later):
MACD
KDJ
RSI
LWR (Larry Williams %R)
BBI (Bull & Bear Index)
MTM (Momentum)
Each tick in the row is a dot, with sentiment identified by a color.
Green = bullish condition met
Red = bearish condition met
Gray = inside a neutral band (filtering chop), shown when Use Neutral (Gray) Colors is ON
There are two lines that track the dots on the top or bottom of the pane.
All Bullish Signal Line: appears only if all 6 are strongly bullish (default color = white)
All Bearish Signal Line: appears only if all 6 are strongly bearish (default color = fuchsia)
The Six Meridians (Indicators) — What They Mean:
1) MACD — Trend & Momentum
What it is: A trend-following momentum indicator based on the relationship between two moving averages (typically 12-EMA and 26-EMA)
Logic used: Classic MACD line (EMA12−EMA26) vs its 9-EMA signal.
Bullish: MACD > Signal and |MACD−Signal| > Neutral Threshold
Bearish: MACD < Signal and |diff| > threshold
Neutral: |diff| ≤ threshold
Why: Small crosses can whipsaw. The neutral band ignores tiny separations to reduce noise.
Inputs: Fast/Slow/Signal lengths, Neutral Threshold.
2) KDJ — Stochastic with J-line boost
What it is: A variation of the stochastic oscillator popular in Chinese trading systems
Logic used: K = SMA(Stochastic, smooth), D = SMA(K, smooth), J = 3K − 2D.
Bullish: K > D and |K−D| > 2
Bearish: K < D and |K−D| > 2
Neutral: |K−D| ≤ 2
Why: K–D separation filters tiny wiggles; J offers an “extreme” early-warning context in the value label.
Inputs: Length, Smoothing.
3) RSI — Momentum balance (0–100)
What it is: A momentum oscillator measuring speed and magnitude of price changes (0–100)
Logic used: RSI(N).
Bullish: RSI > 50 + Neutral Zone
Bearish: RSI < 50 − Neutral Zone
Neutral: Between those bands
Why: Centerline/adaptive bands (around 50) give a directional bias without relying on fixed 70/30.
Inputs: Length, Neutral Zone (± around 50).
4) LWR (Williams %R) — Overbought/Oversold
What it is: An oscillator similar to stochastic, measuring how close the close is to the high-low range over N periods
Logic used: %R over N bars (0 to −100).
Bullish: %R > −50 + Neutral Zone
Bearish: %R < −50 − Neutral Zone
Neutral: Between those bands
Why: Uses a centered band around −50 instead of only −20/−80, making it act like a directional filter.
Inputs: Length, Neutral Zone (± around −50).
5) BBI (Bull & Bear Index) — Smoothed trend bias
What it is: A composite moving average, essentially the average of several different moving averages (often 3, 6, 12, 24 periods)
Logic used: Average of 4 SMAs (3/6/12/24 by default):
BBI = (MA3 + MA6 + MA12 + MA24) / 4
Bullish: Close > BBI and |Close−BBI| > 0.2% of BBI
Bearish: Close < BBI and |diff| > threshold
Neutral: |diff| ≤ threshold
Why: Multiple MAs blended together reduce single-MA whipsaw. A dynamic 0.2% band ignores tiny drift.
Inputs: 4 lengths (default 3/6/12/24). Threshold is auto-scaled at 0.2% of BBI.
6) MTM (Momentum) — Rate of change in price
What it is: A simple measure of rate of change
Logic used: MTM = Close − Close
Bullish: MTM > 0.5% of Close
Bearish: MTM < −0.5% of Close
Neutral: |MTM| ≤ threshold
Why: A percent-based gate adapts across prices (e.g., $5 vs $500) and mutes insignificant moves.
Inputs: Length. Threshold auto-scaled to 0.5% of current Close.
Display & Inputs You Can Tweak
🎨 Use Neutral (Gray) Colors
ON (default): 3-color mode with clear “no-trade”/“weak” states.
OFF: classic binary (green/red) without neutral filtering.
