ICHIMOKU Crypto Swing AlertThis is a crypto swing alert for the strategy with the same name designed for timeframes bigger than 1h.
The main components are
ICHOMOKU
KDJ
Average High
Average Low
Rules for entry
For long: we have the ichimoku crosses between tenkan and baselines, we have a rising kdj line and at the same time we have a increase in the average high
For short: we have the ichimoku crosses between tenkan and baselines, we have a falling kdj line and at the same time we have an increase in the average low
Rules for exit
We exit when we have inverse conditions than the initial ones used for entry.
Caution
This strategy does not use a risk management, so be careful with it !
If you have any questions let me know !
在脚本中搜索"KDJ+股票技术分析"

L1 Buy after Dump DetectorLevel: 1
Background
The so-called "Buy after Dump" refers to the phenomenon in which the stock price sometimes rebounds temporarily due to the rapid decline in the falling market. The rebound was smaller than the decline, and the downtrend resumed after the rebound.
Function
L1 Buy after Dump Detector is one of my research to see win rate of a "Buy after Dump" chance. The principle is that I use ema() and OHLC to model a whale dump behavior. After the dump wave, I use KDJ to indicate several long entry points.
Key Signal
dump --> whale dump signal
fundready --> it indicate the end of a dump and make fund ready to long entry
longentry --> long entry signal generated from KDJ resonating with dump and fundready signal
Pros and Cons
Pros:
1. it can detect obvious dump and depict the decay of dump wave
2. use resonance to generate long entry
Cons:
1. it may be risky to "buy after dump" which may require take profit method here because the opportunity may be very short
2. KDJ is too sensitive in large time frame and have many long entry signals (the closer to dump wave, the better based on experience)
Remarks
Very interesing stuff, but rare of people trade with such crazy method. I suggest this is ONLY for backtest study of market behavior.
Readme
In real life, I am a prolific inventor. I have successfully applied for more than 60 international and regional patents in the past 12 years. But in the past two years or so, I have tried to transfer my creativity to the development of trading strategies. Tradingview is the ideal platform for me. I am selecting and contributing some of the hundreds of scripts to publish in Tradingview community. Welcome everyone to interact with me to discuss these interesting pine scripts.
The scripts posted are categorized into 5 levels according to my efforts or manhours put into these works.
Level 1 : interesting script snippets or distinctive improvement from classic indicators or strategy. Level 1 scripts can usually appear in more complex indicators as a function module or element.
Level 2 : composite indicator/strategy. By selecting or combining several independent or dependent functions or sub indicators in proper way, the composite script exhibits a resonance phenomenon which can filter out noise or fake trading signal to enhance trading confidence level.
Level 3 : comprehensive indicator/strategy. They are simple trading systems based on my strategies. They are commonly containing several or all of entry signal, close signal, stop loss, take profit, re-entry, risk management, and position sizing techniques. Even some interesting fundamental and mass psychological aspects are incorporated.
Level 4 : script snippets or functions that do not disclose source code. Interesting element that can reveal market laws and work as raw material for indicators and strategies. If you find Level 1~2 scripts are helpful, Level 4 is a private version that took me far more efforts to develop.
Level 5 : indicator/strategy that do not disclose source code. private version of Level 3 script with my accumulated script processing skills or a large number of custom functions. I had a private function library built in past two years. Level 5 scripts use many of them to achieve private trading strategy.

RSI with J-Line ***For ease of use, I recommend changing the J Histogram to a line indicator, then it works like the KDJ Stochastic indicator. Full disclosure, I created this script with the help of GPT. This script was inspired by the KDJ Stochastic indicator by Dreadblitz***
The "RSI with J-Line" script is essentially a modified Relative Strength Index (RSI) indicator with an added histogram component. Here's how to use the different components of the script:
RSI Line (Blue): The RSI is a momentum oscillator that measures the speed and change of price movements. It oscillates between zero and 100, and is typically used to identify overbought and oversold conditions in a market. Traditionally, readings over 70 are considered overbought, and readings under 30 are considered oversold. However, these are not strict rules and can vary depending on the market and the overall trend.
RSI Smooth Line (Orange): This is the simple moving average of the RSI. It helps to smooth out the RSI and to identify the overall trend of the momentum. When the RSI line crosses above the RSI Smooth line, it might indicate that the momentum is moving upwards. When the RSI line crosses below the RSI Smooth line, it might indicate that the momentum is moving downwards.
RSI J-Line (Red Histogram): The J-Line is an additional line that's calculated as 3*rsiSmooth - 2*rsi. It's similar to the %J line in the Stochastic indicator and is designed to provide quicker signals than the RSI or RSI Smooth line. When the histogram is above the 0 line, it might indicate bullish momentum. When it's below the 0 line, it might indicate bearish momentum.
Please note that these interpretations are standard for these types of indicators, but actual market behavior can be complex and is influenced by many factors. Indicators should be used as part of a comprehensive trading strategy, not in isolation. Always take into account other market information and indicators before making trading decisions.

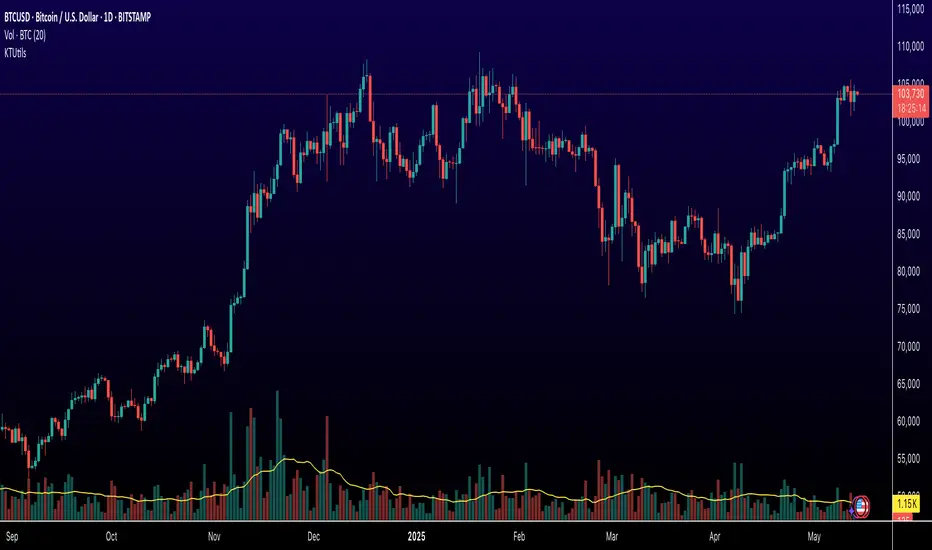
KTUtilsLibrary "KTUtils"
Utility functions for technical analysis indicators, trend detection, and volatility confirmation.
MGz(close, length)
MGz
@description Moving average smoother used for signal processing
Parameters:
close (float) : float Price input (typically close)
length (int) : int Length of smoothing period
Returns: float Smoothed value
atrConf(length)
atrConf
@description Calculates Average True Range (ATR) for volatility confirmation
Parameters:
length (simple int) : int Length for ATR calculation
Returns: float ATR value
f(input)
f
@description Simple Moving Average with fixed length
Parameters:
input (float) : float Input value
Returns: float Smoothed average
bcwSMA(s, l, m)
bcwSMA
@description Custom smoothing function with weight multiplier
Parameters:
s (float) : float Signal value
l (int) : int Length of smoothing
m (int) : int Weighting multiplier
Returns: float Smoothed output
MGxx(close, length)
MGxx
@description Custom Weighted Moving Average (WMA) variant
Parameters:
close (float) : float Price input
length (int) : int Period length
Returns: float MGxx smoothed output
_PerChange(lengthTime)
_PerChange
@description Measures percentage price change over a period and range deviation
Parameters:
lengthTime (int) : int Period for change measurement
Returns: tuple Measured change, high deviation, low deviation
dirmov(len)
dirmov
@description Calculates directional movement components
Parameters:
len (simple int) : int Lookback period
Returns: tuple Plus and Minus DI values
adx(dilen, adxlen)
adx
@description Calculates Average Directional Index (ADX)
Parameters:
dilen (simple int) : int Length for DI calculation
adxlen (simple int) : int Length for ADX smoothing
Returns: float ADX value
trChopAnalysis()
trChopAnalysis
@description Identifies chop and trend phases based on True Range Bollinger Bands
Returns: tuple TR SMA, chop state, trending state
wtiAnalysis(haclose, close, filterValue)
wtiAnalysis
@description Wave Trend Indicator (WTI) with signal crossover logic
Parameters:
haclose (float) : float Heikin-Ashi close
close (float) : float Standard close
filterValue (simple int) : int Smoothing length
Returns: tuple WTI lines and direction states
basicTrend(hahigh, halow, close, open, filterValue)
basicTrend
@description Determines trend direction based on HA high/low and close
Parameters:
hahigh (float) : float Heikin-Ashi high
halow (float) : float Heikin-Ashi low
close (float) : float Standard close
open (float) : float Standard open
filterValue (simple int) : int Smoothing period
Returns: tuple Uptrend, downtrend flags
metrics(close, filterValue)
metrics
@description Common market metrics
Parameters:
close (float) : float Price input
filterValue (int) : int RSI smoothing length
Returns: tuple VWMA, SMA10, RSI, smoothed RSI
piff(close, trend_change)
piff
@description Price-Informed Forward Forecasting (PIFF) model for trend strength
Parameters:
close (float) : float Price input
trend_change (float) : float Change in trend
Returns: tuple Percent change, flags for trend direction
getMACD()
getMACD
@description Returns MACD, signal line, and histogram
Returns: tuple MACD line, Signal line, Histogram
getStoch()
getStoch
@description Returns K and D lines of Stochastic Oscillator
Returns: tuple K and D lines
getKDJ()
getKDJ
@description KDJ momentum oscillator
Returns: tuple K, D, J, Average
getBBRatio()
getBBRatio
@description Bollinger Band Ratio (BBR) and signal flags
Returns: tuple Basis, Upper, Lower, BBR, BBR Up, BBR Down
getSupertrend()
getSupertrend
@description Supertrend values and direction flags
Returns: tuple Supertrend, Direction, Up, Down
Bullish/Bearish Volume Indicator ABDJO1- red bars are bearish volume
2- yellow bars are a weakness of bearish volume.
3-green bars are a strong bullish volume.
4-Orange bars are a weakness of bullish volume.
1. Price Movements
The chart does not explicitly show price movements, but the volume bars can give us indirect clues. Typically, a transition from green (strong bullish volume) to red (bearish volume) suggests a potential reversal from an uptrend to a downtrend. The presence of orange bars (weakness of bullish volume) following green bars indicates a decrease in buying momentum, which often precedes a price decline.
2. Trading Volume
Green Bars: Represent strong bullish volume, indicating strong buying interest.
Orange Bars: Indicate a weakening of bullish volume, suggesting that buyers are losing strength or interest at higher price levels.
Yellow Bars: Represent a weakening of bearish volume, which could indicate that selling pressure is decreasing and a potential reversal or stabilization in price might occur.
Red Bars: Signify strong bearish volume, indicating strong selling pressure.
3. Price-Volume Relationship
The transition from green to orange and then to red bars shows a typical pattern where initial strong buying interest (green) is followed by a decrease in buyer enthusiasm (orange), and eventually overtaken by sellers (red). This pattern often corresponds to a peak in prices followed by a reversal to the downside.
4. Technical Indicators
Without specific price data, traditional indicators like MA (Moving Averages), MACD (Moving Average Convergence Divergence), or KDJ (Stochastic Oscillator) cannot be calculated directly. However, the volume pattern itself can be used as a rudimentary momentum indicator, with decreasing bullish volume (orange) and increasing bearish volume (red) suggesting a bearish momentum.
5. Support and Resistance Levels
Support Level: Could be hypothesized near the transition point from yellow to green bars, where buyers previously started to overpower sellers.
Resistance Level: Likely near the transition from green to orange bars, where sellers begin to regain control and buying momentum fades.
6. Overall Trend Patterns
The overall trend, inferred from the volume bars, suggests a bullish phase losing momentum and transitioning into a bearish phase. This is typical of a market top where buying interest wanes and sellers begin to dominate.
7. Future Projections and Recommendations
Given the observed shift from bullish to bearish volume, there is a higher likelihood of a downward price movement in the near term. Investors should consider this a potential sell signal, especially as bearish volume (red bars) increases. Caution is advised for buyers, and it might be prudent for holders to take profits or set stop-loss orders to protect against potential declines.

[blackcat] L3 SuperJThe SuperJ indicator is a powerful tool that utilizes VWMA (Volume Weighted Moving Average) and ALMA (Arnaud Legoux Moving Average) to filter and enhance the KDJ indicator, resulting in a smoother J line and the creation of the SuperJ indicator. By incorporating TVMA (Triggered Volume Moving Average), the SuperJ indicator can generate trigger signals that can form bullish and bearish crossovers with the J line, creating an oscillating pattern.
The combination of VWMA and ALMA helps to remove noise from the market and provides clearer trading signals. This is particularly useful when the market is highly volatile or the trend is ambiguous. The oscillations of the J line can help traders identify the true trend and avoid being misled by false signals.
Furthermore, by considering the values and trends of the J line in conjunction with other technical analysis tools, traders can make more accurate assessments of market trends and price movements. For example, when combined with moving averages, the SuperJ indicator can enhance the ability to identify price reversal points.
The SuperJ indicator also offers benefits in assessing overbought and oversold conditions in the market. By observing the values and trends of the J line, traders can more accurately evaluate market sentiment and strength. When the J line is above 80, it may indicate an overly optimistic market with a risk of overbought conditions. Conversely, when the J line is below 20, it may indicate an overly pessimistic market with an opportunity for oversold conditions. These signals can assist traders in determining when to buy or sell.
In summary, the SuperJ indicator, derived from the combination of VWMA, ALMA, and TVMA, provides traders with a valuable tool for identifying overbought and oversold conditions, predicting price reversals, and generating high-quality trading signals. Its application as a "buy low, sell high" strategy element is highly effective in maximizing trading opportunities and optimizing profitability.

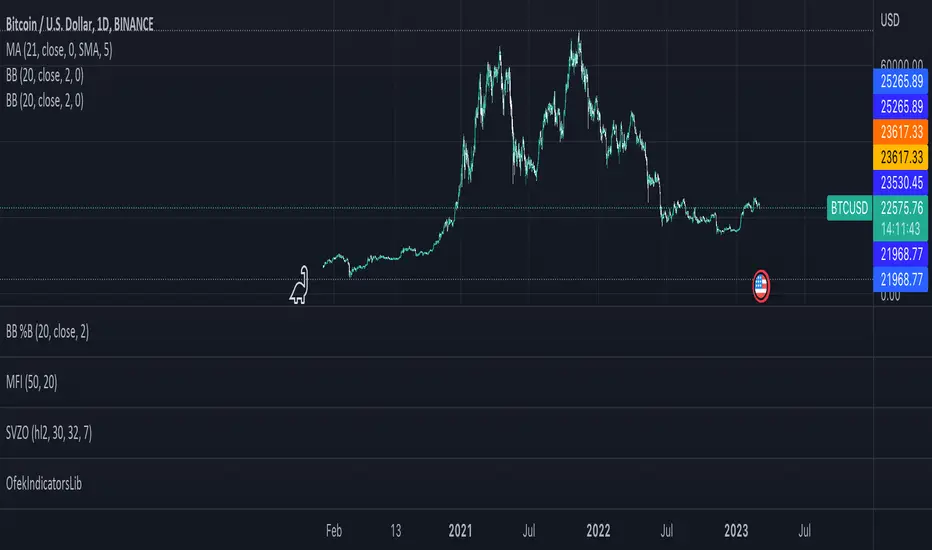
OfekIndicatorsLibLibrary "OfekIndicatorsLib"
TODO: add library description here
ichiClouds(conversionPeriods, basePeriods, laggingSpan2Periods)
Parameters:
conversionPeriods
basePeriods
laggingSpan2Periods
trama(tramaSrc, tramaLength)
Parameters:
tramaSrc
tramaLength
kdj(ilong, isig, startFrom)
Parameters:
ilong
isig
startFrom(look into history)
[blackcat] L3 Jurik MACDLevel: 3
Background
Use Jurik MA to build MACD and many people need to judge the market trend against the main candlestick chart when using MACD .
Function
First of all, the MACD function is built with Jurik MA and ALMA for better performance.
Second, the principle of MACD is the difference between EMA's long-term and short-term values. So, I wonder if it is possible to use EMA to construct a set of candle charts that are similar in proportion to MACD values for overlapping comparisons? Because this can greatly facilitate traders to make quick trend judgments. So I used the 3-8 lines of EMA to simulate the KD of KDJ, constructed a set of candle charts, and generated buying and selling points through conditional constraints. Do you like this MACD + Candlestick chart?
Key Signal
Traditional Jurik MACD output signal
Candlesticks
Near Top --> Top is reached and reversal may happen soon. (fuchsia labels)
Near Bottom --> Bottom is reached and reversal may happen soon. (yellow labels)
Remarks
Feedbacks are appreciated.

Vector ScalerVector Scaler is like Stochastic but it uses a different method to scale the input. The method is very similar to vector normalization but instead of keeping the "vector" we just sum the three points and average them. The blue line is the signal line and the orange line is the smoothed signal line. I have added the "J" line from the KDJ indicator to help spot divergences. Differential mode uses the delta of the input for the calculations. Here are some pictures to help illustrate how this works relative to other popular indicators.
Vector Scaler vs Stochastic
Vector Scaler vs Smooth Stochastic RSI
average set to 100
average set to 200

[blackcat] L3 God Hunter ScalpingLevel 3
Background
An ultra-short scaler that I integrate with multiple custom function implementations. Because of its responsiveness it is suitable for small cycle applications.
Function
The first technical indicator to integrate is the stoch. By combining the stoch indicators of long and short periods, I can not only ensure its high-speed reaction speed, but also be compatible with stability.
The second is the improved KDJ indicator to further strengthen buying and selling conditions. Because the final trend output is relatively fast, I used a variety of long-short conditions to improve adaptability. and minimize noise. It is well known that price fluctuations in small cycles are more random.
The third feature is the classification of buying and selling points, not only through the reversal of the trend curve, but also several other buying and selling point conditions, oversold and overbought signals, signal divergence techniques, etc.
Finally, through the nested RSI, the momentum trend strength of the trend signal is represented by a gradient color to assist in judging whether the reversal point is approaching.
Remarks
For differnent instruments and time frames, overbought and oversold threshold should be adjusted accordingly, or it may not work well.
Feedbacks are appreciated.

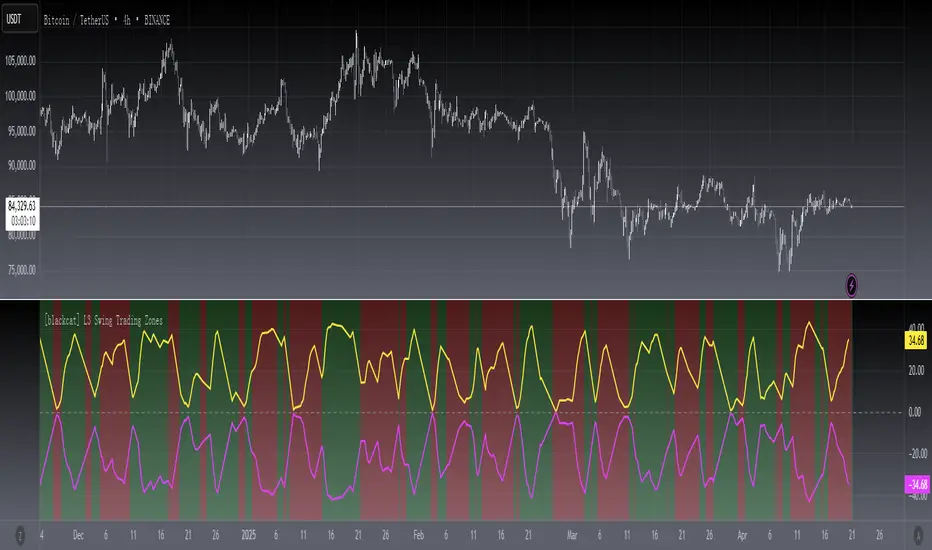
[blackcat] L3 Swing Trading ZonesLevel 3
Background
For swing trading, I consider a combination of multiple technical indicators to indicate periods of long and short positions.
Function
First, judge the daily-level long and short recommendations by the J value of the KDJ indicator in the weekly cycle. in addition. Second, draw bull-bear lines by integrating existing technical indicators such as rsi, adx, cci, dmi, etc. The bull line is above 0, the bear line is below 0, and the other is offsetting each other. When both are relatively close to the zero axis, it means that the strength is equal, and there will be signs of sideways.
Remarks
"D" timeframe ONLY.
Feedbacks are appreciated.
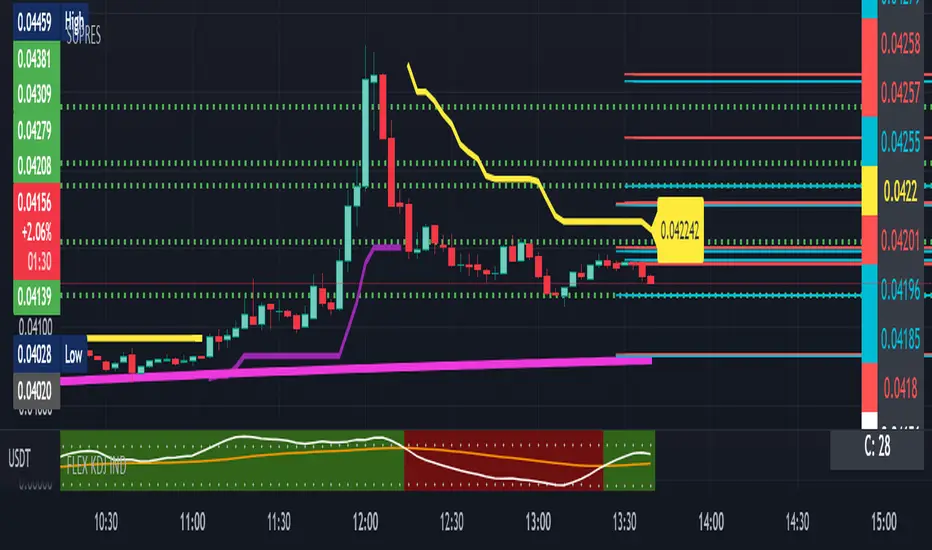
SUPRESHi Dears!
I hope that you enjoyed my "FLEX KDJ IND" till today!
Here, I want to publish one of my other golden indicators for you!
Contents:
+ SUPRES
+ SUPERTREND
+ T.O Line
- SUPRES (SUPPORT/RESISTANCE) is sensitive to trading volumes and with "BACHWARD" you can adjust the length of previous indices in investigation and "MEMORY" is an argument for calling maximum lines that have to be kept for "SUPPORT" and "RESIST".
- SUPERTREND is the normal prepared indicator which is defined in "TRADING VIEW"
-T.O is my suggestion instead of "EMA" to check the phase of session.
I hope that you enjoy this Indicator, please do not forgot to "Warm-It-UP"!
Happy trading,
Shakib
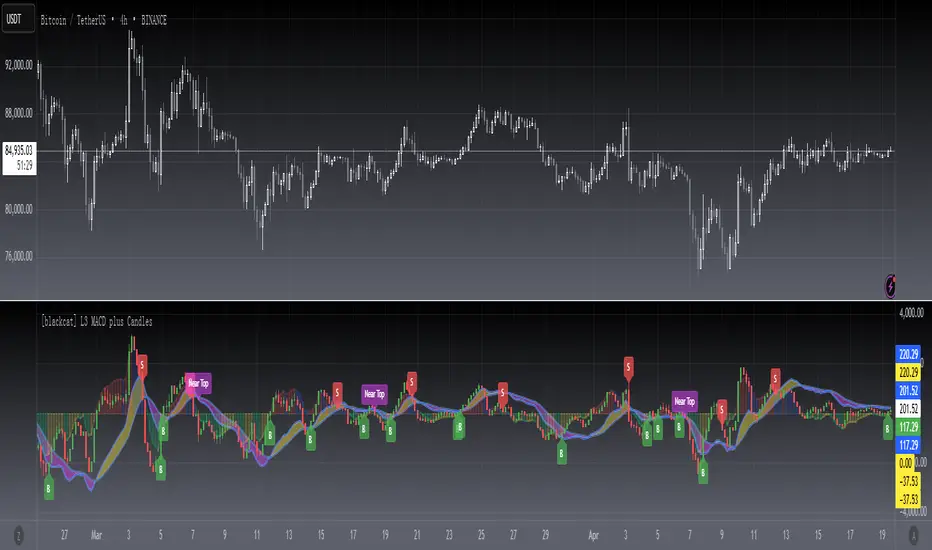
[blackcat] L3 MACD plus CandlesLevel: 3
Background
Many people need to judge the market trend against the main candlestick chart when using MACD.
Function
First of all, the principle of MACD is the difference between EMA's long-term and short-term values. So, I wonder if it is possible to use EMA to construct a set of candle charts that are similar in proportion to MACD values for overlapping comparisons? Because this can greatly facilitate traders to make quick trend judgments. So I used the 3-8 lines of EMA to simulate the KD of KDJ, constructed a set of candle charts, and generated buying and selling points through conditional constraints. Do you like this MACD + Candlestick chart?
Inputs
N/A
Key Signal
Traditional MACD output signal
Candlesticks
Near Top --> Top is reached and reversal may happen soon. (fuchsia labels)
Near Bottom --> Bottom is reached and reversal may happen soon. (yellow labels)
Remarks
This is a Level 3 free and open source indicator.
Feedbacks are appreciated.
Adaptive Ehlers Deviation Scaled Moving Average (AEDSMA)AEDSMA INTRODUCTION
This indicator is a functional enhancement to “Ehlers Deviation Scaled Moving Average (EDSMA / DSMA)”. I’ve used Volume Breakout and Volatility for dynamic length adaption and further Slope too for trend evaluation.
EDSMA was originally developed by John F. Ehlers (Stocks & Commodities V. 36:8: The Deviation-Scaled Moving Average).
IDEA PLACEMENT
I’ve traded almost every kind of market with different volatility conditions using Moving Averages. It was too much of a hassle to select and use different MA length depending upon market trend. So, the journey started with adapting Moving Averages with another parameter and that’s how “MZ SAMA ” came into being where Slope was used to adapt Adaptive Moving Average with trend change. The problem was still pretty much the same as SAMA might not be effective on every market condition. Hence, I worked on Volume to adapt Moving Averages accordingly. I cane up with “MZ RVSI ” which I used in “MZ DVAMA ” to adapt dynamic length in Adaptive Moving Average and also used “MZ RVSI " alongside Slope as confirmation of trend changes.
Meanwhile, I started using DVAMA methodology on different types on Moving Averages that allow dynamic length for example Hull Moving Average, Linear Regression Curve, SMA, WMA, TMA and many more. All of my tested Mas showed too much flexibility because of volume based Adaptive length.
I came across a script of “Adaptive Hull Moving Average” which pretty much used the similar methodology as DVAMA but when I looked into its depth, its volume oscillator wasn’t working at all and only volatility based dynamic length was used. It was an interesting idea so, I decided to use Volume and Volatility alongside for better results but was nearly impossible to achieve what I wanted using only Hull Moving Average.
I had been using EDSMA in “MA MTF Cross Strategy” and “MZ SRSI Strategy V1.0” previously. It was the perfect choice when comparing to usage of slope on it. DSMA works perfectly as support and resistance as its Deviation Scaled. So, I tried using it to adapt dynamic length based on Volume and Volatility and I wasn’t disappointed. It worked like a charm when I adapted dynamic length between 50 and 255.
DYNAMIC LENGTH BENEFITS
Dynamic length adaption methodology works in a way of adapting Relatively Lower Length leading toward overfitting if trend is supported by Volume and Volatility . Similarly, adapting Relatively Higher Length leading toward underfitting if trend isn’t supported by Volume and Volatility .
Dynamic length adaption makes Moving Average to work better for both Bull and Bear-runs avoiding almost every fake break-in and breakouts. Hence, adaptive MA becomes more reliable for breakout trading.
MA would be more useful as it would adapt almost every chart based on its Volume and Volatility data.
DYNAMIC COLORS AND TREND CORRELATION
I’ve used dynamic coloring to identify trends with more detail which are as follows:
Lime Color: Strong Uptrend supported by Volume and Volatility or whatever you’ve chosen from both of them.
Fuchsia Color: Weak uptrend only supported by Slope or whatever you’ve selected.
Red Color: Strong Downtrend supported by Volume and Volatility or whatever you’ve chosen from both of them.
Grey Color: Weak Downtrend only supported by Slope or whatever you’ve selected.
Yellow Color: Possible reversal indication by Slope if enabled. Market is either sideways, consolidating or showing choppiness during that period.
SIGNALS
Green Circle: Market good for long with support of Volume and Volatility or whatever you’ve chosen from both of them.
Red Circle: Market good to short with support from Volume and Volatility or whatever you’ve chosen from both of them.
Yellow Cross: Market either touched top or bottom ATR band and can act as good TP or SL.
EDSMA EVELOPE/BANDS: I’ve included ATR based bands to the Adaptive EDSMA which act as good support/resistance despite from main Adaptive EDSMA Curve.
DEFAULT SETTINGS
I’ve set default Minimum length to 50 and Maximum length to 255 which I’ve found works best for almost all timeframes but you can change this delta to adapt your timeframe accordingly with more precision.
Dynamic length adoption is enabled based on both Volume and Volatility but only one or none of them can also be selected.
Trend signals are enabled based on Slope and Volume but Volatility can be enabled for more precise confirmations.
In “ RVSI ” settings TFS Volume Oscillator is set to default but others work good too especially Volume Zone Oscillator. For more details about Volume Breakout you can check “MZ RVSI Indicator".
ATR breakout is set to be positive if period 14 exceeds period 46 but can be changed if more adaption with volatility is required.
EDSMA super smoother filter length is set to 20 which can be increased to 50 or more for better smoothing but this will also change slope results accordingly.
EDSMA super smoother filter poles are set to 2 because found better results with 2 instead of 3.
FURTHER ENHANCEMENTS
So far, I’ve seen better results with Volume Breakout and Volatility but other parameters such as Linear Slope of Particular MA, MACD, “MZ SRSI ”, a Conditional Uptrend MA or simply KDJ can also be used for dynamic length adaption.
I haven't yet gotten used to pine script arrays so, defining and using conditional operators is pretty much lazy programming for me. Would be great redefining everything through truth matrix instead of using if-else conditions.

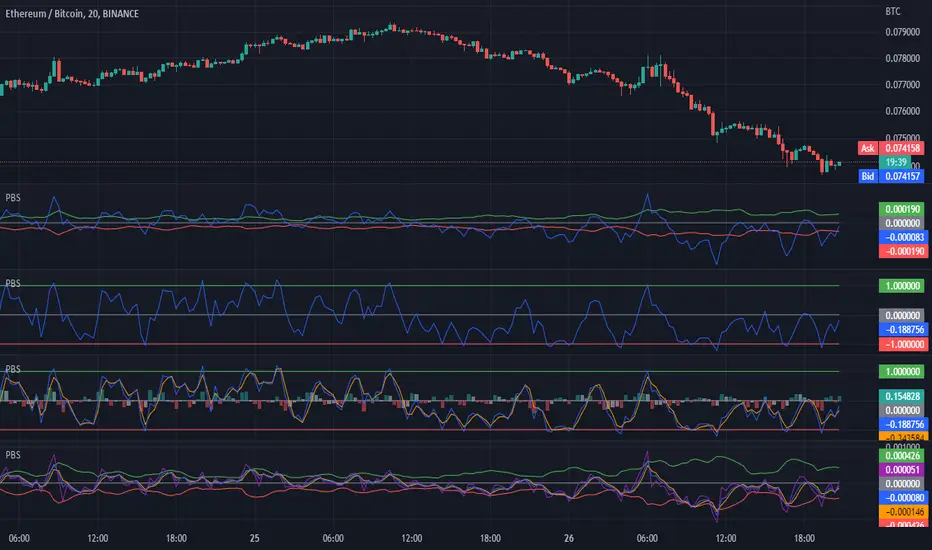
H/L Price Band with Signal Line (PBS)This indicator centers a moving average around the hl2 of the price. This is calculated as the difference of two moving averages. The upper band is a 9 period exponential moving average, the lower band is a 7 period moving average and the center line is the average between the two. The "Fast Line" is our signal line in this oscillator. When the price is hovering around the center of the band this indicates that a trend is pausing or reversing. When the fast line exits the band this could be a buy or sell signal. It could also indicate a very strong trend in that direction. To get the optimal entry and exit you might want to wait for the price to return to the center line. In addition to the basic functionality of this indicator I have added some bonus features. You can enable the "Slow Line" or the "Long Line" to enhance your signals. When the fast line is above the slow/long line you are in an up trend and inversely when the fast line is below the slow/long line you are in a down trend. The crossing of these lines can indicate a reversal. I have also included a "J" style amplification line. This works by enhancing the difference between the Fast and Slow/Long line to make it more visually apparent. You can also configure the "J" line to be calculated between either the slow or long line. Finally I have added the feature to amplify the band width by the standard deviation. This is set to 1 by default but you can also get a more responsive signal by setting this to 0.
This indicator works in most markets. There is a tool tip for every aspect of this indicator explaining how everything works. I hope you are very profitable with this one!
If you find this indicator is useful to you, Star it, Follow, Donate, Like and Share.
Your support is a highly motivation for me.
MCDX PlusMCDX Plus is an indicator to show the relative level of Profitable Chips, Floating Chips and Locked Chips for Stocks market.
Red Bars being Profitable Chips, Yellow Bars being Floating Chips and Green Bars being Locked Chips.
Profitable Chips represents investments, typically by bankers, accumulating shares when stock price is relatively low over a period of time, either during down trend or ranging. When price is moving up, the shares accumulated will start to make profit.
Locked chips being those bought at at a higher price, failed or unwillingly to cut loss and still holding them.
Floating chips being free flow tradable shares in the market, typically hold by intraday or short term traders.
The relative profitable level is calculated based on current market price versus the highest and lowest price over a look back period.
Typically, 100 days look back, which is sufficient to cover uptrend or downtrend.
In this indicator, I added in options for 34 days (Fibo numbe), 50 days, 100 days and user-input DIY look back period.
When Red Bar height is increasing, profitable level is increasing, stocks price is increasing with main funding is increasing.
Typically higher is better. More than 50% is preferred.
During a retrace or downtrend, the locked chips will lead to higher values of green bar.
Typically lower is better, 0 is preferred.
A simulated fund line (based on KDJ) and fund bull bear line are added to simulate the inflow and outflow of fund.
When fund line cross up bull bear line, it means the in flow of funding.
User can click to show in the setting.
A potential bottom catch alert based on volume and oversold situation are also added as reference.
A table with indicator name and values of profitable chips, floating chips and locked chips is added.
User can click to show or mute.
MCDX Plus is shown on DPIH (KLCI).
The Price chart shows the highest, lowest, average of 100day look back period, blue line being MA20.
MCDX's red bar is slightly over 50%, cross over the 10day Moving Average of profitable chips. Locked chips is 0.
We can also see fund cross over fund bull bear line briefly.
It is a positive movement.
User is recommend to do further technical analysis such as support and resistance, etc, to better understand trend.
Ideas to improve the scripts are welcome. Hope this help.

[blackcat] L1 Trading Risk Assessment Indicator Level: 1
Background
Risk assessment is a general term used in many industries to determine the likelihood of losing an asset, loan, or investment. Risk assessment is important in determining how profitable a particular investment is and which techniques are best for risk mitigation. It shows the upward reward versus the risk profile. Risk assessment is important in determining the rate of return an investor would need to earn in order to consider an investment as worth the potential risk.
Function
L1 Trading Risk Assessment Indicator provides a trading risk evaluation mechanism that follows the megatrend. By defining transaction risk as 4 levels: highly risky, risky, safe, and highly safe, the current bar’s evaluation value can be compared with historical bar data to understand the current level of trading risk and the level of trading risk Trend.
Key Signal
h1~h5 --> trading risk level threshold, which can be adjusted according different markets.
currentsafetylevel --> it indicates current bar risk assessment result
Pros and Cons
Pros:
1. according risk level, proper position size can be adjusted
2. know global trend and select propoer time to exit
Cons:
1. no exact long and short entry are disclosed
2. different markets require different thresholds
Remarks
An improved version of KDJ with less satration observed.
Readme
In real life, I am a prolific inventor. I have successfully applied for more than 60 international and regional patents in the past 12 years. But in the past two years or so, I have tried to transfer my creativity to the development of trading strategies. Tradingview is the ideal platform for me. I am selecting and contributing some of the hundreds of scripts to publish in Tradingview community. Welcome everyone to interact with me to discuss these interesting pine scripts.
The scripts posted are categorized into 5 levels according to my efforts or manhours put into these works.
Level 1 : interesting script snippets or distinctive improvement from classic indicators or strategy. Level 1 scripts can usually appear in more complex indicators as a function module or element.
Level 2 : composite indicator/strategy. By selecting or combining several independent or dependent functions or sub indicators in proper way, the composite script exhibits a resonance phenomenon which can filter out noise or fake trading signal to enhance trading confidence level.
Level 3 : comprehensive indicator/strategy. They are simple trading systems based on my strategies. They are commonly containing several or all of entry signal, close signal, stop loss, take profit, re-entry, risk management, and position sizing techniques. Even some interesting fundamental and mass psychological aspects are incorporated.
Level 4 : script snippets or functions that do not disclose source code. Interesting element that can reveal market laws and work as raw material for indicators and strategies. If you find Level 1~2 scripts are helpful, Level 4 is a private version that took me far more efforts to develop.
Level 5 : indicator/strategy that do not disclose source code. private version of Level 3 script with my accumulated script processing skills or a large number of custom functions. I had a private function library built in past two years. Level 5 scripts use many of them to achieve private trading strategy.

