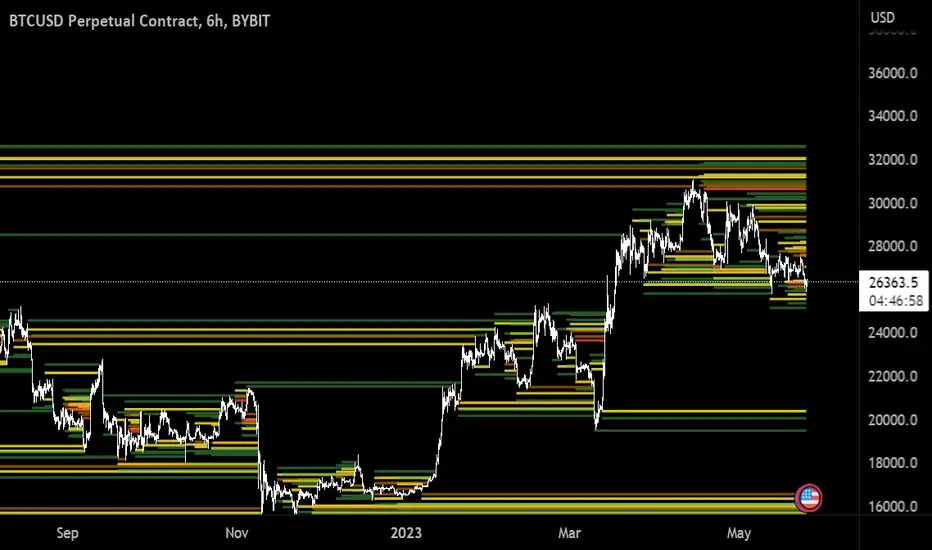
[Mad] Liquidation LevelsThe Liquidation Lines Technical Indicator is a trading tool designed to assist traders in identifying potential liquidation levels. This indicator generates virtual positions, known as "liquidation lines", which mark the points at which these positions would be liquidated under specified conditions.
Key Features:
Quantity of Lines: The indicator can create up to 125 liquidation lines, evenly distributed between long and short positions. This limit is derived from a maximum of 500 lines, divided by four to account for two types of leverage (long and short).
Customizable Liquidation Levels: Users are given the ability to set liquidation levels according to their individual trading strategies and the current market conditions.
Customizable Visuals: The color and thickness of the liquidation lines can be adjusted to suit personal preferences, providing a clear visual representation on the trading chart for ease of analysis.
Selectable Signal Sources: The indicator provides the flexibility to choose the signal source for creating the liquidation lines. Users can select from a range of popular technical analysis tools such as Bollinger Bands, MACD crosses, EMA crosses, or SMA crosses. This feature allows traders to customize the formation of liquidation lines based on their preferred technical indicators, adding to the comprehensiveness and versatility of the tool.
Two selectable Leverages: The indicator accommodates both long and short leverages, offering a comprehensive understanding of potential liquidation points for various trading scenarios.
Selectable Exchange Maintenance: The indicator allows users to select their specific cryptocurrency exchange. This feature ensures that the liquidation lines are accurately calculated according to the maintenance margin requirements of the chosen exchange, adding precision and customization to the trading analysis.
在脚本中搜索"Liquidation"
Leveraged Liquidation ZonesOVERVIEW
This indicator estimates potential liquidation zones based on leveraged positions (25x, 50x, 75x, 100x). It visually displays upper and lower bounds for each leverage tier, allowing traders to infer areas where the market might be seeking liquidity.
CONCEPTS
In leveraged markets, especially crypto derivatives, price often moves towards zones of high liquidation potential — areas where traders using high leverage are likely to be stopped out. These zones represent concentrations of liquidity that can serve as targets for price movement.
This script models simplified liquidation areas by calculating the price range within which positions using specific leverage levels would be at risk, assuming no maintenance margin and using the previous candle close as a reference.
FEATURES
Visual zones for 25x, 50x, 75x, and 100x leverage levels.
Customizable visibility and colors for each leverage tier.
Real-time zone calculation based on the previous candle close.
Simple and clean design to overlay directly on price action.
USAGE
Use this tool to identify areas of liquidity accumulation or potential price magnet zones. High-leverage liquidations often lead to volatile movements when triggered, so tracking these zones can help anticipate breakout or reversal behavior.
You can toggle individual leverage levels via the settings panel, and adjust color transparency to suit your chart theme. This tool is most effective when combined with volume spikes, order book analysis, or high-frequency behavior.

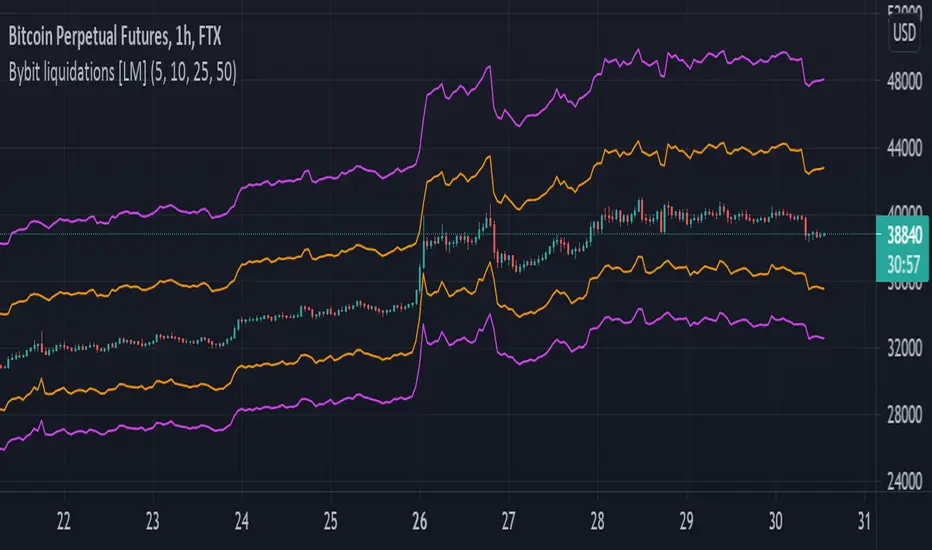
Bybit liquidations [LM]Hello traders,
I would like to introduce you script for calculating liquidations on Bybit(it's applicable not only for Bybit). The idea is to render lines and look for confluence with other indicators where is most likely that people will get liquidated.
It has setting with 4 leverages that will render line below and above price always calculated from high and low of the candles.
Hope you will enjoy it.
Multi Timeframe Rolling Bitmex Liquidation LevelsTrack Bitmex liquidations levels in real-time with a rolling VWMA or VWAP basis.
Allows the input of a different time frame if you wish.

Open Interest liquidation map [Ox_kali]This script is inspired by @LeviathanCapital work on aggregating Open Interest , as presented in the Open Interest Suite Aggregated script. This script aims to provide a liquidation map of Open Interest by identifying significant anomalies across multiple trading platforms. By integrating data from Binance, BitMEX, and Kraken, this script tries to offer a comprehensive and detailed view of Open Interest movements and attempts to define zones of interest.
Key Points
1. Multiple Data Sources : The script retrieves Open Interest data from several trading platforms, including Binance (USDT, USD, BUSD), BitMEX (USD, USDT), and Kraken (USD).
2. Anomaly Detection : Utilizes a simple moving average (SMA) to calculate the average size of Open Interest candles and identify anomalies based on a user-specified size factor.
3. Background Coloring : Offers an option to color the background of the charts based on detected anomalies, allowing for clear visualization of significant movements.
4. Dynamic Support and Resistance Zones : Defines and dynamically updates support and resistance zones based on Open Interest anomalies.
5. Alerts : Configures alerts to notify the user when an Open Interest anomaly is detected.
Trading Utility
This script can be useful for monitoring significant changes in Open Interest and potential liquidation zones across multiple platforms. The main trading applications include:
1. Identifying Liquidation Points : By detecting Open Interest anomalies, it is possible to identify potential liquidation points where significant price movements might occur.
2. Multi-Platform Analysis : By aggregating Open Interest data from multiple platforms, a more comprehensive market overview is obtained.
3. Detecting Support and Resistance Zones : Dynamic support and resistance zones help identify key price levels where trend reversals might occur.
4. Customized Alerts: Anomaly alerts allow for automated responses to market changes.
Conclusion
The “Open Interest liquidation map ” script is an experimental tool for analyzing Open Interest across multiple trading platforms. Inspired by Leviathan’s work, this script attempts to identify liquidation and interest zones. This is an experimental version, and I welcome any comments and feedback for improvement.
Please note that the Open Interest liquidation map is not a guarantee of future market performance and should be used in conjunction with proper risk management. Always ensure that you have a thorough understanding of the indicator’s methodology and its limitations before making any investment decisions. Additionally, past performance is not indicative of future results.
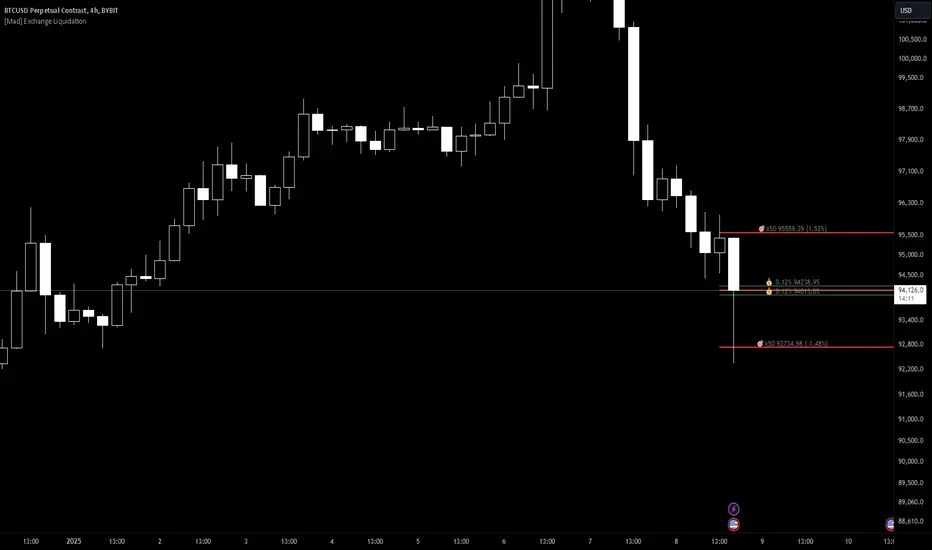
[Mad] Exchange liquidationThis is just a basic tool to calculate liquidation based on:
margin-maintenance
leverage
it starts drawing on your input point short and long liquidation, so you can easily place it on your trade and drag it around if you are rebuying as an example.
Also, you can use it to aim for a specific support/resistance to see if it is even possible to reach some levels, which leverage you can use...
It additionally delivers live data based on the actual close to the 2 liquidation points
have fun
Basic Bitmex Liquidation (Open Source)Been trying to reverse engineer this specific script () cause reasons for weeks now. Enjoy, fam

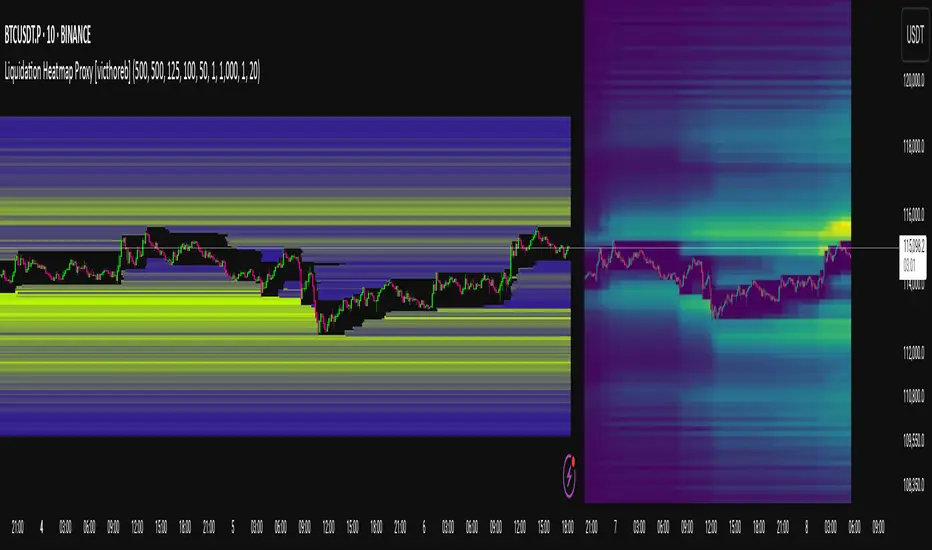
Liquidation Heatmap Proxy [victhoreb]Author: victhoreb
This script was inspired by the Coinglass indicator: www.coinglass.com
It divides each bar into subbars determined by the intrabar period. For each bar, it considers subbars with a positive OID (open interest delta) (if the user sets "Filter by Signal" to true, it only considers subbars with OID > 0 from a main bar that had a peak in open interest). In these subbars, it considers opened long/short positions based on the intrabar price movement and the dispersion factor (which becomes completely unnecessary if the user is using Intrabar Resolution in ticks; in this case, set the dispersion factor = 0).
After determining the opened long and short positions, it determines, based on the user-selected leverages, the liquidation level for each position. The width of each level is given by syminfo.mintick * scale. The script uses the intrabar OID from the previous step to store an estimate of the number of contracts to be liquidated at each level. This estimate is used to color the levels by order of magnitude.
If there is a subsequent increase in liquidations at a pre-existing level, the script accumulates the estimated number of contracts to be liquidated and repaints the level. A note about a visual limitation of the script is important: in Coinglass' version, when there is a subsequent increase in liquidations at a pre-existing level, Coinglass paints the level a brighter color ONLY from the moment of the increase—however, this script does not do this; it repaints the entire level with the brighter color. Note: While accurate, this script is only a proxy. Use at your own risk.
This script has alerts for when there is liquidation in the long or short direction.
Liquidations by volume (spot/futures)BINANCE:BTCUSDT
Shows actual liquidations on a per-candle basis by using the difference in volume between spot and futures markets.
i.e. volume on a futures market will be much higher if there are many liquidations.
Long liquidation data should in theory be more accurate than short liquidation data due to the inability to short on a spot market.
This indicator should be able to help identify trends by determining liquidation points in the chart.

Liquidation Strategy📈 It enters a long trade when long liquidation spikes above a set threshold.
📉 It enters a short trade when short liquidation drops below the negative threshold.
🧮 It optionally filters entries using an EMA multiplier.
🔁 It exits long when RSI crosses below its smoothed version.
🔄 It exits short when RSI crosses above its smoothed version.
🔗 It requires linking to the Liquidations indicator on Bybit or OKX charts.

Liquidation/Doji CandlesLiquidation/Doji Candles
This indicator highlights candles with a body length smaller than 30% of the candle’s total range. These candles are displayed in orange, representing potential liquidation points or doji candles.
The idea behind this tool is to help traders spot moments of market indecision, where buying and selling pressure are in balance. Such conditions often hint at institutional liquidation events or possible retail-driven reversals.
You can fully customize the detection sensitivity by adjusting the percentage input. This allows you to tighten or loosen the condition depending on your trading style and market preference.
To support passive traders, the script also includes built-in alerts for:
• The formation of a new liquidation/doji candle.
• A close above its high (bullish engulfment).
• A close below its low (bearish engulfment).
These alerts make it easier to stay on top of potential market shifts without needing to constantly monitor the charts.

Liquidation Points for 50 and 100 Leverage V1First basic cut for all those who get liquidated.
The theory behind the liquidation system for Bitmex, shows an estimate where other trader's liquidation prices might be and ultimately how one can exploit other trader's losses for one's own gain.
I have left the code for the x25 leverage level if you wish to use.
If you wish to understand the theory more go to www.youtube.com
I have used vitvlkv’s Day/Low Code to assist in the calculations -
If somebody could improve on this. It would be great. Thanks

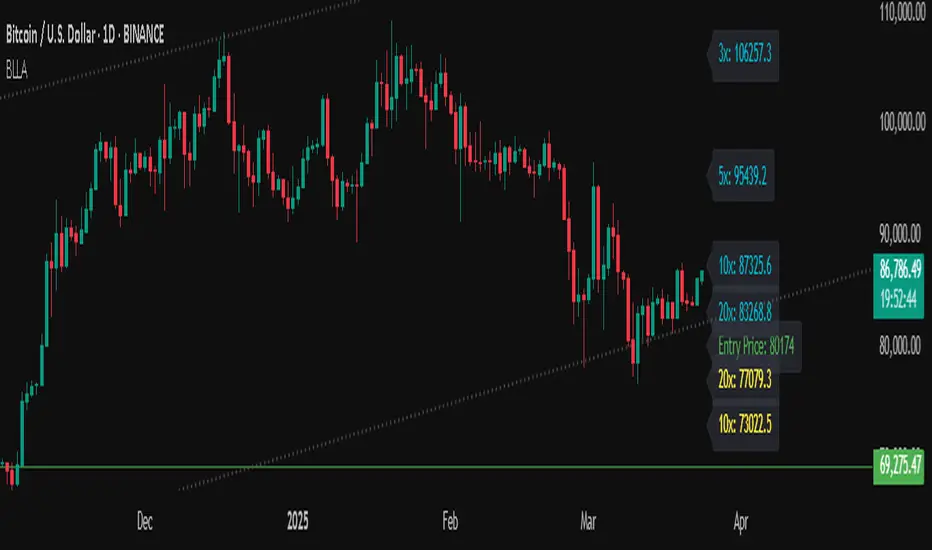
Binance Leveraged Liquidations ApproximationBinance Leveraged Liquidations Approximation (BLLA)
The Binance Leveraged Liquidations Approximation (BLLA) indicator is a tool designed to estimate liquidation levels for leveraged trading on Binance. It calculates the approximate prices at which liquidations could occur for long and short positions, based on the entry price and leverage levels selected by the user.
Key Features:
Liquidation Level Calculation:
Estimates liquidation prices for multiple leverage levels (e.g., 20x, 10x, 5x, etc.).
Supports both long and short positions.
Customization:
Allows the user to manually input the entry price or automatically calculate it as the midpoint between the low and high of a defined period.
Leverage levels are configurable, enabling the indicator to adapt to different trading strategies.
Clear Visualization:
Displays liquidation levels directly on the chart, with labels indicating the corresponding leverage.
Uses distinct colors for long positions (yellow) and short positions (blue).
Recommended Use:
Risk Management: Helps identify liquidation levels to adjust stop-loss orders and manage risk in leveraged trading.
Market Analysis: Provides a quick overview of key levels where significant price movements might occur due to mass liquidations.
Settings:
Entry Price: Enter manually or leave at 0.0 to calculate automatically.
Leverage: Configure desired leverage levels (e.g., 20x, 10x, 5x, etc.).
Transparency and Display: Adjust the transparency of the lines and the number of bars displayed.
Quick Instructions:
Add the indicator to your chart.
Enter the entry price or leave it at 0.0 to calculate automatically.
Configure leverage levels according to your strategy.
Observe liquidation levels on the chart and use them to manage your risk.
Note:
This indicator is an approximation and does not guarantee absolute accuracy of liquidation levels, as these may vary depending on market conditions and exchange policies.
Liqudation HeatMap [BigBeluga]🔵 OVERVIEW
An advanced liquidity visualization tool that plots horizontal heat zones to highlight where potential liquidations and volume clusters are most likely hiding beneath price action.
Liqudation HeatMap scans historical price movements for local highs and lows with elevated volume or candle range. It then draws dynamic heatmap boxes—shaded from lime (low interest) to yellow (high interest)—revealing potential zones of trapped positions or stop clusters. A vertical scale on the right shows you the relative strength of volume behind each level, from 0 to the highest detected.
🔵 CONCEPTS
Maps areas of potential liquidity using volume or candle range (if volume is unavailable).
Identifies swing highs/lows (pivots) and extends heatmap boxes outward from these levels. Colors each zone based on the relative strength of volume concentration.
Fades or removes zones once price crosses their midpoints, simulating the idea of liquidity being “consumed.”
Displays a live vertical scale that shows the volume range for quick reference.
🔵 FEATURES
Dynamic Heatmap Zones:
Draws few boxes above and after pivot highs and below pivot lows, each shaded based on volume concentration.
Smart Coloring System:
Uses a gradient from lime (low) to yellow (high) to visually distinguish between weak and strong liquidity zones.
Adaptive ATR Widths:
Automatically adjusts zone thickness based on volatility (ATR), scaling intelligently across timeframes.
Liquidity Consumption Logic:
Zones are stope extending once price interacts with them—mimicking the behavior of real liquidation sweeps.
Volume Scale Legend:
A real-time scale is plotted on the right side, showing the min-max range of volume used for heat calculations.
🔵 HOW TO USE
Look for thick yellow zones to identify areas of concentrated stop losses or liquidation triggers.
Use these levels to anticipate mean reversion points or high-volatility zones.
Combine with your trend or structure tools to trade into or fade these liquidity pools.
On lower timeframes, use this tool to confirm entries around sweeps or deviations.
Use the right-side scale to compare relative zone strength instantly.
🔵 CONCLUSION
Liqudation HeatMap is a powerful visualization tool that uncovers where liquidity likely resides on the chart. By highlighting hidden traps and reactive levels in real-time, it gives traders a significant edge when it comes to spotting stop hunts, mean reversions, and areas of institutional interest. Whether you’re scalping or swing trading, this heatmap provides unmatched context on the market’s hidden intent.

Aggregated Volume Spot & Futures ⚉ OVERVIEW ⚉
The indicator presents a comprehensive approach to Aggregated Volume Data . Works on almost all CRYPTO Tickers!
The script also includes several input parameters that allow the user to control which exchanges and currencies are included in the aggregated data.
This script allows the user to choose from several data display modes, including volume, spot & perp, delta, cumulative delta, and others.
The user can also choose how volume is displayed (in assets, U.S. dollars or euros) and how it is calculated (sum, average, median, or dispersion).
WARNING Indicator is for CRYPTO ONLY.
______________________
⚉ SETTINGS ⚉
‾‾‾‾‾‾‾‾‾‾‾‾‾‾‾‾‾‾‾‾‾‾
Mode — Choose Mode.
• Volume — This displays the Volume
• Volume (Colored) — Shows aggregated volume but applying different volume colors for different exchanges.
• Delta — This displays the difference between the number of sellers and buyers.
• Cumulative Delta — This displays the cumulative delta between sellers and buyers.
• Spot & Perp — Shows Spot and Futures volume at the same time.
• Delta (Spot - Perp) — Shows the difference between Spot and Futures Volume.
• Liquidations — Displays Potential Liquidations. (Calculated between the difference in volume between Futures and Spots)
• OBV — On Balance Volume.
• MFI — Money Flow Indicator.
• Data Type — Choose Single or Aggregated data.
• Single — Show only current Volume.
• Aggregated — Show Aggregated Volume.
Volume By — You can also select how the volume is displayed.
• COIN — Volume in Actives.
• USD — Volume in United Stated Dollar.
• EUR — Volume in European Union.
• RUB — Volume in Russian Ruble.
Calculate By — Choose how Aggregated Volume it is calculated.
• SUM — This displays the total volume from all sources.
• AVG — This displays the average price of the volume from all sources.
• MEDIAN — This displays the median volume from all sources.
• VARIANCE — This displays the variance of the volume from all sources.
* 🡅 Be Careful, Reacts to Every Mode.
Additional features
• Show MA — Show Movieng Average of Volume.
• MA Period — Period of MA.
• Lookback — Lookback period for 'Cumulative Delta' and for 'MFI'.
• Liquidation Filter — Filters out small or negative difference values.
• Show Table — Table shows the current volume of the last candle. Also in the Mode "Colored" shows the color of exchanges if they have volume.
________________
⚉ NOTES ⚉
‾‾‾‾‾‾‾‾‾‾‾‾‾‾‾‾
I don't pretend to be the best choice for calculating CVD , Delta and Liquidations, the calculations are chosen to be optimal from what I have seen and know.
If you have any ideas what to add to my work to add more sources or make calculations cooler, suggest in DM .

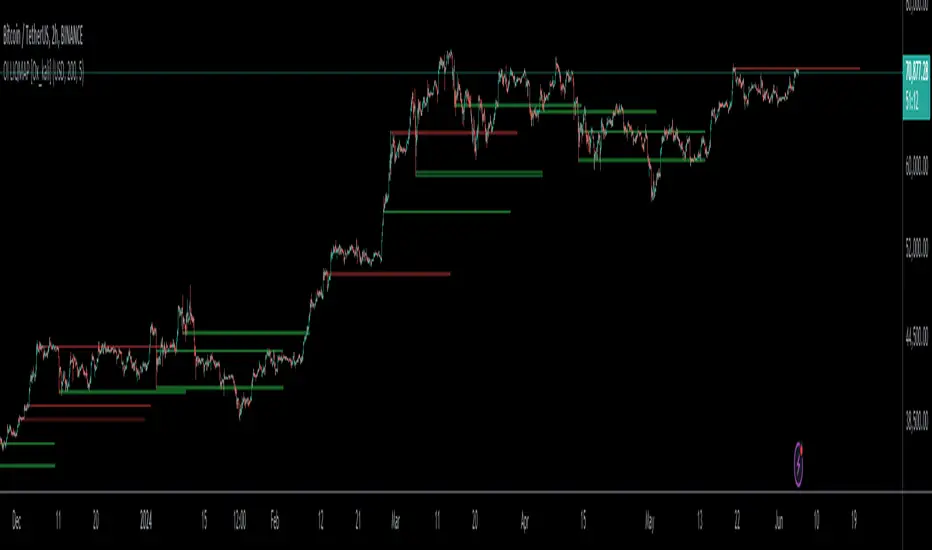
Liquidity Location Detector [BigBeluga]
This indicator helps traders identify potential liquidity zones by detecting significant volume levels at key highs and lows. By using color intensity and scoring numbers, it visually highlights areas where liquidity concentration may be highest while incorporating trend analysis through EMAs.
🔵Key Features:
Liquidity Zone Detection: Automatically detects and marks areas where significant volume has accumulated at swing highs and lows.
Dynamic Box Plotting: Draws liquidity boxes at key highs and lows, updating based on market conditions.
Volume Strength Scaling: Uses a scoring system to rank liquidity zones, helping traders identify the strongest areas.
Color Intensity for Volume Strength: More transperent color indicate less liquidity, while less transperent represent stronger volume concentrations.
Customizable Display: Users can adjust the number of displayed liquidity zones and modify colors to suit their trading style.
Real-Time Liquidity Adaptation: As price interacts with liquidity zones, the indicator updates dynamically to reflect changing market conditions.
Auto-Stopping Liquidity Zones: Liquidity boxes automatically stop extending to the right once price crosses them, preventing outdated zones from interfering with live market action.
Trend Analysis with EMAs: Includes two optional EMAs (fast and slow) to help traders analyze market trends. Users can enable or disable these EMAs in the settings and use crossover signals for trend confirmation.
🔵Usage:
Identify Key Liquidity Areas: Use color intensity and transparency levels to determine high-impact liquidity zones.
Support & Resistance Confirmation: Liquidity zones can act as potential support and resistance levels, enhancing trade decision-making.
Market Structure Analysis: Observe how price interacts with liquidity to anticipate breakout or reversal points.
Scalping & Swing Trading: Works for both short-term and long-term traders looking for liquidity-based trade setups.
Liquidation Map Insight: A liquidity map highlights areas where large amounts of leveraged positions (both long and short) are likely to get liquidated. Since many traders use leverage, sharp price movements can trigger a cascade of liquidations, leading to rapid price surges or drops. Monitoring these liquidity zones and trends helps traders anticipate where price might react strongly.
Liquidity Location Detector is an essential tool for traders seeking to map out potential liquidity zones, providing deeper insights into market structure and trading volume dynamics.

Liquidity Hunter HeatmapLiquidity Hunter (GPS Companion Tool)
Liquidity Hunter is a specialized script designed to help traders visualize and track potential liquidation zones, clusters, and imbalance traps in real-time. It is particularly useful for scalpers and short-term traders who rely on liquidity sweeps, stop hunts, and reversion plays.
This tool does not replicate open-source liquidation trackers. Instead, it uses a proprietary combination of volume surges, candle displacement, VWAP deviation, and high-timeframe wicks to infer areas of trapped traders and display them with clear, color-coded markers.
Key Features:
• Real-Time Liquidation Estimates: Detects where major stop losses (and potential liquidations) may have occurred, based on proprietary volume + price action logic.
• Cluster Strength Bubbles: Visual bubbles (scaled by cluster size) show where liquidations are stacking. Purple for bearish, white for bullish — intensity reflects strength.
• Pre-Liquidation Warning Zones: Highlights areas where price is likely to sweep liquidity before reversing, helping traders avoid chasing moves.
• Dollar-Based Labels (Optional): Displays the estimated value liquidated, helping traders size the significance of a move (e.g., $8.4M).
• Minimal Clutter Mode: Designed for intraday clarity — hides excess lines and uses bubbles, not shapes, for cleaner visualization.

Stophunt WickAcknowledgement
This indicator is dedicated to my friend Alexandru who saved me from one of these liquidation raids which almost liquidated me.
Alexandru is one of the best scalpers out there and he always nails his entries at the tip of these wicks.
This inspired me to create this indicator.
What's a Liquidation Wick?
It's that fast stop-hunting wick that stophunts everyone by triggering their stop-loss and liquidation.
Liquidity is the lifeblood of stock market and liquidation is the process that moves price.
This indicator will identify when a liquidity pool is getting raided to trigger buy or sell stops, they are also know as stop-hunts.
How does it work?
When market consolidates in one direction, it builds up liquidity zones.
Market maker will break out of these consolidation phases by having dramatic price action to either pump or dump to raid these liquidity zones.
This is also called stop-hunts or liquidity raids. After that it will start reversing back to the opposite direction.
This is most noticeable by the length of the wick of a given candle in a very short amount of time and the total size of the candle.
This indicator highlights them accordingly.
Settings
Wick and Candle ratio works with default values but finetune will enhance user experience and usability.
Wick Ratio: Size of the wick compared to body of a candle.
Adjust this to higher ratio on smaller timeframe or smaller ratio on bigger timeframe to your trading style to spot a trend reversal.
Candle Ratio: The size of the candle, by default it is 0.75% of the current price.
For example, if BTC is at 20,000 then the size of the candle has to be minimum 150.
This can be fine tuned to bigger candle size on higher time frames or smaller for shorter timeframe depending on the trade type.
How to use it?
This indicator will identify when a liquidity pool is getting raided to trigger buy or sell stops, they are also know as stop-hunts. It can be used of its own for scalping but there are also a good few indicators which would most definitely help to confluence bigger timeframe trades.
Scalp
This indicator shows the most chaotic moments in price action; therefore it works best on smaller timeframes, ideally 3 or 5 minute candle.
- Wait for the market to start pumping or dumping.
- Current candle will change colour (Bullish/Bearish).
- Enter trade as soon as price starts to reverse back.
- Place the stop-loss outside of the current candle.
- Wait for the Liquidation Wick to appear as confirmation.
Price is very chaotic during a liquidity stop-hunt raid but there is a saying:
"In the midst of chaos, there is also opportunity" - Sun-Tzu
Since this is a very high risk, high reward strategy; it is advised to practice on paper trade first.
Practice until perfection and this indicator would be the perfect bread and butter scalp confirmation.
Fair Value Gap
FVG strategy is the most accurate in conjunction with this indicator.
Normally price would reverse after consuming fair value gaps but often it's difficult to know when and where.
This indicator would identify those crucial entry points for reverse course direction of the price action.
Support and Resistance
This indicator can also be used in conjunction with support and resistance lines.
Generally the stophunt will go deep below the support or spike much further up the resistance lines to liquidate positions.
Bollinger Bands
Bolling Bands strategy would be to wait until the price breaks out of the band.
Once the wick is formed, it would be an ideal entry point.
Script change
This is an open-source script and feel free to modify according to your need and to amplify your existing strategy.

Volume Aggregated Spot & Futures -- Crypto (by plyst & more)📊 Volume Aggregated Spot & Futures - Enhanced Edition
🎯 Overview
Advanced volume aggregation indicator that combines spot and perpetual futures volume across the top 10 cryptocurrency exchanges. This enhanced version builds upon the original work by @HALDRO Project with optimized calculations and expanded functionality.
✨ Key Features
- 📈 Real-time aggregated volume from 10 major exchanges (Binance, Bybit, OKX, Coinbase, Bitget, KuCoin, Kraken, MEXC, Gate.io, HTX)
- 🔄 Multiple visualization modes: Volume, Delta, Cumulative Delta, Spot vs Perp analysis, Liquidations, OBV, and MFI
- 💱 Multi-currency support: Display volume in COIN, USD, or EUR
- 🎨 Clean, single-color bar chart showing total cumulative volume
- 📊 Multiple calculation methods: SUM, AVG, MEDIAN, VARIANCE
- 🎯 Separate spot (USDT, USD, USDC, etc.) and perpetual futures (.P contracts) tracking
🔧 Technical Improvements
✓ Corrected MFI formula for accurate money flow calculations
✓ Optimized volume aggregation logic with proper NA handling
✓ Support for 10 exchanges (up from 9)
✓ Streamlined codebase for better performance
✓ Updated perpetual contract naming conventions (.P format)
📖 Usage
Perfect for analyzing total market volume, identifying liquidation events, tracking buyer/seller pressure through delta analysis, and understanding the spot vs futures market dynamics.
🙏 Credits
Original concept and framework by @HALDRO Project. This version includes mathematical corrections, code optimizations, and expanded exchange support.
⚠️ Note
Aggregated volume is calculated from external exchange data using request.security(). Ensure your plan supports the necessary security calls for optimal performance.

Armando Bitmex Liquidation LevelsHi Guys!
- This script show you liquidations levels with leverage of 100X, 50X, 25X & 10X (shorts & longs).
- This indicator "only" works for XBT on Bitmex.
- Other indicators only show the liquidations up to 25X.
- You need to set the time frame according to your graph. e.g. 1, 60, 240, D, 3D, W, etc.
- The idea of this indicator is to help the user to determine those levels where Bitmex hunt liquidity.
Best Regards.
Armando M.

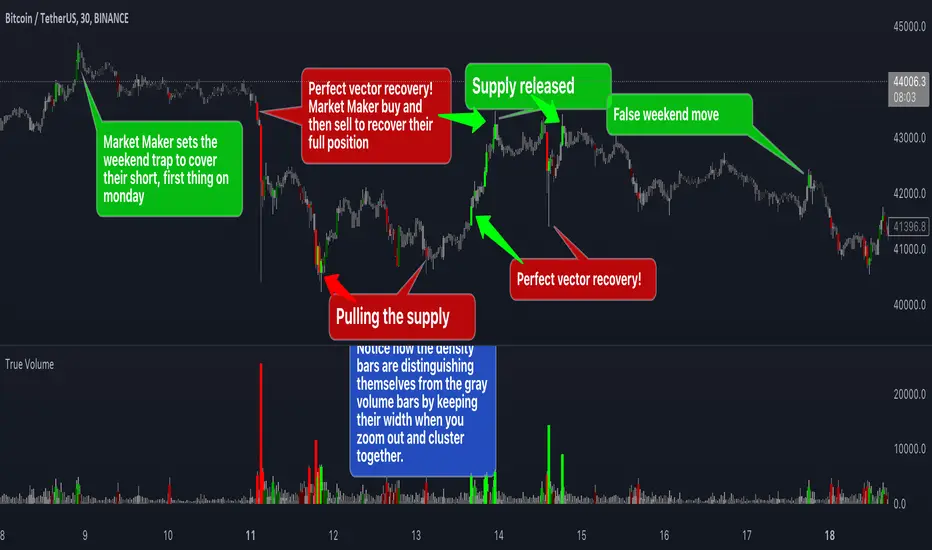
True VolumeThis indicator is designed to provide in-depth analysis of volume data from multiple sources and distinguish highly liquid candles by measuring the density of the volume. By focusing on the density and concentration of volume, rather than just the volume itself, it offers a more nuanced view of the market. This can be particularly beneficial in markets like cryptocurrencies, where understanding the role of market makers versus retail traders is crucial for strategic trading.
This is how it works:
Multiple Asset Integration:
Unlike standard volume indicators, True Volume allows the inclusion of up to four different assets (or the same asset from various exchanges) into its volume calculations. This feature provides a broader and more accurate total volume representation, essential in markets like cryptocurrencies where volume is dispersed across multiple exchanges.
Adjustable Time Anchors:
It offers various time anchor options, allowing traders to analyze volume data over different time periods or a specific amount of lookback candles. This flexibility helps in understanding volume trends over both short and long-term time frames.
Volume Density Analysis:
The core of this indicator is the innovative concept of Volume Density. It's calculated using a sigmoid function that normalizes the volume-to-price movement ratio in a unique way without needing a max cap or having the density column spike off the chart. This method helps in distinguishing between normal volume fluctuations and those that are unusually dense for the given price movement. This distinction is key in identifying potential market maker activities.
The Visuals:
The Volume Density is displayed in a unique way without compromising the original volume bars or cap the density. Infinite density can essentially be represented without having an infinitely large bar or caping out the density data. There's also two different color themes, optional bar color, and an option to flip the density bars up-side down for a different representation. Each of the original volume sources can be displayed separately as well. All colors as customizable as well for your own preference.
Price Volume Trend (PVT):
Included in this indicator is also the Price Volume Trend, which cumulatively measures the density delta, offering insights into the longer-term momentum of the market.
How do I trade it?
This indicator aims to give you insight into 'the other side of the trade', the Market Makers. When you buy, they provide liquidity by selling to you. That drives the Volume Density up.
Consider whether the market maker is currently long or short and might need to cover their position by wicking price back, or "adjust inventory". Especially towards the end of a market session.
Consider dense candles during market gaps or weekends to be market manipulation moves.
The density also goes up when stop losses are hit. If price makes a higher high or lower low, high density could indicate a liquidation event.
Binance Estimaed Liquidations indicator/strategy
1) Provides ESTIMATED liquidation amount based od difference on volume between binance futures and coinbase spot(by default, you can change this)
2) Provides some strategies based on this numbers
