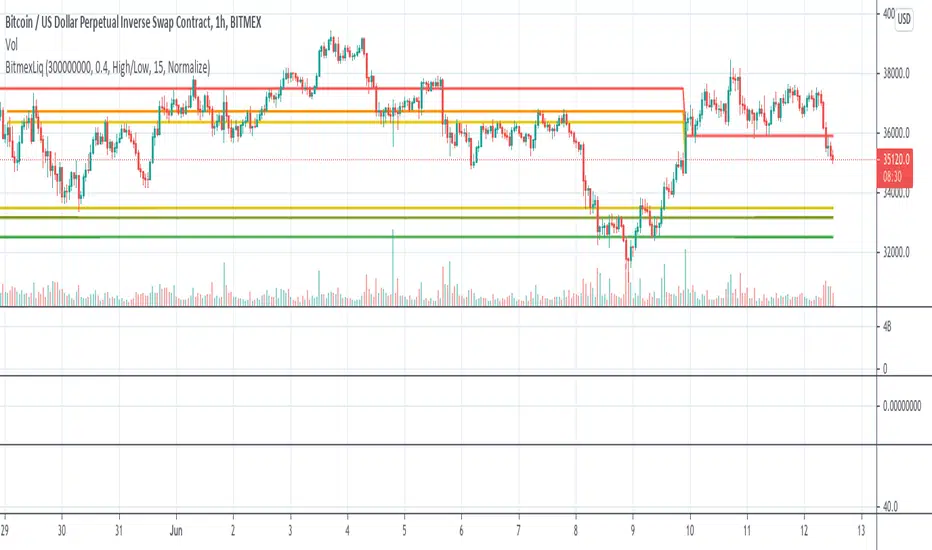
BitMEX Liquidation LevelsThis indicator plots BitMEX liquidation levels:
- 25x
- 50x
- 100x
The indicator works as following:
The underlying assumption (as with all liquidation calculations) obviously is that traders used fixed margin or go "all in" on their cross-margin account.
You then can configure a minimum trade volume and a minimum price change in percent for a candle to start computing liquidation levels from that candle
Additionally: configure the price base for the liqudation level: Candle high or low (default) works well, but you can also set "candle close" or "median high/low"
The indicator will then plot horizontal lines on the main chart showing price levels where many positions opened at the configured "start candle" will likely get liquidated.
It works for all BitMEX contracts and while it has been optimized for BitMEX, it will work on other exchanges with the same leverage levels (25x, 50x, 100x) and maintenance margin requirements too.
This indicator uses the Smart Volume indicator to compute the volume at the "start volume candle" setting where the liquidation level starts. This indicator can be found here: Smart Volume:
在脚本中搜索"Liquidation"
strategy_helpersThis library is designed to aid traders and developers in calculating risk metrics efficiently across different asset types like equities, futures, and forex. It includes comprehensive functions that calculate the number of units or contracts to trade, the value at risk, and the total value of the position based on provided entry prices, stop levels, and risk percentages. Whether you're managing a portfolio or developing trading strategies, this library provides essential tools for risk management. Functions also automatically select the appropriate risk calculation method based on asset type, calculate leverage levels, and determine potential liquidation points for leveraged positions. Perfect for enhancing the precision and effectiveness of your trading strategies.
Library "strategy_helpers"
Provides tools for calculating risk metrics across different types of trading strategies including equities, futures, and forex. Functions allow for precise control over risk management by calculating the number of units or contracts to trade, the value at risk, and the total position value based on entry prices, stop levels, and desired risk percentage. Additional utilities include automatic risk calculation based on asset type, leverage level calculations, and determination of liquidation levels for leveraged trades.
calculate_risk(entry, stop_level, stop_range, capital, risk_percent, trade_direction, whole_number_buy)
Calculates risk metrics for equity trades based on entry, stop level, and risk percent
Parameters:
entry (float) : The price at which the position is entered. Use close if you arent adding to a position. Use the original entry price if you are adding to a position.
stop_level (float) : The price level where the stop loss is placed
stop_range (float) : The price range from entry to stop level
capital (float) : The total capital available for trading
risk_percent (float) : The percentage of capital risked on the trade. 100% is represented by 100.
trade_direction (bool) : True for long trades, false for short trades
whole_number_buy (bool) : True to adjust the quantity to whole numbers
Returns: A tuple containing the number of units to trade, the value at risk, and the total value of the position:
calculate_risk_futures(risk_capital, stop_range)
Calculates risk metrics for futures trades based on the risk capital and stop range
Parameters:
risk_capital (float) : The capital allocated for the trade
stop_range (float) : The price range from entry to stop level
Returns: A tuple containing the number of contracts to trade, the value at risk, and the total value of the position:
calculate_risk_forex(entry, stop_level, stop_range, capital, risk_percent, trade_direction)
Calculates risk metrics for forex trades based on entry, stop level, and risk percent
Parameters:
entry (float) : The price at which the position is entered. Use close if you arent adding to a position. Use the original entry price if you are adding to a position.
stop_level (float) : The price level where the stop loss is placed
stop_range (float) : The price range from entry to stop level
capital (float) : The total capital available for trading
risk_percent (float) : The percentage of capital risked on the trade. 100% is represented by 100.
trade_direction (bool) : True for long trades, false for short trades
Returns: A tuple containing the number of lots to trade, the value at risk, and the total value of the position:
calculate_risk_auto(entry, stop_level, stop_range, capital, risk_percent, trade_direction, whole_number_buy)
Automatically selects the risk calculation method based on the asset type and calculates risk metrics
Parameters:
entry (float) : The price at which the position is entered. Use close if you arent adding to a position. Use the original entry price if you are adding to a position.
stop_level (float) : The price level where the stop loss is placed
stop_range (float) : The price range from entry to stop level
capital (float) : The total capital available for trading
risk_percent (float) : The percentage of capital risked on the trade. 100% is represented by 100.
trade_direction (bool) : True for long trades, false for short trades
whole_number_buy (bool) : True to adjust the quantity to whole numbers, applicable only for non-futures and non-forex trades
Returns: A tuple containing the number of units or contracts to trade, the value at risk, and the total value of the position:
leverage_level(account_equity, position_value)
Calculates the leverage level used based on account equity and position value
Parameters:
account_equity (float) : Total equity in the trading account
position_value (float) : Total value of the position taken
Returns: The leverage level used in the trade
calculate_liquidation_level(entry, leverage, trade_direction, maintenance_margine)
Calculates the liquidation price level for a leveraged trade
Parameters:
entry (float) : The price at which the position is entered
leverage (float) : The leverage level used in the trade
trade_direction (bool) : True for long trades, false for short trades
maintenance_margine (float) : The maintenance margin requirement, expressed as a percentage
Returns: The price level at which the position would be liquidated, or na if leverage is zero


Bitmex Liquidation Bands - JDA simple visual representation of leverage implications in Bitmex.
Can be used as a guide to place stops or targets to as the chart tends to jump from one liquidation point to another, most of the time.
Different leverages can be selected.
If I made a mistake in the percentages, please let me know so I can correct it! ;-)
JD.
#NotTradingAdvice #DYOR

Bitmex Liquidation levels VWMA'sThis script creates multiple MA's that signal likely price boundaries and trends. They are volume-weighted moving averages multiplied with Bitmex's liquidation level multiplicator.
Do not buy green MA touch and do not sell red MA touches.
//Recommended settings:
//M3: len = 300
//M5: len = 100
//M15: len = 50-75
//m30: len = 35
//h1: len = 13
//h4: len = 7
//h12: len = 3

BTC Agg VolumeBTC Volumes for stablecoin trading pairs from multiple exchanges. Volume is grouped by exchanged and appears as stacked bars. Volume data can be filtered by exchange and stablecoin pair. Appearance can be resized over with an option to apply standard deviations.

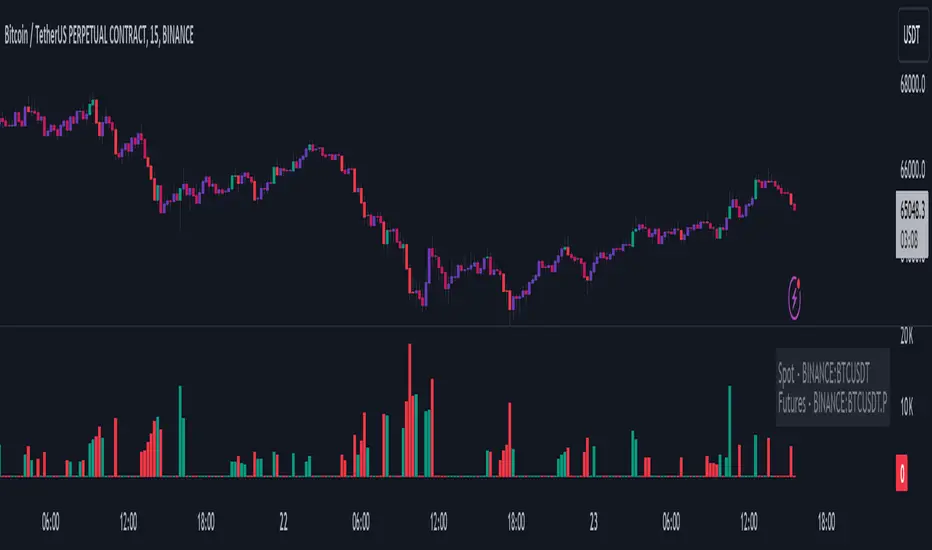
Volume Liqidations [EagleVSniper]The Volume Liquidations Indicator is designed for traders who want to spot significant liquidation events in the cryptocurrency markets, particularly between spot and futures volumes. This powerful tool auto-detects the trading asset and compares the volume data from both spot and futures markets to highlight potential high-volume liquidation points that can significantly impact price movement. Raw source code owner - tartigradia
Features:
Auto-Detect Functionality: Automatically identifies the current trading asset, providing an option for manual selection for both spot and futures symbols.
Volume Comparison: Calculates the difference between futures and spot volumes within a user-defined timeframe, helping to identify liquidation events.
Customizable Parameters: Offers customizable options for multipliers, lookback periods, and timeframe selection to tailor the indicator to your trading strategy.
Visual Indicators: Displays liquidation volumes as color-coded columns, with green indicating potential long liquidations and red for short liquidations. It also highlights bars that exceed the high-volume threshold, providing a clear visual cue for significant liquidation events.
Spot and Futures Volume MA: Includes optional moving average plots for both spot and futures volumes, allowing for a deeper analysis of market trends.
Highlighting High-Volatility Candles: The indicator uniquely colors candles that reach a predefined volatility threshold, determined by the user-set multiplier. This functionality aims to spotlight moments of significant market volatility, providing traders with immediate visual cues.
Dynamic Ticker Selection: Seamlessly switches between auto and manual ticker selection, providing flexibility for all types of traders.
How to Use:
Setup: Configure the indicator to your preferences. You can choose between automatic or manual ticker selection, set the multiplier for the high-volume threshold, and define the lookback period for the moving average calculation.
Analysis: The indicator plots differences in volume between futures and spot markets as columns on your chart, color-coded to indicate the direction of potential liquidations.
Decision Making: Use the indicator to identify potential liquidation events. High-volume thresholds are highlighted, suggesting significant market movements. Combine this information with other analysis tools to make informed trading decisions.
Liquidity Sweep Filter Strategy [AlgoAlpha X PineIndicators]This strategy is based on the Liquidity Sweep Filter developed by AlgoAlpha. Full credit for the concept and original indicator goes to AlgoAlpha.
The Liquidity Sweep Filter Strategy is a non-repainting trading system designed to identify liquidity sweeps, trend shifts, and high-impact price levels. It incorporates volume-based liquidation analysis, trend confirmation, and dynamic support/resistance detection to optimize trade entries and exits.
This strategy helps traders:
Detect liquidity sweeps where major market participants trigger stop losses and liquidations.
Identify trend shifts using a volatility-based moving average system.
Analyze volume distribution with a built-in volume profile visualization.
Filter noise by differentiating between major and minor liquidity sweeps.
How the Liquidity Sweep Filter Strategy Works
1. Trend Detection Using Volatility-Based Filtering
The strategy applies a volatility-adjusted moving average system to determine trend direction:
A central trend line is calculated using an EMA smoothed over a user-defined length.
Upper and lower deviation bands are created based on the average price deviation over multiple periods.
If price closes above the upper band, the strategy signals an uptrend.
If price closes below the lower band, the strategy signals a downtrend.
This approach ensures that trend shifts are confirmed only when price significantly moves beyond normal market fluctuations.
2. Liquidity Sweep Detection
Liquidity sweeps occur when price temporarily breaks key levels, triggering stop-loss liquidations or margin call events. The strategy tracks swing highs and lows, marking potential liquidity grabs:
Bearish Liquidity Sweeps – Price breaks a recent high, then reverses downward.
Bullish Liquidity Sweeps – Price breaks a recent low, then reverses upward.
Volume Integration – The strategy analyzes trading volume at each sweep to differentiate between major and minor sweeps.
Key levels where liquidity sweeps occur are plotted as color-coded horizontal lines:
Red lines indicate bearish liquidity sweeps.
Green lines indicate bullish liquidity sweeps.
Labels are displayed at each sweep, showing the volume of liquidated positions at that level.
3. Volume Profile Analysis
The strategy includes an optional volume profile visualization, displaying how trading volume is distributed across different price levels.
Features of the volume profile:
Point of Control (POC) – The price level with the highest traded volume is marked as a key area of interest.
Bounding Box – The profile is enclosed within a transparent box, helping traders visualize the price range of high trading activity.
Customizable Resolution & Scale – Traders can adjust the granularity of the profile to match their preferred time frame.
The volume profile helps identify zones of strong support and resistance, making it easier to anticipate price reactions at key levels.
Trade Entry & Exit Conditions
The strategy allows traders to configure trade direction:
Long Only – Only takes long trades.
Short Only – Only takes short trades.
Long & Short – Trades in both directions.
Entry Conditions
Long Entry:
A bullish trend shift is confirmed.
A bullish liquidity sweep occurs (price sweeps below a key level and reverses).
The trade direction setting allows long trades.
Short Entry:
A bearish trend shift is confirmed.
A bearish liquidity sweep occurs (price sweeps above a key level and reverses).
The trade direction setting allows short trades.
Exit Conditions
Closing a Long Position:
A bearish trend shift occurs.
The position is liquidated at a predefined liquidity sweep level.
Closing a Short Position:
A bullish trend shift occurs.
The position is liquidated at a predefined liquidity sweep level.
Customization Options
The strategy offers multiple adjustable settings:
Trade Mode: Choose between Long Only, Short Only, or Long & Short.
Trend Calculation Length & Multiplier: Adjust how trend signals are calculated.
Liquidity Sweep Sensitivity: Customize how aggressively the strategy identifies sweeps.
Volume Profile Display: Enable or disable the volume profile visualization.
Bounding Box & Scaling: Control the size and position of the volume profile.
Color Customization: Adjust colors for bullish and bearish signals.
Considerations & Limitations
Liquidity sweeps do not always result in reversals. Some price sweeps may continue in the same direction.
Works best in volatile markets. In low-volatility environments, liquidity sweeps may be less reliable.
Trend confirmation adds a slight delay. The strategy ensures valid signals, but this may result in slightly later entries.
Large volume imbalances may distort the volume profile. Adjusting the scale settings can help improve visualization.
Conclusion
The Liquidity Sweep Filter Strategy is a volume-integrated trading system that combines liquidity sweeps, trend analysis, and volume profile data to optimize trade execution.
By identifying key price levels where liquidations occur, this strategy provides valuable insight into market behavior, helping traders make better-informed trading decisions.
Key use cases for this strategy:
Liquidity-Based Trading – Capturing moves triggered by stop hunts and liquidations.
Volume Analysis – Using volume profile data to confirm high-activity price zones.
Trend Following – Entering trades based on confirmed trend shifts.
Support & Resistance Trading – Using liquidity sweep levels as dynamic price zones.
This strategy is fully customizable, allowing traders to adapt it to different market conditions, timeframes, and risk preferences.
Full credit for the original concept and indicator goes to AlgoAlpha.

[MAD] Entrytool / Bybit-LinearThis indicator, "Entry Tool," was coded at request for Sandmann .
It is designed to provide traders with real-time feedback for strategizing entries, exits, and liquidation levels for trades initiated at that given moment.
The tool visualizes average entry prices, stop-loss levels, multiple take-profit targets, and potential liquidation prices, offering a comprehensive overview of possible trade outcomes. It aids traders in pre-planning their trades by visually simulating the impact of different trading decisions directly on the live chart. Each setting and parameter can be customized to align with individual trading strategies and risk tolerances, making this tool versatile for various trading styles, including day trading, swing trading, and position trading.
------------------------------
Steps to Use the Indicator:
1. Basic Setup:
Setup Type: Choose between "Long" or "Short" to set the direction of the trade.
Leverage: Adjust the leverage to understand its impact on your potential returns and liquidation price.
Tracking follows the close price, alternative you can enter a specific price.
2. Position Setup:
Initial Entry Amount: Set the starting amount for the trade.
Distance: First Increment Percentage from Entry price
Amount: Define the increase for the first incremental addition to the position and specify the amount to be added.
Distance: Second Increment Percentage from Entry
Amount: Set the increase for the second incremental addition and the corresponding amount.
3. Risk Management:
Stop-Loss (SL) Percentage: Set the percentage below or above the average entry price at which the position should be closed to minimize losses.
Take-Profit (TP) Percentages: Define up to four different profit target levels by specifying the percentage above or below the average entry price.
4. Visual Settings:
Box Colors: Customize the colors of the boxes that represent long and short positions to differentiate easily on the chart.
Box Extension: Determine the length by which the box extends beyond the current bar, which helps in visualizing the potential price movement.
Line Colors and Extensions: Select colors for various lines such as the Average Entry Line, Stop-Loss Line, Take-Profit Lines, and Liquidations Line. Adjust the length of these lines for better visibility.
Label Settings: Configure the distance of labels from their corresponding lines and set the font size for better readability.
5. Additional Features:
Liquidation Price Visualization: This new feature calculates and displays the liquidation price based on the current leverage and margin settings, giving traders a critical insight into their risk exposure.
Interactive Drag Point: Adjust the start price manually by dragging the point on the chart, which dynamically updates entry and exit levels as well as risk metrics.
Detailed Leverage Data Array: Input different scenarios with specific leverage, initial margin, and maintenance rates to see how these factors impact potential liquidation points.
6. Informations about leverage calculation
The data used are fetched from Bybit for Linear pairs to calculate the liquidations like in their documentation.
Keep in mind that other exchanges may calulate based on another formular.

Open Liquidity Heatmap [BigBeluga]Open Liquidity Heatmap is an indicator designed to display accumulated resting liquidity on the chart.
Unlike any other liquidity heatmap, this aims to accumulate liquidity at specific levels that build up over time, showing larger areas of liquidity.
🔶 FEATURES
The indicator includes the following settings:
Lookback : Used to determine the range calculation of the heatmap.
Leverage : Leverage of the liquidation (Counted as % in price, Example: 4.5 will return a distance from price of 4.5%, indicating any possible resting liquidity in this range).
Levels : Amount of levels to display (Each level is counted as liquidity resting on the chart; fewer levels will return a bigger area of liquidity sitting on the chart).
Mode : Apply a color gradient from the minimum liquidation to the maximum liquidity level. Set the maximum color gradient value (Counted as volume).
Offset : Automatically determine the offset range of the Volume Profiles. Manual offset of the Volume Profiles.
🔶 CALCULATION
for i = 0 to step - 1
float plotter = na
switch i
0 =>
plotter := hs
=>
plotter := hs - diff * ( i )
cls.hm.gnL(plotter)
cls.vp.put(plotter, 0)
We calculate levels like a normal volume profile with steps, from the highest point within the lookback to the lowest one. Each level will contain the corresponding amount of volume that the candle has closed in that range.
As we can see in the image above, we add liquidity each time the distance in % from price is between two levels.
Unlike many liquidity indicators that provide a single candle liquidity heatmap, this aims to add up liquidity (volume) in already present levels.
This can be extremely useful to see which levels are likely to be more liquid and tend to get a bigger reaction to the price.
Imagine it like a range of levels that each time price revisits that area, a new position area is added; we add volume in that area each time price visits that zone. Liquidity builds up in those zones, causing a bigger reaction to the price once the price visits it.
This indicator is not the same as a single candle heatmap like many others. What is a single candle heatmap?
A single candle heatmap is when a level is created on every new candle, coloring the level based on the total volume of it.
This indicator, on the contrary, aims to provide a more specific use by adding up liquidity each time price visits it.
🔶 BASIC DEMOSTRATION
This is a basic demonstration of how we can spot high liquidity points overall using confluence:
We see the POC of the liquidation in a low volume area of the normal volume profile adding up as confluence.
Resistance from the POC Volume Profile suggesting price will go lower.
Major long open liquidity down.
As we can see, price takes out all the long liquidity and right after pumping, indicating that all the major liquidity got taken out.
Some key note to take is that a POC in the liquidation heatmap in a low volume area of the normal Volume Profile add confluence of a possible big reaction in that zone.
In the forex market, we suggest to use a low distance from price (Leverage) while in a crypto market you can use the one that fit the best the current timeframe.
🔶 CONCLUSION
This indicator aims to show open resting liquidity that had built up over time, showing the most amount of liquidation in specific areas in an aggregated way unlike many liquidation heatmap indicators that show single-level liquidation.
🔶 RELATED SCRIPT

Liquidity Point LinesLiquidity Point Lines
The "Liquidity Point Lines" indicator helps traders identify potential areas of liquidity in the market by drawing lines at specific price levels where significant "liquidation events" may have occurred. These events are determined by analyzing the MACD Histogram and identifying pivot points that suggest strong movements, which are often associated with the flushing out of short or long positions.
How It Works
This indicator leverages the MACD Histogram to gauge the strength of price momentum. It then identifies pivot highs and lows within the MACD Histogram's values. When a significant pivot is detected, the indicator interprets this as a potential "liquidity point" — a price level where a substantial amount of buy or sell orders (often due to liquidations) may have been executed.
The indicator distinguishes between:
Shorts Liquidation Points (Resistance): These are identified when the MACD Histogram registers a pivot high, suggesting a strong upward movement that could have liquidated short positions. Lines are drawn at the high price of the bar where this pivot occurred.
Longs Liquidation Points (Support): Conversely, these are identified when the MACD Histogram registers a pivot low, indicating a strong downward movement that might have liquidated long positions. Lines are drawn at the low price of the bar where this pivot occurred.
Key Features and Settings
The "Liquidity Point Lines" indicator offers extensive customization to tailor its sensitivity and visual representation:
MACD Settings for Liquidity: Configure the underlying MACD calculation with adjustable Fast Length, Slow Length, Source, Signal Smoothing, and MA Types (SMA/EMA) for both the Oscillator and Signal Line.
Liquidity Points Settings:
Pivot Lookback Left/Right: Define the number of bars to look back on either side to identify a pivot in the MACD Histogram.
Dynamic Strength Thresholds: This powerful feature allows the indicator to dynamically calculate the significance of a liquidation event. When enabled, it uses the average absolute histogram value over a specified Dynamic Threshold Lookback Period and applies Small and Medium Threshold Factors to determine the strength (Small, Medium, or Large) of the liquidity point.
Fixed Strength Thresholds: If dynamic thresholds are disabled, you can set fixed numerical values for Small and Medium Histogram Thresholds to define the strength categories.
Color & Style Customization: Assign distinct colors for Small, Medium, and Large liquidation points, choose the Line Style (Solid, Dashed, Dotted), and set the Label Text Color.
Label X Offset (To Right): Adjust the horizontal position of the liquidity point labels on your chart.
Liquidity Points Management:
Max Active Liquidity Lines: Control the maximum number of liquidity lines displayed simultaneously on your chart. Older lines are automatically removed to maintain clarity, except for lines that have been "touched" (i.e., price has interacted with that liquidity level).
Visual Interpretation
Each liquidity line is colored according to the strength of the detected liquidation event, making it easy to visually assess the potential significance of the price level. Lines extend to the right, serving as ongoing reference points. When the price interacts with a liquidity line (i.e., "touches" it), the line and its corresponding label are removed, indicating that the liquidity at that level may have been absorbed.
This indicator can be a valuable tool for identifying potential support and resistance levels, understanding market reactions to "liquidation cascades," and informing your trading decisions.

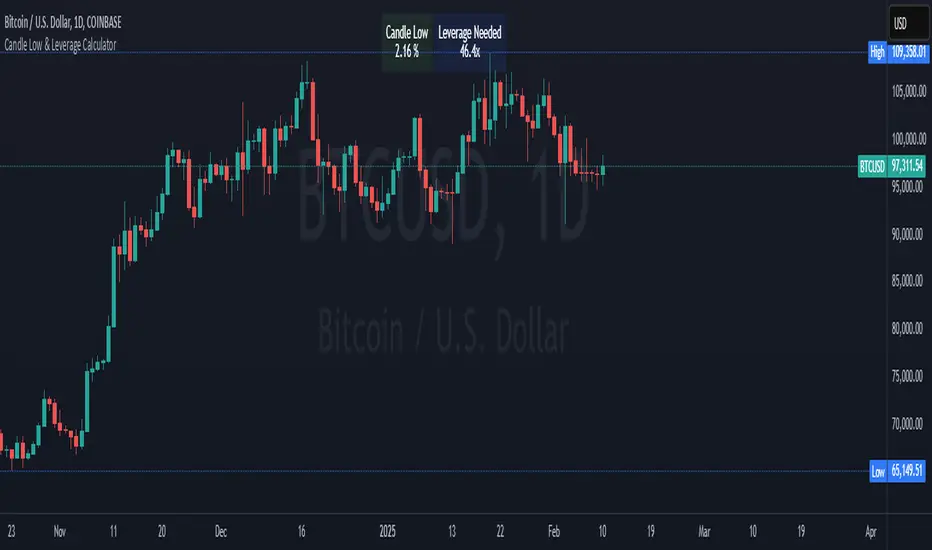
Crypto Candle Low Leverage TrackerCrypto Candle Low Leverage Tracker
The Candle Low Leverage Indicator is a powerful tool for long position traders seeking to manage risk effectively when using leverage. By evaluating the current candle's low price, this indicator helps traders make more informed decisions about potential entry points, stop losses, and leverage levels. The indicator matches the low of the candle to the leverage needed for liquidation, giving you a clear view of how leverage impacts your position.
This indicator provides two critical insights:
% from Candle Low: Tracks how much the price has moved from the low of the current candle. For long position traders, this percentage is crucial for understanding how far the price has come off the low and deciding whether it’s safe to enter a position or if further price action is needed.
Leverage Needed: Estimates the leverage required to reach the candle's low as the liquidation price. Long traders can use this information to adjust leverage to a safer level, ensuring they don’t overexpose themselves to liquidation risks by matching leverage to the candle’s low.
Key Features:
Customizable table positioning (top, middle, bottom).
Toggle options to show/hide % from Candle Low and Leverage Needed.
Visual indicators with color changes: green for positive change, red for negative change, and blue for leverage requirements.
Ideal for long traders, this tool helps evaluate market conditions, manage risks, and calculate the best leverage to use in long trades, ensuring that leverage aligns with the candle’s low to prevent unnecessary liquidations.
Liquidity Sweep Filter [AlgoAlpha]Unlock a deeper understanding of market liquidity with the Liquidity Sweep Filter by AlgoAlpha. This indicator identifies liquidity sweeps, highlighting key price levels where large liquidations have occurred. By visualizing major and minor liquidation events, traders can better anticipate potential reversals and market structure shifts, making this an essential tool for those trading in volatile conditions.
Key Features :
🔍 Liquidity Sweep Detection – Identifies and highlights areas where liquidity has been swept, distinguishing between major and minor liquidation events.
📊 Volume Profile Integration – Displays a volume profile overlay, helping traders spot high-activity price zones where the market is likely to react.
📈 Trend-Based Filtering – Utilizes an adaptive trend detection algorithm to refine liquidity sweeps based on market direction, reducing noise.
🎨 Customizable Visualization – Modify colors, thresholds, and display settings to tailor the indicator to your trading style.
🔔 Alerts for Liquidity Sweeps & Trend Changes – Stay ahead of the market by receiving alerts when significant liquidity events or trend shifts occur.
How to Use:
🛠 Add the Indicator : Add the Liquidity Sweep Filter to your chart and configure the settings based on your preferred sensitivity. Adjust the major sweep threshold to filter out smaller moves.
📊 Analyze Liquidity Zones and trend direction : Look for liquidation levels where large buy or sell stops have been triggered. Major sweeps indicate strong reactions, while minor sweeps show gradual liquidity absorption. You can also see which levels are high in liquidity by the transparency of the levels.
🔔 Set-Up Alerts : Use the in-built alerts so you don't miss a trading opportunity
How It Works :
The Liquidity Sweep Filter detects liquidity events by tracking swing highs and lows (defined as a pivot where neighboring candles are lower/higher than it) where traders are likely to have placed stop-loss orders. It evaluates volume and price action, marking areas where liquidity has been absorbed by the market. Additionally, the integrated trend filter ensures that only relevant liquidity sweeps are highlighted based on market direction, lows in an uptrend and highs in a downtrend. The trend filter works by calculating a basis, and defining trend shifts when the closing price crosses over the upper or lower bands.The included volume profile further enhances analysis by displaying key trading zones where price may react.

Position Size Using Manual Stop Loss [odnac]
This indicator calculates the risk per position based on user-defined settings.
Two Calculation Methods
1. Manual Stop Loss (%) & Manual Leverage
2. Manual Stop Loss (%) & Optimized Leverage
Settings
1. init_capital
Enter your current total capital.
2. Maximum Risk (%) per Position of Total Capital
Specify the percentage of your total funds to be risked for a single position.
3. manual_SL(%)
Enter the stop-loss percentage.
Range: 0.01 ~ 100
4. manual_leverage
Enter the leverage you wish to use.
Range: 1 ~ 100
Used in the first method (Manual Stop Loss (%) & Manual Leverage).
5. Safety Margin
Specify the safety margin for optimized leverage.
Range: 0.01 ~ 1
Used in the second method (Manual Stop Loss (%) & Optimized Leverage). Details are explained below.
Indicator Colors
Black: Indicates which method is being used.
White: Leverage.
First Green: Funds to be invested.
Second Green: Funds to be invested * Leverage.
First Red: Stop-loss (%).
Second Red: Stop-loss (%) * Leverage.
Details for Each Method:
1. Manual Stop Loss (%) & Manual Leverage
This method calculates the size of the funds based on user-defined stop-loss (%) and leverage settings.
White: manual_leverage.
First Green: Investment = Maximum Risk / (manual_SL / 100) / manual_leverage
Second Green: Maximum Risk * (manual_SL / 100)
First Red: manual_SL.
Second Red: manual_SL * manual_leverage
Ensure that the product of manual_SL and manual_leverage does not exceed 100.
If it does, there is a risk of liquidation.
2. Manual Stop Loss (%) & Optimized Leverage
This method calculates optimized leverage based on the user-defined stop-loss (%) and determines the size of the funds.
Optimization_LEVER = auto_leverage * safety_margin
auto_leverage = 100 / stop-loss (%), rounded down to the nearest whole number.
(Exception: If the stop-loss (%) is in the range of 0 ~ 1%, auto_leverage is always 100.)
Example:
If the stop-loss is 4%, auto_leverage = 25 (100 / 4 = 25).
However, 4% × 25 leverage equals 100%, meaning liquidation occurs even with a stop-loss.
To reduce this risk, the safety_margin value is applied.
White: auto_leverage * safety_margin
First Green: Investment = Maximum Risk / (manual_SL / 100) / optimization_LEVER
Second Green: Maximum Risk * (manual_SL / 100)
First Red: manual_SL.
Second Red: manual_SL * optimization_LEVER
Cuck WickAcknowledgement
This indicator is dedicated to my friend Alexandru who saved me from one of these scam cuck wicks which almost liquidated me.
Alexandru is one of the best scalpers out there and he always nails his entries at the tip of these wicks.
This inspired me to create this indicator.
What's a cuck wick?
It's that fast stop-hunting wick that cucks everyone by triggering their stop-loss and liquidation.
Liquidity is the lifeblood of stock market and liquidation is the process that moves price.
This indicator will identify when a liquidity pool is getting raided to trigger buy or sell stops, they are also know as stop-hunts.
How does it work?
When market consolidates in one direction, it builds up liquidity zones.
Market maker will break out of these consolidation phases by having dramatic price action to either pump or dump to raid these liquidity zones.
This is also called stop-hunts or liquidity raids. After that it will start reversing back to the opposite direction.
This is most noticeable by the length of the wick of a given candle in a very short amount of time and the total size of the candle.
This indicator highlights them accordingly.
Settings
Wick and Candle ratio works with default values but finetune will enhance user experience and usability.
Wick Ratio: Size of the wick compared to body of a candle.
Adjust this to higher ratio on smaller timeframe or smaller ratio on bigger timeframe to your trading style to spot a trend reversal.
Candle Ratio: The size of the candle, by default it is 0.75% of the current price.
For example, if BTC is at 20,000 then the size of the candle has to be minimum 150.
This can be fine tuned to bigger candle size on higher time frames or smaller for shorter timeframe depending on the trade type.
How to use it?
This indicator will identify when a liquidity pool is getting raided to trigger buy or sell stops, they are also know as stop-hunts. It can be used of its own for scalping but there are also a good few indicators which would most definitely help to confluence bigger timeframe trades.
Scalp
This indicator shows the most chaotic moments in price action; therefore it works best on smaller timeframes, ideally 3 or 5 minute candle.
- Wait for the market to start pumping or dumping.
- Current candle will change colour (Bullish/Bearish).
- Enter trade as soon as price starts to reverse back.
- Place the stop-loss outside of the current candle.
- Wait for the cuck wick to appear as confirmation.
Price is very chaotic during a liquidity stop-hunt raid but there is a saying:
"In the midst of chaos, there is also opportunity" - Sun-Tzu
Since this is a very high risk, high reward strategy; it is advised to practice on paper trade first.
Practice until perfection and this indicator would be the perfect bread and butter scalp confirmation.
Fair Value Gap
FVG strategy is the most accurate in conjunction with this indicator.
Normally price would reverse after consuming fair value gaps but often it's difficult to know when and where.
This indicator would identify those crucial entry points for reverse course direction of the price action.
Support and Resistance
This indicator can also be used in conjunction with support and resistance lines.
Generally the cuck will go deep below the support or spike much further up the resistance lines to liquidate positions.
Bollinger Bands
Bolling Bands strategy would be to wait until the price breaks out of the band.
Once the wick is formed, it would be an ideal entry point.
Script change
This is an open-source script and feel free to modify according to your need and to amplify your existing strategy.

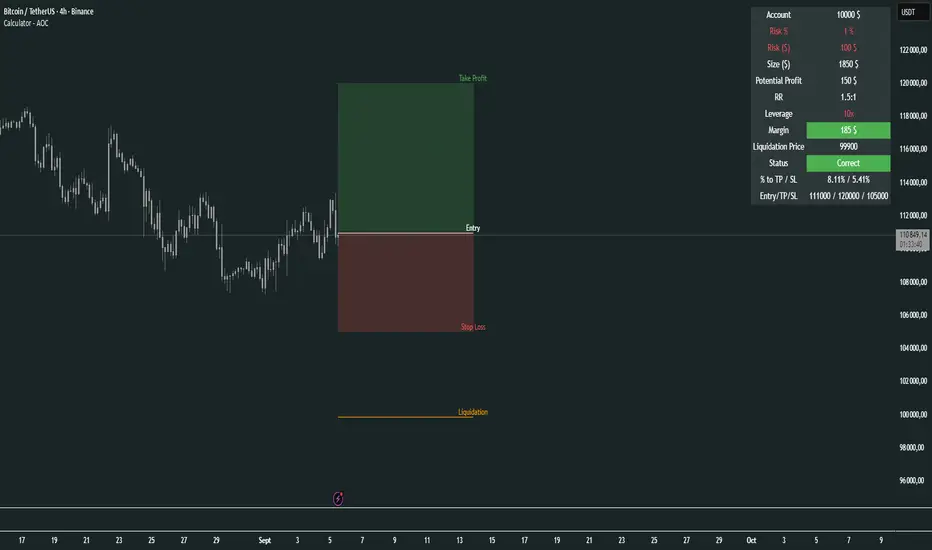
Calculator - AOC📊 Calculator - AOC Indicator 🚀
The Calculator - AOC indicator is a powerful and user-friendly tool designed for TradingView to help traders plan and visualize trades with precision. It calculates key trade metrics, displays entry, take-profit (TP), stop-loss (SL), and liquidation levels, and provides a clear overview of risk management and potential profits. Perfect for both novice and experienced traders! 💡
✨ Features
📈 Trade Planning: Input your Entry Price, Take Profit (TP), Stop Loss (SL), and Trade Direction (Long/Short) to visualize your trade setup on the chart.
💰 Risk Management: Set your Initial Capital and Risk per Trade (%) to calculate the optimal Position Size and Risk Amount for each trade.
⚖️ Leverage Support: Define your Leverage to compute the Required Margin and Liquidation Price, ensuring you stay aware of potential risks.
📊 Risk/Reward Ratio: Automatically calculates the Risk-to-Reward Ratio to evaluate trade profitability.
🎨 Visuals: Displays Entry, TP, SL, and Liquidation levels as lines and boxes on the chart, with customizable Line Width, Line Style, and Label Size.
✅ Trade Validation: Checks if your trade setup is valid (e.g., correct TP/SL placement) and highlights issues like potential liquidation risks with color-coded statuses (Correct ✅, Incorrect ❌, or Liquidation ⚠️).
📋 Summary Table: A clean, top-right table summarizes key metrics: Capital, Risk %, Risk Amount, Position Size, Potential Profit, Risk/Reward, Margin, Liquidation Price, Trade Status, and % to TP/SL.
🖌️ Customization: Adjust Line Extension (Bars) for how far lines extend, and choose from Solid, Dashed, or Dotted line styles for a personalized chart experience.
🛠️ How to Use
Add to Chart: Apply the indicator to your TradingView chart.
Configure Inputs:
Accountability: Set your Initial Capital and Risk per Trade (%).
Target: Enter Entry Price, TP, and SL prices.
Leverage: Specify your leverage (e.g., 10x).
Direction: Choose Long or Short.
Display Settings: Customize Line Width, Line Style, Label Size, and Line Extension.
Analyze: The indicator plots Entry, TP, SL, and Liquidation levels on the chart and displays a table with all trade metrics.
Validate: Check the Trade Status in the table to ensure your setup is valid or if adjustments are needed.
🎯 Why Use It?
Plan Smarter: Visualize your trade setup and understand your risk/reward profile instantly.
Stay Disciplined: Precise position sizing and risk calculations help you stick to your trading plan.
Avoid Mistakes: Clear validation warnings prevent costly errors like incorrect TP/SL placement or liquidation risks.
User-Friendly: Intuitive visuals and a summary table make trade analysis quick and easy.
📝 Notes
Ensure Entry, TP, and SL prices align with your trade direction to avoid "Incorrect" or "Liquidation" statuses.
The indicator updates dynamically on the latest bar, ensuring real-time visuals.
Best used with proper risk management to maximize trading success! 💪
Happy trading! 🚀📈
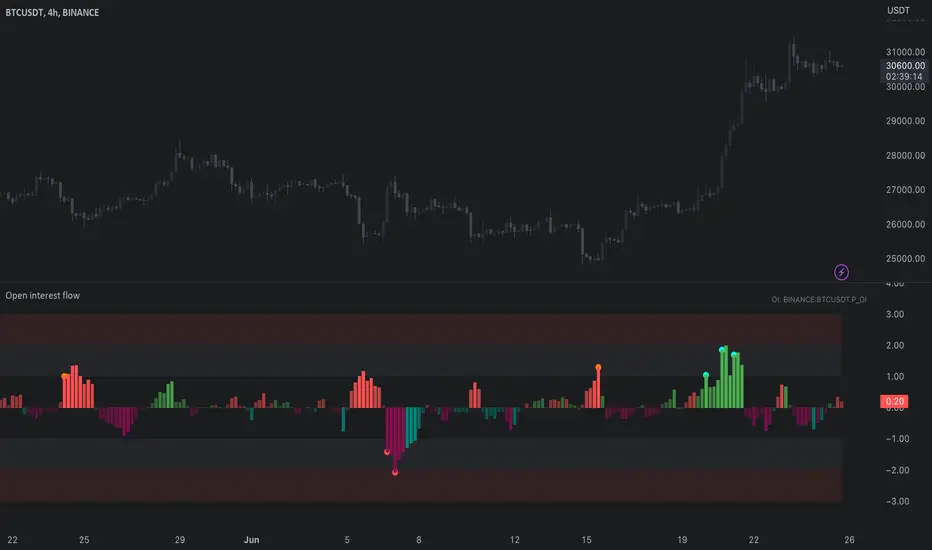
Open interest flow / quantifytools- Overview
Open interest flow detects inflows (positions opening) and outflows (positions closing) using open interest and estimates delta (net buyers/sellers) for the flows. Users are able to choose any open interest source available on Tradingview, by default set to BTCUSDT OI fetched from Binance. Using historical open interest flows, bands depicting typical magnitude of flows are formed for benchmarking intensity of flows. On the inflow side, +1 represents average inflows while +2 represents 2x above average inflows, a level considered an extreme. In a vice versa manner, -1 represents average outflows while -2 represents 2x above average outflows. Extreme inflows indicate aggressive position opening, in other words exuberance. Extreme outflows on the other hand indicate forced exiting of positions, in other words liquidations.
- Concept
Open interest flow is calculated using position of OI source relative to its moving average (by default set to SMA 10), referred to as relative open interest from hereon. When relative OI is positive (open interest is above its moving average), new positions are considered to enter the market. When relative OI is negative (open interest is below its moving average), existing positions are considered to exit the market. Open interest delta (side opening/closing positions, either net buyers/sellers) is calculated using relative price in a similar fashion to relative OI, but using close of viewed symbol as source. Price is considered to be up when relative price is positive, down when relative price is negative. Using relative OI and relative price in tandem, the following assumptions are applied:
Price up, open interest up = longs entering market
Price down, open interest up = shorts entering market
Price down, open interest down = longs exiting market
Price up, open interest down = shorts exiting market
Bands depicting magnitude of open interest flows are calculated using average turning points in relative OI. +1 and -1 represent levels where flows on average turn towards mean rather than continue to increase/decrease. These levels are then multiplied up to +2 and -2, representing two times larger deviations from the normal. When inflows are above 1, positions opening have reached a point where flows historically turn down. Therefore, anything above 1 would be abnormal amount of open interest entering, an extreme stretch being at 2 or above. Same logic applies to outflows, but in a vice versa manner (below -1 abnormal, extreme at -2)
Flow bursts further refine indications of aggressive inflows/outflows by taking into account change in open interest flows. Burst indications are activated when open interest is above its average turning point, coupled with a sufficient increase/decrease in flows simultaneously. Bursts are essentially a filtered version of abnormal flows and therefore a more reliable indication of exuberance/liquidations. Burst sensitivity can be adjusted via input menu, available in 5 settings. 1 sets OI burst requirements to loosest (more signals, more noise) while 5 sets OI burst requirements to strictest (less signals, less noise). Exact criteria applied to bursts can be viewed via input menu tooltip.
- Features
Users can opt for OI source auto-select for CRYPTO/USDT pairs. When auto-select is enabled and another chart is opened, corresponding open interest source is automatically selected as long as requirements mentioned above are met.
Open interest flows can be visualized as chart color, available separately for flow states and flow bursts.
Relative price line and flow guidelines (reminders for flow interpretation) can be enabled via input menu. All colors are customizable.
- Alerts
Available alerts are the following:
- Abnormal long inflows/outflows
- Abnormal short inflows/outflows
- Abnormal inflows/outflows from either side
- Aggressive longs/shorts (flow burst up)
- Liquidated longs/shorts (flow burst down)
- Aggressive or liquidated longs/shorts
- Practical guide
Open interest as a standalone data point does not reveal which side is likely opening/exiting positions and how extreme the participant behavior is. Using the additional data provided by open interest flows, moments of greed and fear can be detected. Smart money does not short into dips and buy into rips. When buyers or sellers have participated in a large move and continue to show interest even when efforts are not rewarded at an already overextended price, participants are asking for trouble.
Similar events can be observed when extreme outflows take place, indicating forced exits such as stop-losses triggering. When enough participants are forced out, price is likely to take the path of least resistance which is to the opposite direction.
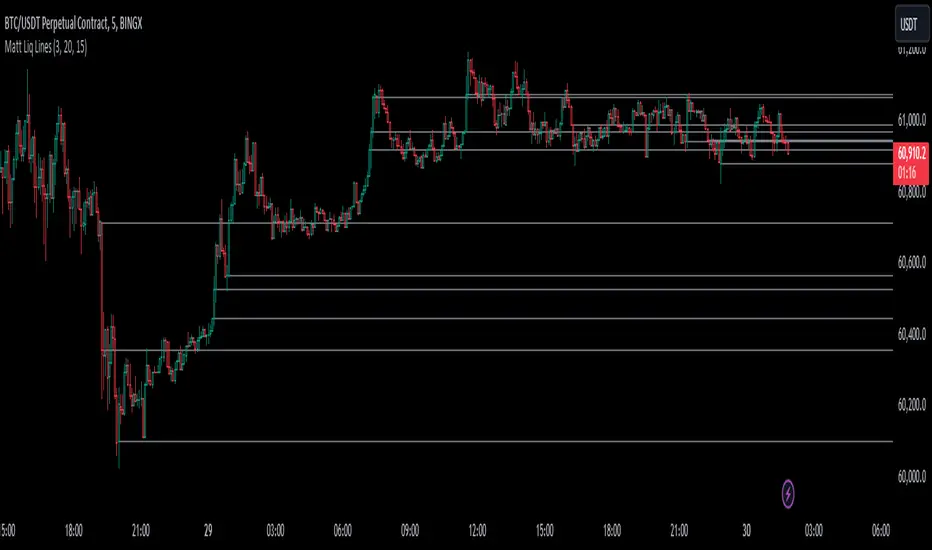
Matt Liq LinesIndicator Overview
The "Matt Liq Lines" indicator is designed to help traders identify significant price levels where high-volume trading occurred. These levels are often referred to as liquidation levels and can act as support or resistance in the market. The indicator plots horizontal lines on the chart at these identified levels, helping traders make informed decisions based on volume spikes.
Key Features
Volume Multiplier: A user-defined threshold to identify high-volume candles. If a candle's volume is greater than the average volume multiplied by this multiplier, it is considered a high-volume candle.
Lookback Period: The period over which the average volume is calculated. This helps in smoothing out volume data to identify significant spikes.
Max Levels: The maximum number of liquidation levels to display on the chart. This helps in keeping the chart clean and focuses on the most relevant levels.
Indicator Components
Average Volume Calculation:
avgVolume = ta.sma(volume, lookbackPeriod)
Calculates the simple moving average (SMA) of the volume over the specified lookback period.
High Volume Identification:
highVolume = volume > (avgVolume * volumeMultiplier)
Identifies if the current candle's volume is greater than the average volume multiplied by the volume multiplier.
Liquidation Levels Storage:
Uses arrays to store the levels, their corresponding bar indices, and volumes.
Adding Liquidation Levels:
When a high-volume candle is identified, its open price is added as a liquidation level. If the maximum number of levels is exceeded, the oldest level is removed to make room for the new one.
Cleaning Levels:
A function f_clean_levels removes crossed levels (where the price has already moved above and below the level) and keeps the levels with the highest volumes.
Plotting Liquidation Lines:
Horizontal lines are drawn at the identified liquidation levels. These lines extend to the right and help traders visualize important price levels.
How to Use the Indicator
Set the Volume Multiplier: Adjust the volume multiplier to filter out minor volume spikes and focus on significant ones.
Adjust the Lookback Period: Set a lookback period that reflects the typical trading volume for the asset you are analyzing.
Configure Max Levels: Decide the number of levels you want to display on the chart to avoid clutter.
Interpret the Lines: Use the plotted lines as potential support or resistance levels. These lines indicate where significant trading activity has occurred, which could influence future price movements.
By following these steps and understanding the indicator's components, traders can effectively use the "Matt Liq Lines" indicator to identify key price levels influenced by high trading volumes, aiding in better decision-making
Oath KeeperOath Keeper - Advanced Money Flow & Market Dynamics Indicator
A sophisticated indicator that analyzes market dynamics through money flow patterns, volume analysis, and liquidation detection to identify high-probability trading opportunities.
Core Features:
• Smart Money Flow Analysis: Proprietary calculation of institutional money movement
• Volume-Enhanced Signals: Multi-timeframe volume confirmation
• Liquidation Detection: Identifies potential forced liquidation events
• Advanced Signal Classification: Regular, Super, and Fakeout signals
Signal Types:
1. Regular Signals (Green/Purple Circles)
• Volume-confirmed momentum shifts
• Money flow threshold breaches
• Institutional participation confirmation
2. Super Signals (Green/Purple Squares)
• Deep oversold/overbought reversals
• High-volume rejection patterns
• Liquidation event confirmation
3. Fakeout Signals (Red X)
• Rapid sentiment shifts
• Trap detection
• False breakout warnings
Visual Components:
• Dynamic Money Flow Line (White/Purple)
• Order Flow Clouds (Green/Red with high transparency)
• Reference Levels (20, 50, 80)
• Multi-type Signal Markers
• Color-coded momentum visualization
Interpretation Guide:
• Green Cloud: Bullish money flow dominance
• Red Cloud: Bearish money flow dominance
• Circle Markers: Standard reversals
• Square Markers: High-conviction moves
• X Markers: Potential trap zones
Best Practices:
• Most effective on 1H+ timeframes
• Use with major trading pairs
• Wait for candle close confirmation
• Combine with support/resistance levels
• Monitor volume confirmation
• Use multiple timeframe analysis
This indicator helps traders identify institutional money flow, potential liquidation events, and market reversals by analyzing volume patterns and money flow dynamics, providing multiple confirmation layers for trade decisions.
Note: Performance varies with market conditions and timeframes. Always employ proper risk management.
Golden Pocket Syndicate [GPS]Golden Pocket Syndicate is a multi-layered market analysis toolkit built for precision entries and sniper-style reversals in both trending and ranging conditions. The script fuses volume dynamics, golden pocket structures, market maker behavior, and liquidation cluster tracking into one high-confluence system.
Core Features:
• 📐 Golden Pocket Zones: Dynamic GP levels from daily, weekly, monthly, and yearly timeframes. These levels update in real-time and serve as confluence zones for entries and exits.
• 📊 WaveTrend Divergence Diamonds: Momentum shifts are detected using a custom filtered WaveTrend cross system to mark high-probability reversal conditions.
• 🧠 Market Maker Premium Divergence: Tracks price dislocation between CME and Binance to detect large player manipulation using a configurable premium threshold.
• 💎 MM Reversal Diamonds: Identifies potential market maker traps and large player pivots using historical candle behavior, EMA alignment, and price structure breaks.
• 📉 Stealth Liquidation Cluster Arrows: Volume-based liquidation pressure visualized as lightweight directional arrows based on calculated wick expansion and volume bursts. Highlights key zones where price is likely to bounce or reject.
• 🧭 Trend Validation: Uses volume-based trend conditions and short-term EMA positioning to further qualify signals and eliminate noise.
How to Use:
This indicator is designed to help traders visualize confluence between key institutional price levels, momentum shifts, and volume-based pressure points. Long/short opportunities can be explored at marked reversal diamonds or liquidation zones that align with key GP levels. Intended for use on higher timeframes (15m to 4H), though flexible across any pair or market.

Trading TP SL Risk Commission Calculator🎉 Introducing Your Trading TP SL Risk Commission Calculator! 🎉
Hey there, savvy trader! 🚀 Are you looking to enhance your trading game? Meet the Trading TP SL Risk Commission Calculator! This handy tool is here to guide you through the complexities of trading, providing insights into your potential risks and rewards. Let's walk through how you can leverage it for smarter trading decisions!
Setting Up 🛠
Let's get your calculator ready for action:
Lines and Labels Visibility: Flip this switch on to see your Entry, Take Profit (TP), Stop Loss (SL), and Liquidation points displayed on your chart. It's a great way to get a visual summary of your strategy.
Input Your Trade Details: Enter your Entry Price, Take Profit Price, and Stop Loss Price. These figures are crucial for mapping out your trade.
Order Info: Specify your Order Size in USD, the amount of Leverage you're using, and your platform's Commission Rate. This customizes the calculator to fit your unique trading setup.
Customizing Your View 🎨
Table Placement & Size: Pick the location and size for your results table to appear on your screen. Tailor it to your liking, whether you prefer it out of the way or front and center.
Deciphering Your Results 📊
With your inputs in place, the calculator springs into action. Here's what you'll find:
Risk Assessment (with Emojis!): Quickly gauge your risk level with our intuitive emoji system, ranging from "⛔️⛔️⛔️" (very high risk) to "✅✅✅" (very low risk).
Profit and Loss Insights: Understand your potential take-profit gains and stop-loss implications, both as percentages and in USD. We also factor in fees to give you a clear picture.
Liquidation Alert: For those using leverage, the liquidation price calculation is crucial to avoid unpleasant surprises.
Expert Tips 💡
Stay Flexible: Market conditions evolve, so should your strategy. Revisit and adjust your inputs regularly to stay aligned with your trading goals.
Risk Emoji Check: Keep an eye on your risk level emojis. A sea of "⛔️" might signal it's time to reassess your approach.
Use Visual Guides: The on-chart lines and labels offer a quick visual reference to how your current trade measures up against your TP, SL, and liquidation thresholds.
Dive In and Trade Smart! 🚦
This calculator isn't just about making calculations; it's about empowering you to make informed trading decisions. With this tool in your arsenal, you're equipped to navigate the trading waters with confidence and clarity.

Crypto Perp Calc v1Advanced Perpetual Position Calculator for TradingView
Description
A comprehensive position sizing and risk management tool designed specifically for perpetual futures trading. This indicator eliminates the confusion of calculating leveraged positions by providing real-time position metrics directly on your chart.
Key Features:
Interactive Price Selection: Click directly on chart to set entry, stop loss, and take profit levels
Accurate Lot Size Calculation: Instantly calculates the exact position size needed for your margin and leverage
Multiple Entry Support: DCA into positions with up to 3 entry points with customizable allocation
Multiple Take Profit Levels: Scale out of positions with up to 3 TP targets
Comprehensive Risk Metrics: Shows dollar P&L, account risk percentage, and liquidation price
Visual Risk/Reward: Color-coded boxes and lines display your trade setup clearly
Real-time Info Table: All critical position data in one organized panel
Perfect for traders using perpetual futures who need precise position sizing with leverage.
---------
How to Use
Quick Start (3 Clicks)
1. Add the indicator to your chart
2. Click three times when prompted:
First click: Set your entry price
Second click: Set your stop loss
Third click: Set your take profit
3. Read the TOTAL LOTS value from the info table (highlighted in yellow)
4. Use this lot size in your exchange when placing the trade
Detailed Setup
Step 1: Configure Your Account
Enter your account balance (total USDT in account)
Set your margin amount (how much USDT to risk on this trade)
Choose your leverage (1x to 125x)
Select Long or Short position
Step 2: Set Price Levels
Main levels use interactive clicking (Entry, SL, TP)
For multiple entries or TPs, use the settings panel to manually input prices and percentages
Step 3: Read the Results
The info table shows:
TOTAL LOTS - The position size to enter on your exchange
Margin Used - Your actual capital at risk
Notional - Total position value (margin × leverage)
Max Risk - Dollar amount you'll lose at stop loss
Total Profit - Dollar amount you'll gain at take profit
R:R Ratio - Risk to reward ratio
Account Risk - Percentage of account at risk
Liquidation - Price where position gets liquidated
Step 4: Advanced Features (Optional)
Multiple Entries (DCA):
Enable "Use Multiple Entries"
Set up to 3 entry prices
Allocate percentage for each (must total 100%)
See individual lot sizes for each entry
Multiple Take Profits:
Enable "Use Multiple TPs"
Set up to 3 TP levels
Allocate percentage to close at each level (must total 100%)
View profit at each target
Visual Elements
Blue lines/labels: Entry points
Red lines/labels: Stop loss
Green lines/labels: Take profit targets
Colored boxes: Visual risk (red) and reward (green) zones
Info table: Can be positioned anywhere on screen
Alerts
Set price alerts for:
Entry zones reached
Stop loss approached
Take profit levels hit
Works with TradingView's alert system
Tips for Best Results
Always verify the lot size matches your intended risk
Check the liquidation price stays far from your stop loss
Monitor the account risk percentage (recommended: keep under 2-3%)
Use the warning indicators if risk exceeds margin
For quick trades, use single entry/TP; for complex strategies, use multiple levels
Example Workflow
Find your trade setup using your analysis
Add this indicator and click to set levels
Check risk metrics in the table
Copy the TOTAL LOTS value
Enter this exact position size on your exchange
Set alerts for key levels if desired
This tool bridges the gap between TradingView charting and exchange execution, ensuring your position sizing is always accurate when trading with leverage.
Disclaimer, this was coded with help of AI, double check calculations if they are off.

TitanGrid L/S SuperEngineTitanGrid L/S SuperEngine
Experimental Trend-Aligned Grid Signal Engine for Long & Short Execution
🔹 Overview
TitanGrid is an advanced, real-time signal engine built around a tactical grid structure.
It manages Long and Short trades using trend-aligned entries, layered scaling, and partial exits.
Unlike traditional strategy() -based scripts, TitanGrid runs as an indicator() , but includes its own full internal simulation engine.
This allows it to track capital, equity, PnL, risk exposure, and trade performance bar-by-bar — effectively simulating a custom backtest, while remaining compatible with real-time alert-based execution systems.
The concept was born from the fusion of two prior systems:
Assassin’s Grid (grid-based execution and structure) + Super 8 (trend-filtering, smart capital logic), both developed under the AssassinsGrid framework.
🔹 Disclaimer
This is an experimental tool intended for research, testing, and educational use.
It does not provide guaranteed outcomes and should not be interpreted as financial advice.
Use with demo or simulated accounts before considering live deployment.
🔹 Execution Logic
Trend direction is filtered through a custom SuperTrend engine. Once confirmed:
• Long entries trigger on pullbacks, exiting progressively as price moves up
• Short entries trigger on rallies, exiting as price declines
Grid levels are spaced by configurable percentage width, and entries scale dynamically.
🔹 Stop Loss Mechanism
TitanGrid uses a dual-layer stop system:
• A static stop per entry, placed at a fixed percentage distance matching the grid width
• A trend reversal exit that closes the entire position if price crosses the SuperTrend in the opposite direction
Stops are triggered once per cycle, ensuring predictable and capital-aware behavior.
🔹 Key Features
• Dual-side grid logic (Long-only, Short-only, or Both)
• SuperTrend filtering to enforce directional bias
• Adjustable grid spacing, scaling, and sizing
• Static and dynamic stop-loss logic
• Partial exits and reset conditions
• Webhook-ready alerts (browser-based automation compatible)
• Internal simulation of equity, PnL, fees, and liquidation levels
• Real-time dashboard for full transparency
🔹 Best Use Cases
TitanGrid performs best in structured or mean-reverting environments.
It is especially well-suited to assets with the behavioral profile of ETH — reactive, trend-intraday, and prone to clean pullback formations.
While adaptable to multiple timeframes, it shows strongest performance on the 15-minute chart , offering a balance of signal frequency and directional clarity.
🔹 License
Published under the Mozilla Public License 2.0 .
You are free to study, adapt, and extend this script.
🔹 Panel Reference
The real-time dashboard displays performance metrics, capital state, and position behavior:
• Asset Type – Automatically detects the instrument class (e.g., Crypto, Stock, Forex) from symbol metadata
• Equity – Total simulated capital: realized PnL + floating PnL + remaining cash
• Available Cash – Capital not currently allocated to any position
• Used Margin – Capital locked in open trades, based on position size and leverage
• Net Profit – Realized gain/loss after commissions and fees
• Raw Net Profit – Gross result before trading costs
• Floating PnL – Unrealized profit or loss from active positions
• ROI – Return on initial capital, including realized and floating PnL. Leverage directly impacts this metric, amplifying both gains and losses relative to account size.
• Long/Short Size & Avg Price – Open position sizes and volume-weighted average entry prices
• Leverage & Liquidation – Simulated effective leverage and projected liquidation level
• Hold – Best-performing hold side (Long or Short) over the session
• Hold Efficiency – Performance efficiency during holding phases, relative to capital used
• Profit Factor – Ratio of gross profits to gross losses (realized)
• Payoff Ratio – Average profit per win / average loss per loss
• Win Rate – Percent of profitable closes (including partial exits)
• Expectancy – Net average result per closed trade
• Max Drawdown – Largest recorded drop in equity during the session
• Commission Paid – Simulated trading costs: maker, taker, funding
• Long / Short Trades – Count of entry signals per side
• Time Trading – Number of bars spent in active positions
• Volume / Month – Extrapolated 30-day trading volume estimate
• Min Capital – Lowest equity level recorded during the session
🔹 Reference Ranges by Strategy Type
Use the following metrics as reference depending on the trading style:
Grid / Mean Reversion
• Profit Factor: 1.2 – 2.0
• Payoff Ratio: 0.5 – 1.2
• Win Rate: 50% – 70% (based on partial exits)
• Expectancy: 0.05% – 0.25%
• Drawdown: Moderate to high
• Commission Impact: High
Trend-Following
• Profit Factor: 1.5 – 3.0
• Payoff Ratio: 1.5 – 3.5
• Win Rate: 30% – 50%
• Expectancy: 0.3% – 1.0%
• Drawdown: Low to moderate
Scalping / High-Frequency
• Profit Factor: 1.1 – 1.6
• Payoff Ratio: 0.3 – 0.8
• Win Rate: 80% – 95%
• Expectancy: 0.01% – 0.05%
• Volume / Month: Very high
Breakout Strategies
• Profit Factor: 1.4 – 2.2
• Payoff Ratio: 1.2 – 2.0
• Win Rate: 35% – 60%
• Expectancy: 0.2% – 0.6%
• Drawdown: Can be sharp after failed breakouts
🔹 Note on Performance Simulation
TitanGrid includes internal accounting of fees, slippage, and funding costs.
While its logic is designed for precision and capital efficiency, performance is naturally affected by exchange commissions.
In frictionless environments (e.g., zero-fee simulation), its high-frequency logic could — in theory — extract substantial micro-edges from the market.
However, real-world conditions introduce limits, and all results should be interpreted accordingly.
