Leverage Aware Trade OptimizerWelcome to the Leverage-Aware Trade Optimizer (LATO)! I’m thrilled to have you exploring this dynamic algorithm! LATO combines advanced market oscillation tracking, leverage-aware trade optimization, and real-time market analysis to help you make smarter, more informed trading decisions. Whether you're just starting or you’re an experienced trader, LATO provides powerful tools and insights to enhance your strategies. LATO is here to support you in optimizing your trades with precision, so feel free to dive in and explore all the features. Let’s make your trading experience as effective and rewarding as possible. Safe trading!
Leverage-Aware Trade Optimizer (LATO)
Short Title: LATO
Category: Trading Tools / Technical Analysis
Overview
The Leverage-Aware Trade Optimizer (LATO) is a powerful algorithm designed to track and analyze market oscillations, identify reversal zones, and provide dynamic trading levels for optimal decision-making. With built-in risk management features, LATO enhances traders’ ability to make well-informed decisions based on a comprehensive range of market indicators, including price oscillations, probabilities, and leverage-related risks.
Key Features
Comprehensive Market Oscillation Tracking: LATO utilizes advanced indicators such as the Indexed Position Oscillator (IPO), Candle Relative Percentage (CRP), and Oscillating Range Indicator (ORI) to track price fluctuations and detect key market oscillations, providing a detailed view of price movements.
Dynamic Price Levels for Trading Decisions: The script calculates critical price levels such as WAP, WBP, XAP, and XBP. These weighted and expanded prices help identify potential support and resistance zones for accurate trade entries and exits.
Reversal Detection and Trend Identification: LATO is designed to recognize top and bottom reversal zones using user-defined thresholds (e.g., upper_reversal, lower_reversal). The algorithm signals potential trend changes with event markers such as UP, DOWN, UIP, and DIP, enabling traders to anticipate market reversals.
Risk and Leverage Mapping: By estimating liquidation levels for various leverage values (5x, 10x, 20x, etc.), LATO assists in risk management, helping traders visualize leverage exposure and optimize their trades according to risk tolerance.
Integrated Visualization and Event Labels: LATO enhances visual analysis by plotting key levels, trend lines, and event markers on the chart. Custom labels summarize critical values, including SOD (Sell Odds), BOD (Buy Odds), ORI (Oscillating Range Indicator), and PVI (Price Volatility Index), offering a quick, actionable summary for traders.
User Inputs
Orders Deviation (order_deviation): Controls the deviation for calculating trade levels.
Top Reversal (upper_reversal): Sets the threshold for the upper reversal zone.
Bottom Reversal (lower_reversal): Sets the threshold for the lower reversal zone.
How It Works
LATO tracks market oscillations through the Indexed Position Oscillator (IPO) and Candle Relative Percentage (CRP), dynamically adjusting as the market fluctuates. The algorithm then identifies key levels using weighted prices (e.g., WAP, WBP) and generates reversal signals based on defined thresholds.
Once the Leverage-Aware Trade Optimizer (LATO) is applied to a chart, it automatically calculates dynamic support and resistance levels and identifies potential buying or selling opportunities. The script also plots liquidation zones based on different leverage levels and visualizes these areas through color-coded lines.
Use Case Scenarios
Trend Reversal Detection: Identify when the market is likely to reverse based on the ORI and price action.
Dynamic Price Levels: Use the weighted price levels and trend lines to pinpoint entry/exit points.
Leverage Risk Management: Monitor liquidation levels and use them for managing risk while trading with leverage.
Oscillation Tracking: Track key oscillations for detecting overbought or oversold conditions.
Alert Setup for LATO
You can set up alerts based on the key conditions like UP, DOWN, UIP, and DIP, as well as specific market movements.
Down Trend Alert (DOWN): Alerts when there’s a downtrend, triggered by a crossover of WBP and BL5, with specific conditions for ORI and SOD.
Up Trend Alert (UP): Alerts when there’s an uptrend, triggered by a crossunder of WAP and SL5, with ORI below -0.5.
Upper Reversal Alert (UIP): Alerts when ORI crosses below the lower_reversal threshold.
Downward Reversal Alert (DIP): Alerts when ORI crosses above the upper_reversal threshold.
Conclusion
The Leverage-Aware Trade Optimizer (LATO) is a comprehensive trading tool designed for traders seeking to optimize their trade entries and exits. By combining multiple indicators, dynamic price levels, and reversal zone detection, LATO offers an advanced approach to market analysis and decision-making. Whether you’re trading with leverage or simply looking for trend confirmation, LATO provides the insights you need to maximize your trading potential.
Notes
This script is designed to be used on any time frame.
Adjust the order_deviation parameter based on the asset volatility you are trading.
The reversal thresholds (upper and lower) should be fine-tuned depending on market conditions.
在脚本中搜索"Liquidation"

Ultra Supply & DemandThe "Ultra Supply & Demand" indicator is a sophisticated tool designed for traders looking to analyze market sentiment and potential price movements with a focus on supply and demand dynamics. It overlays on the chart to visually represent areas of supply and demand, providing insights into market liquidity levels and potential reversal points.
Dynamic Supply & Demand Zones: Automatically identifies and displays supply and demand zones based on trading volume and price action patterns. These zones are color-coded for easy identification and can be customized according to user preferences.
Volume-Based Analysis: Utilizes volume data to calculate supply and demand volumes, offering a deeper understanding of market strength behind these zones. Users can set a threshold for volume to filter out less significant signals.
Customizable Liquidation Levels: Offers three predefined liquidation level settings ("1st Touch," "Middle," "Fully") to help traders determine the depth of supply and demand zones. Users can also customize these settings to fit their trading strategy.
Real-time Updates: Continuously updates supply and demand zones as new bars form, ensuring that the information remains current and relevant throughout the trading session.
User-friendly Interface: Provides clear visual cues through color coding and labels, making it easier for traders to interpret the market conditions at a glance. Volume data can be displayed alongside the zones for added context.
Usage Instructions:
Add the Ultra Supply & Demand indicator to your chart.
Customize the indicator settings according to your trading style and preferences, including the display of volume, liquidation levels, and color schemes.
Observe the supply and demand zones on the chart. Look for divergences between price action and the indicator's zones as potential trade setups.
Combine the indicator with other technical analysis tools and indicators to confirm trade signals and enhance your decision-making process.

Price Action Smart Money Concepts [BigBeluga]THE SMART MONEY CONCEPTS Toolkit
The Smart Money Concepts [ BigBeluga ] is a comprehensive toolkit built around the principles of "smart money" behavior, which refers to the actions and strategies of institutional investors.
The Smart Money Concepts Toolkit brings together a suite of advanced indicators that are all interconnected and built around a unified concept: understanding and trading like institutional investors, or "smart money." These indicators are not just randomly chosen tools; they are features of a single overarching framework, which is why having them all in one place creates such a powerful system.
This all-in-one toolkit provides the user with a unique experience by automating most of the basic and advanced concepts on the chart, saving them time and improving their trading ideas.
Real-time market structure analysis simplifies complex trends by pinpointing key support, resistance, and breakout levels.
Advanced order block analysis leverages detailed volume data to pinpoint high-demand zones, revealing internal market sentiment and predicting potential reversals. This analysis utilizes bid/ask zones to provide supply/demand insights, empowering informed trading decisions.
Imbalance Concepts (FVG and Breakers) allows traders to identify potential market weaknesses and areas where price might be attracted to fill the gap, creating opportunities for entry and exit.
Swing failure patterns help traders identify potential entry points and rejection zones based on price swings.
Liquidity Concepts, our advanced liquidity algorithm, pinpoints high-impact events, allowing you to predict market shifts, strong price reactions, and potential stop-loss hunting zones. This gives traders an edge to make informed trading decisions based on liquidity dynamics.
🔵 FEATURES
The indicator has quite a lot of features that are provided below:
Swing market structure
Internal market structure
Mapping structure
Adjustable market structure
Strong/Weak H&L
Sweep
Volumetric Order block / Breakers
Fair Value Gaps / Breakers (multi-timeframe)
Swing Failure Patterns (multi-timeframe)
Deviation area
Equal H&L
Liquidity Prints
Buyside & Sellside
Sweep Area
Highs and Lows (multi-timeframe)
🔵 BASIC DEMONSTRATION OF ALL FEATURES
1. MARKET STRUCTURE
The preceding image illustrates the market structure functionality within the Smart Money Concepts indicator.
➤ Solid lines: These represent the core indicator's internal structure, forming the foundation for most other components. They visually depict the overall market direction and identify major reversal points marked by significant price movements (denoted as 'x').
➤ Internal Structure: These represent an alternative internal structure with the potential to drive more rapid market shifts. This is particularly relevant when a significant gap exists in the established swing structure, specifically between the Break of Structure (BOS) and the most recent Change of High/Low (CHoCH). Identifying these formations can offer opportunities for quicker entries and potential short-term reversals.
➤ Sweeps (x): These signify potential turning points in the market where liquidity is removed from the structure. This suggests a possible trend reversal and presents crucial entry opportunities. Sweeps are identified within both swing and internal structures, providing valuable insights for informed trading decisions.
➤ Mapping structure: A tool that automatically identifies and connects significant price highs and lows, creating a zig-zag pattern. It visualizes market structure, highlights trends, support/resistance levels, and potential breakouts. Helps traders quickly grasp price action patterns and make informed decisions.
➤ Color-coded candles based on market structure: These colors visually represent the underlying market structure, making it easier for traders to quickly identify trends.
➤ Extreme H&L: It visualizes market structure with extreme high and lows, which gives perspective for macro Market Structure.
2. VOLUMETRIC ORDER BLOCKS
Order blocks are specific areas on a financial chart where significant buying or selling activity has occurred. These are not just simple zones; they contain valuable information about market dynamics. Within each of these order blocks, volume bars represent the actual buying and selling activity that took place. These volume bars offer deeper insights into the strength of the order block by showing how much buying or selling power is concentrated in that specific zone.
Additionally, these order blocks can be transformed into Breaker Blocks. When an order block fails—meaning the price breaks through this zone without reversing—it becomes a breaker block. Breaker blocks are particularly useful for trading breakouts, as they signal that the market has shifted beyond a previously established zone, offering opportunities for traders to enter in the direction of the breakout.
Here's a breakdown:
➤ Bear Order Blocks (Red): These are zones where a lot of selling happened. Traders see these areas as places where sellers were strong, pushing the price down. When the price returns to these zones, it might face resistance and drop again.
➤ Bull Order Blocks (Green): These are zones where a lot of buying happened. Traders see these areas as places where buyers were strong, pushing the price up. When the price returns to these zones, it might find support and rise again.
These Order Blocks help traders identify potential areas for entering or exiting trades based on past market activity. The volume bars inside blocks show the amount of trading activity that occurred in these blocks, giving an idea of the strength of buying or selling pressure.
➤ Breaker Block: When an order block fails, meaning the price breaks through this zone without reversing, it becomes a breaker block. This indicates a significant shift in market liquidity and structure.
➤ A bearish breaker block occurs after a bullish order block fails. This typically happens when there's an upward trend, and a certain level that was expected to support the market's rise instead gives way, leading to a sharp decline. This decline indicates that sellers have overcome the buyers, absorbing liquidity and shifting the sentiment from bullish to bearish.
Conversely, a bullish breaker block is formed from the failure of a bearish order block. In a downtrend, when a level that was expected to act as resistance is breached, and the price shoots up, it signifies that buyers have taken control, overpowering the sellers.
3. FAIR VALUE GAPS:
A fair value gap (FVG), also referred to as an imbalance, is an essential concept in Smart Money trading. It highlights the supply and demand dynamics. This gap arises when there's a notable difference between the volume of buy and sell orders. FVGs can be found across various asset classes, including forex, commodities, stocks, and cryptocurrencies.
FVGs in this toolkit have the ability to detect raids of FVG which helps to identify potential price reversals.
Mitigation option helps to change from what source FVGs will be identified: Close, Wicks or AVG.
4. SWING FAILURE PATTERN (SFP):
The Swing Failure Pattern is a liquidity engineering pattern, generally used to fill large orders. This means, the SFP generally occurs when larger players push the price into liquidity pockets with the sole objective of filling their own positions.
SFP is a technical analysis tool designed to identify potential market reversals. It works by detecting instances where the price briefly breaks a previous high or low but fails to maintain that breakout, quickly reversing direction.
How it works:
Pattern Detection: The indicator scans for price movements that breach recent highs or lows.
Reversal Confirmation: If the price quickly reverses after breaching these levels, it's identified as an SFP.
➤ SFP Display:
Bullish SFP: Marked with a green symbol when price drops below a recent low before reversing upwards.
Bearish SFP: Marked with a red symbol when price rises above a recent high before reversing downwards.
➤ Deviation Levels: After detecting an SFP, the indicator projects white lines showing potential price deviation:
For bullish SFPs, the deviation line appears above the current price.
For bearish SFPs, the deviation line appears below the current price.
These deviation levels can serve as a potential trading opportunity or areas where the reversal might lose momentum.
With Volume Threshold and Filtering of SFP traders can adjust their trading style:
Volume Threshold: This setting allows traders to filter SFPs based on the volume of the reversal candle. By setting a higher volume threshold, traders can focus on potentially more significant reversals that are backed by higher trading activity.
SFP Filtering: This feature enables traders to filter SFP detection. It includes parameters such as:
5. LIQUIDITY CONCEPTS:
➤ Equal Lows (EQL) and Equal Highs (EQH) are important concepts in liquidity-based trading.
EQL: A series of two or more swing lows that occur at approximately the same price level.
EQH: A series of two or more swing highs that occur at approximately the same price level.
EQLs and EQHs are seen as potential liquidity pools where a large number of stop loss orders or limit orders may be clustered. They can be used as potential reverse points for trades.
This multi-period feature allows traders to select less and more significant EQL and EQH:
➤ Liquidity wicks:
Liquidity wicks are a minor representation of a stop-loss hunt during the retracement of a pivot point:
➤ Buy and Sell side liquidity:
The buy side liquidity represents a concentration of potential buy orders below the current price level. When price moves into this area, it can lead to increased buying pressure due to the execution of these orders.
The sell side liquidity indicates a pool of potential sell orders below the current price level. Price movement into this area can result in increased selling pressure as these orders are executed.
➤ Sweep Liquidation Zones:
Sweep Liquidation Zones are crucial for understanding market structure and potential future price movements. They provide insights into areas where significant market participants have been forced out of their positions, potentially setting up new trading opportunities.
🔵 USAGE & EXAMPLES
The core principle behind the success of this toolkit lies in identifying "confluence." This refers to the convergence of multiple trading indicators all signaling the same information at a specific point or area. By seeking such alignment, traders can significantly enhance the likelihood of successful trades.
MS + OBs
The chart illustrates a highly bullish setup where the price is rejecting from a bullish order block (POC), while simultaneously forming a bullish Swing Failure Pattern (SFP). This occurs after an internal structure change, marked by a bullish Change of Character (CHoCH). The price broke through a bearish order block, transforming it into a breaker block, further confirming the bullish momentum.
The combination of these elements—bullish order blocks, SFP, and CHoCH—creates a powerful bullish signal, reinforcing the potential for upward movement in the market.
SFP + Bear OB
This chart above displays a bearish setup with a high probability of a price move lower. The price is currently rejecting from a bear order block, which represents a key resistance area where significant selling pressure has previously occurred. A Swing Failure Pattern (SFP) has also formed near this bear order block, indicating that the price briefly attempted to break above a recent high but failed to sustain that upward movement. This failure suggests that buyers are losing momentum, and the market could be preparing for a move to the downside.
Additionally, we can toggle on the Deviation Area in the SFP section to highlight potential levels where price deviation might occur. These deviation areas represent zones where the price is likely to react after the Swing Failure Pattern:
BUY – SELL sides + EQL
The chart showcases a bullish setup with a high probability of price breaking out of the current sell-side resistance level. The market structure indicates a formation of Equal Lows (EQL), which often suggests a build-up of liquidity that could drive the price higher.
The presence of strong buy-side pressure (69%), indicated by the green zone at the bottom, reinforces this bullish outlook. This area represents a key support zone where buyers are outpacing sellers, providing the foundation for a potential upward breakout.
EQL + Bull ChoCh
This chart illustrates a potential bullish setup, driven by the formation of Equal Lows (EQL) followed by a bullish Change of Character (CHoCH). The presence of Equal Lows often signals a liquidity build-up, which can lead to a reversal when combined with additional bullish signals.
Liquidity grab + Bull ChoCh + FVGs
This chart demonstrates a strong bullish scenario, where several important market dynamics are at play. The price begins its upward momentum from Liquidity grab following a bullish Change of Character (CHoCH), signaling the transition from a bearish phase to a bullish one.
As the price progresses, it performs liquidity grabs, which serve to gather the necessary fuel for further movement. These liquidity grabs often occur before significant price surges, as large market participants exploit these areas to accumulate positions before pushing the price higher.
The chart also highlights a market imbalance area, showing strong momentum as the price moves swiftly through this zone.
In this examples, we see how the combination of multiple “smart money” tools helps identify a potential trade opportunities. This is just one of the many scenarios that traders can spot using this toolkit. Other combinations—such as order blocks, liquidity grabs, fair value gaps, and Swing Failure Patterns (SFPs)—can also be layered on top of these concepts to further refine your trading strategy.
🔵 SETTINGS
Window: limit calculation period
Swing: limit drawing function
Mapping structure: show structural points
Algorithmic Logic: (Extreme-Adjusted) Use max high/low or pivot point calculation
Algorithmic loopback: pivot point look back
Show Last: Amount of Order block to display
Hide Overlap: hide overlapping order blocks
Construction: Size of the order blocks
Fair value gaps: Choose between normal FVG or Breaker FVG
Mitigation: (close - wick - avg) point to mitigate the order block/imbalance
SFP lookback: find a higher / lower point to improve accuracy
Threshold: remove less relevant SFP
Equal H&L: (short-mid-long term) display longer term
Liquidity Prints: Shows wicks of candles where liquidity was grabbed
Sweep Area: Identify Sweep Liquidation areas
By combining these indicators in one toolkit, traders are equipped with a comprehensive suite of tools that address every angle of the Smart Money Concept. Instead of relying on disparate tools spread across various platforms, having them integrated into a single, cohesive system allows traders to easily see confluence and make more informed trading decisions.

Position Size Calculator (EzAlgo)Upon adding the indicator to the chart, you will be prompted to place entry price lines, stop loss price line, and multiple take profit price lines by clicking at the desired price level on the chart.
Section Summaries
Table Settings: Allows users to select position and font size from drop-down menus. Displays current settings and potential profit/loss values.
Price Points: Users can set their Entry and select whether they want to include a DCA entry, Stop Loss price, Liquidation Buffer %, Take Profit levels and the amount of position to close at each level.
Risk Management: Users fill out their Account Size, set their Risk % (or fixed $ amount) for each Entry, set Manual Leverage, or allow the indicator to automatically choose the leverage based on the Stop Loss price distance from Entry and the Risk % per Entry.
User-Input Descriptions
DCA Price: The price at which users initiate their second, equally sized and leveraged position when using a Dollar-Cost Averaging (DCA) strategy. Upon reaching the DCA Price, the Entry Price adjusts to the Avg Price, calculated as the midpoint between initial and DCA entries.
Liquidation Buffer: A pre-set percentage that determines how close to the Stop Loss a position can get before it's liquidated. This assists the Auto Leverage feature in optimizing the leverage amount according to risk tolerance.
Risk per Entry: The proportion of the account, in % or a fixed dollar amount, that users are willing to risk for each trading position. If DCA is checked, this will assume users are entering with half of the total position size per entry.
Automatic Leverage: Auto Leverage automatically determines the optimal leverage level for a trade based on the user's Stop Loss price distance from the Entry point and the user-defined risk percentage per Entry. It also considers a user-defined Liquidation Buffer, which is a preset percentage determining how close to the Stop Loss a position can get before it's liquidated. This tool allows traders to optimize their leverage amount according to their risk tolerance.
Max Leverage: The highest leverage level users are willing to use, even if the exchange permits higher. This limit applies when the Auto Leverage feature is enabled.

Margin Pressure ThresholdsIf you thought margin trading liquidation levels only mattered to those trading with leverage, think again. Margin traders wield significantly more capital than your average retail investor, and their collective behavior can move markets quite predictably. The basic premise (theory popularized by Forrest @Cryptostackers YouTube) is that margin traders will have their liquidation points protected by strong support (for longs) or resistance (for shorts). Therefore, by simply identifying strong support/resistance levels, we can predict the thresholds at which margin buying and selling pressure will subside.
This indicator is interactive, so it just takes a click. Select a strong support level to see where margin buying pressure is likely to drop off, i.e. where to expect resistance and a potential local top. Or, select a strong resistance level to see expected support and anticipate the local bottom. Even better, look at long and short levels together to identify high probability support/resistance zones where levels align.
And for margin traders, this indicator makes life easy. Just click to select the support/resistance you want protecting your liquidation level, and quickly see the amount of leverage is safe to trade with.

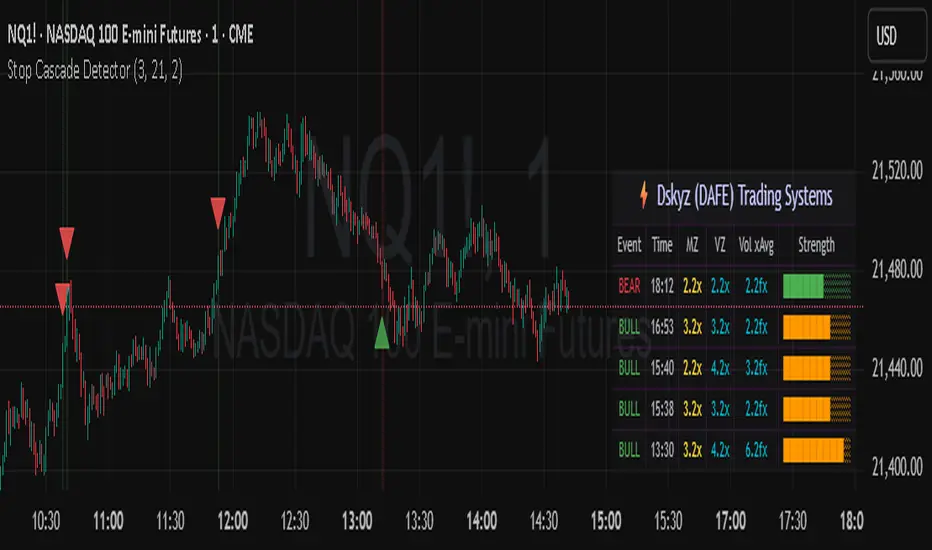
Stop Cascade Detector Stop Cascade Detector (DAFE)
Unlock the Hidden Triggers of Market Momentum!
The Stop Cascade Detector (Bull & Bear, Info Bubble) is a next-generation tool designed for traders who want to see what the crowd can’t: the precise moments when clusters of stop orders are being triggered, unleashing explosive moves in either direction. The reason for this is traders taking there position too early. We on the other hand will take our positions once the less informed traders have been liquidated.
What Makes This Indicator Unique?
Not Just Another Volatility Tool:
This script doesn’t just measure volatility or volume. It detects the chain reactions that occur when price and volume spikes combine to trigger stop-loss clusters—events that often precede the most powerful surges and reversals in any market.
Directional Intelligence:
Unlike generic “spike” detectors, this tool distinguishes between bullish stop cascades (green, above the bar) and bearish stop cascades (red, below the bar), giving you instant clarity on which side of the market is being liquidated.
Visual Precision:
Each event is marked with a color-coded info bubble and a triangle, clearly separated from the price bars for maximum readability. No more guessing where the action is—see it, trade it, and stay ahead.
Universal Application:
Works on any asset, any timeframe, and in any market—futures, stocks, crypto, forex. If there are stops, this indicator will find the cascade.
What makes it work?
Momentum + Volume Spike:
The detector identifies bars where both price momentum and volume are simultaneously extreme (using Z-scores). This combination is a classic signature of stop runs and forced liquidations.
Bull & Bear Detection:
Bull Stop Cascade : Price plunges downward with a volume spike—likely longs getting stopped out.
Bear Stop Cascade: Price surges upward with a volume spike—likely shorts getting stopped out.
Info Bubbles:
Each event is labeled with the exact Z-scores for momentum and volume, so you can gauge the intensity of the cascade at a glance.
What will it do for you?
Front-Run the Crowd:
Most traders react after the move. This tool helps you spot the cause of the move—giving you a tactical edge to fade exhaustion, ride momentum, or avoid getting trapped.
Perfect for Scalpers, Day Traders, and Swing Traders:
Whether you’re looking for high-probability reversals or want to ride the wave, knowing when stops are being triggered is a game-changer.
No More Blind Spots:
Stop cascades are the hidden fuel behind many of the market’s biggest moves. Now you can see them in real time.
How to Use
Red Bubble Above Bar: Bear stop cascade detected—watch for possible trend acceleration or reversal.
Green Bubble Below Bar: Bull stop cascade detected—watch for possible trend acceleration or reversal.
Combine with Your Strategy : Use as a confirmation tool, a reversal signal, or a filter for high-volatility environments. Level up your trading. See the market’s hidden triggers.
Stop Cascade Detector: Because the real edge is knowing what sets the market on fire.
For educational purposes only. Not financial advice. Always use proper risk management.
Use with discipline. Trade your edge.
— Dskyz, for DAFE Trading Systems
Liquidity Zones [BigBeluga]This indicator is designed to detect liquidity zones on the chart by identifying significant pivot highs and lows filtered by volume strength. It plots these zones as boxes, highlighting areas where liquidity is likely to accumulate. The indicator also draws lines extending from these boxes, marking the levels where price may "grab" this liquidity. The size of these boxes can be dynamic, adjusting based on the volume size, offering a visual representation of market areas where traders might expect significant price reactions.
🔵 IDEA
The idea behind the Liquidity Zones indicator is to help traders identify key market levels where liquidity accumulates. Liquidity zones are areas where there are enough buy or sell orders that can potentially lead to significant price movements. By focusing on pivot points filtered by volume strength, the indicator aims to provide a clearer picture of where large players may have positioned their orders. This insight allows traders to anticipate potential market reactions, such as reversals or breakouts, when the price reaches these zones. The option for dynamic box height further refines the visualization, showing the extent of liquidity based on the volume's intensity.
🔵 KEY FEATURES & USAGE
◉ Volume-Filtered Pivot Highs and Lows:
The indicator scans for pivot highs and lows on the chart, filtering these points based on the volume strength setting (Low, Mid, High). This ensures that only the most significant liquidity zones, backed by notable trading volume, are highlighted. Traders can adjust the filter to focus on different levels of market activity, from small fluctuations to major volume spikes.
Low:
Mid:
High:
◉ Dynamic and Static Liquidity Zones:
Liquidity zones are plotted as boxes around pivot points, with an optional dynamic mode that adjusts the box height based on the normalized volume. This dynamic adjustment reflects the liquidity carried by the volume, making it easier to gauge the significance of each zone. In static mode, the boxes have a fixed height, providing a consistent visual reference for the zones.
◉ Color Intensity Based on Volume:
The indicator adjusts the color intensity of the liquidity zones based on the volume strength. Higher volume zones will be displayed with more intense colors, giving a visual cue to the strength of the liquidity present in that area. This makes it easier to differentiate between zones of varying importance at a glance, allowing traders to quickly identify where the market has the highest concentration of liquidity.
◉ Liquidity Grab Detection and Red Circles:
When the price interacts with a liquidity zone, the indicator detects whether liquidity has been "grabbed" at these levels. If the price moves into a zone and crosses a level, the box label changes to "Liquidity Grabbed," and the line marking the level becomes dashed.
Reversal Points:
The beginning of a trend:
Additionally marks these "liquidity grabs" with red circles, indicating both recent and past liquidity grabs. This feature helps traders identify areas where liquidity has been absorbed by the market, which may signal potential reversals or shifts in market direction.
◉ Dashboard Display:
A dashboard in the upper right corner of the chart provides an overview of the indicator's settings and status. It shows the number of plotted zones, as set in the input settings, and whether the dynamic mode is active. This quick reference helps traders stay informed about the indicator's configuration without needing to open the settings panel.
🔵 CUSTOMIZATION
Length & Zones Amount: Set the length for pivot detection and the maximum number of zones to be displayed on the chart. This allows you to control how many liquidity zones you want to monitor at any given time.
Volume Strength Filter: Adjust the filter to Low, Mid, or High to control the strength of volume required for a pivot to be considered a significant liquidity zone. Higher settings focus on zones with greater volume, indicating stronger liquidity.
Dynamic Distance Mode: Enable or disable the dynamic mode, which adjusts the box height based on the volume size. When dynamic mode is off, the boxes have a fixed height based on the ATR, offering a consistent visualization regardless of the volume size.
The Liquidity Zones indicator is a versatile tool for identifying areas of significant market activity, offering a clear view of where liquidity is likely to reside. By filtering these zones through volume strength and providing dynamic or static visualization options, it equips traders with insights into potential market reaction points, enhancing their ability to anticipate and respond to market movements. The varying color intensity based on volume further aids in quickly recognizing the most critical liquidity zones on the chart.

COMET_Scanner_Library_FINALLibrary "COMET_Scanner_Library"
- A Trader's Edge (ATE)_Library was created to assist in constructing COM Scanners
TickerIDs(_string)
TickerIDs: You must form this single tickerID input string exactly as described in the scripts info panel (little gray 'i' that
is circled at the end of the settings in the settings/input panel that you can hover your cursor over this 'i' to read the
details of that particular input). IF the string is formed correctly then it will break up this single string parameter into
a total of 40 separate strings which will be all of the tickerIDs that the script is using in your COM Scanner.
Parameters:
_string (simple string) : (string)
A maximum of 40 Tickers (ALL joined as 1 string for the input parameter) that is formulated EXACTLY as described
within the tooltips of the TickerID inputs in my COM Scanner scripts:
assets = input.text_area(tIDs, title="TickerIDs (MUST READ TOOLTIP)", group=g2, tooltip="Accepts 40 TICKERID's
for each copy of the script on the chart. \n\n*** MUST FORMAT THIS WAY ***\n\n Each FULL tickerID
(ie 'Exchange:ticker') must be separated by A SINGLE BLANK SPACE for correct formatting. The blank space tells
the script where to break off the ticker to assign it to a variable to be used later in the script. So this input
will be a single string constructed from up to 40 tickerID's with a space between each tickerID
(ie. 'BINANCE:BTCUSDT BINANCE:SXPUSDT BINANCE:XRPUSDT').", display=display.none)
Returns: Returns 40 output variables in the tuple (ie. between the ' ') with the separated TickerIDs,
Locations(_firstLocation)
Locations: This function is used when there's a desire to print an assets ALERT LABELS. A set Location on the scale is assigned to each asset.
This is created so that if a lot of alerts are triggered, they will stay relatively visible and not overlap each other.
If you set your '_firstLocation' parameter as 1, since there are a max of 40 assets that can be scanned, the 1st asset's location
is assigned the value in the '_firstLocation' parameter, the 2nd asset's location is the (1st asset's location+1)...and so on.
Parameters:
_firstLocation (simple int) : (simple int)
Optional (starts at 1 if no parameter added).
Location that you want the first asset to print its label if is triggered to do so.
ie. loc2=loc1+1, loc3=loc2+1, etc.
Returns: Returns 40 variables for the locations for alert labels
LabelSize(_barCnt, _lblSzRfrnce)
INVALID TICKERIDs: This is to add a table in the middle right of your chart that prints all the TickerID's that were either not formulated
correctly in the '_source' input or that is not a valid symbol and should be changed.
LABEL SIZES: This function sizes your Alert Trigger Labels according to the amount of Printed Bars the chart has printed within
a set time period, while also keeping in mind the smallest relative reference size you input in the 'lblSzRfrnceInput'
parameter of this function. A HIGHER % of Printed Bars(aka...more trades occurring for that asset on the exchange),
the LARGER the Name Label will print, potentially showing you the better opportunities on the exchange to avoid
exchange manipulation liquidations.
*** SHOULD NOT be used as size of labels that are your asset Name Labels next to each asset's Line Plot...
if your COM Scanner includes these as you want these to be the same size for every asset so the larger ones dont cover the
smaller ones if the plots are all close to each other ***
Parameters:
_barCnt (float) : (float)
Get the 1st variable('barCnt') from the Security function's tuple and input it as this functions 1st input
parameter which will directly affect the size of the 2nd output variable ('alertTrigLabel') that is also outputted by this function.
_lblSzRfrnce (string) : (string)
Optional (if parameter not included, it defaults to size.small). This will be the size of the variable outputted
by this function named 'assetNameLabel' BUT also affects the size of the output variable 'alertTrigLabel' as it uses this parameter's size
as the smallest size for 'alertTrigLabel' then uses the '_barCnt' parameter to determine the next sizes up depending on the "_barCnt" value.
Returns: ( )
Returns 2 variables:
1st output variable ('AssetNameLabel') is assigned to the size of the 'lblSzRfrnceInput' parameter.
2nd output variable('alertTrigLabel') can be of variying sizes depending on the 'barCnt' parameter...BUT the smallest
size possible for the 2nd output variable ('alertTrigLabel') will be the size set in the 'lblSzRfrnceInput' parameter.
InvalidTickerIDs(_close, _securityTickerid, _invalidArray, _tablePosition, _stackVertical)
Parameters:
_close (float)
_securityTickerid (string)
_invalidArray (array)
_tablePosition (simple string)
_stackVertical (simple bool)
PrintedBarCount(_time, _barCntLength, _barCntPercentMin)
The Printed BarCount Filter looks back a User Defined amount of minutes and calculates the % of bars that have printed
out of the TOTAL amount of bars that COULD HAVE been printed within the same amount of time.
Parameters:
_time (int) : (int)
The time associated with the chart of the particular asset that is being screened at that point.
_barCntLength (int) : (int)
The amount of time (IN MINUTES) that you want the logic to look back at to calculate the % of bars that have actually
printed in the span of time you input into this parameter.
_barCntPercentMin (int) : (int)
The minimum % of Printed Bars of the asset being screened has to be GREATER than the value set in this parameter
for the output variable 'bc_gtg' to be true.
Returns: ( )
Returns 2 outputs:
1st is the % of Printed Bars that have printed within the within the span of time you input in the '_barCntLength' parameter.
2nd is true/false according to if the Printed BarCount % is above the threshold that you input into the '_barCntPercentMin' parameter.

COM_Scanner_LibraryLibrary "COM_Scanner_Library"
- A Trader's Edge (ATE)_Library was created to assist in constructing COM Scanners
TickerIDs(_string)
TickerIDs: You must form this single tickerID input string exactly as described in the scripts info panel (little gray 'i' that
is circled at the end of the settings in the settings/input panel that you can hover your cursor over this 'i' to read the
details of that particular input). IF the string is formed correctly then it will break up this single string parameter into
a total of 40 separate strings which will be all of the tickerIDs that the script is using in your COM Scanner.
Parameters:
_string (simple string) : (string)
A maximum of 40 Tickers (ALL joined as 1 string for the input parameter) that is formulated EXACTLY as described
within the tooltips of the TickerID inputs in my COM Scanner scripts:
assets = input.text_area(tIDs, title="TickerIDs (MUST READ TOOLTIP)", group=g2, tooltip="Accepts 40 TICKERID's
for each copy of the script on the chart. \n\n*** MUST FORMAT THIS WAY ***\n\n Each FULL tickerID
(ie 'Exchange:ticker') must be separated by A SINGLE BLANK SPACE for correct formatting. The blank space tells
the script where to break off the ticker to assign it to a variable to be used later in the script. So this input
will be a single string constructed from up to 40 tickerID's with a space between each tickerID
(ie. 'BINANCE:BTCUSDT BINANCE:SXPUSDT BINANCE:XRPUSDT').", display=display.none)
Returns: Returns 40 output variables in the tuple (ie. between the ' ') with the separated TickerIDs,
Locations(_firstLocation)
Locations: This function is used when there's a desire to print an assets ALERT LABELS. A set Location on the scale is assigned to each asset.
This is created so that if a lot of alerts are triggered, they will stay relatively visible and not overlap each other.
If you set your '_firstLocation' parameter as 1, since there are a max of 40 assets that can be scanned, the 1st asset's location
is assigned the value in the '_firstLocation' parameter, the 2nd asset's location is the (1st asset's location+1)...and so on.
Parameters:
_firstLocation (simple int) : (simple int)
Optional (starts at 1 if no parameter added).
Location that you want the first asset to print its label if is triggered to do so.
ie. loc2=loc1+1, loc3=loc2+1, etc.
Returns: Returns 40 variables for the locations for alert labels
LabelSize(_barCnt, _lblSzRfrnce)
INVALID TICKERIDs: This is to add a table in the middle right of your chart that prints all the TickerID's that were either not formulated
correctly in the '_source' input or that is not a valid symbol and should be changed.
LABEL SIZES: This function sizes your Alert Trigger Labels according to the amount of Printed Bars the chart has printed within
a set time period, while also keeping in mind the smallest relative reference size you input in the 'lblSzRfrnceInput'
parameter of this function. A HIGHER % of Printed Bars(aka...more trades occurring for that asset on the exchange),
the LARGER the Name Label will print, potentially showing you the better opportunities on the exchange to avoid
exchange manipulation liquidations.
*** SHOULD NOT be used as size of labels that are your asset Name Labels next to each asset's Line Plot...
if your COM Scanner includes these as you want these to be the same size for every asset so the larger ones dont cover the
smaller ones if the plots are all close to each other ***
Parameters:
_barCnt (float) : (float)
Get the 1st variable('barCnt') from the Security function's tuple and input it as this functions 1st input
parameter which will directly affect the size of the 2nd output variable ('alertTrigLabel') that is also outputted by this function.
_lblSzRfrnce (string) : (string)
Optional (if parameter not included, it defaults to size.small). This will be the size of the variable outputted
by this function named 'assetNameLabel' BUT also affects the size of the output variable 'alertTrigLabel' as it uses this parameter's size
as the smallest size for 'alertTrigLabel' then uses the '_barCnt' parameter to determine the next sizes up depending on the "_barCnt" value.
Returns: ( )
Returns 2 variables:
1st output variable ('AssetNameLabel') is assigned to the size of the 'lblSzRfrnceInput' parameter.
2nd output variable('alertTrigLabel') can be of variying sizes depending on the 'barCnt' parameter...BUT the smallest
size possible for the 2nd output variable ('alertTrigLabel') will be the size set in the 'lblSzRfrnceInput' parameter.
InvalidTickerIDs(_close, _securityTickerid, _invalidArray, _tablePosition, _stackVertical)
Parameters:
_close (float)
_securityTickerid (string)
_invalidArray (array)
_tablePosition (simple string)
_stackVertical (simple bool)
PrintedBarCount(_time, _barCntLength, _barCntPercentMin)
The Printed BarCount Filter looks back a User Defined amount of minutes and calculates the % of bars that have printed
out of the TOTAL amount of bars that COULD HAVE been printed within the same amount of time.
Parameters:
_time (int) : (int)
The time associated with the chart of the particular asset that is being screened at that point.
_barCntLength (int) : (int)
The amount of time (IN MINUTES) that you want the logic to look back at to calculate the % of bars that have actually
printed in the span of time you input into this parameter.
_barCntPercentMin (int) : (int)
The minimum % of Printed Bars of the asset being screened has to be GREATER than the value set in this parameter
for the output variable 'bc_gtg' to be true.
Returns: ( )
Returns 2 outputs:
1st is the % of Printed Bars that have printed within the within the span of time you input in the '_barCntLength' parameter.
2nd is true/false according to if the Printed BarCount % is above the threshold that you input into the '_barCntPercentMin' parameter.
CCOMET_Scanner_LibraryLibrary "CCOMET_Scanner_Library"
- A Trader's Edge (ATE)_Library was created to assist in constructing CCOMET Scanners
Loc_tIDs_Col(_string, _firstLocation)
TickerIDs: You must form this single tickerID input string exactly as described in the scripts info panel (little gray 'i' that
is circled at the end of the settings in the settings/input panel that you can hover your cursor over this 'i' to read the
details of that particular input). IF the string is formed correctly then it will break up this single string parameter into
a total of 40 separate strings which will be all of the tickerIDs that the script is using in your CCOMET Scanner.
Locations: This function is used when there's a desire to print an assets ALERT LABELS. A set Location on the scale is assigned to each asset.
This is created so that if a lot of alerts are triggered, they will stay relatively visible and not overlap each other.
If you set your '_firstLocation' parameter as 1, since there are a max of 40 assets that can be scanned, the 1st asset's location
is assigned the value in the '_firstLocation' parameter, the 2nd asset's location is the (1st asset's location+1)...and so on.
Parameters:
_string (simple string) : (string)
A maximum of 40 Tickers (ALL joined as 1 string for the input parameter) that is formulated EXACTLY as described
within the tooltips of the TickerID inputs in my CCOMET Scanner scripts:
assets = input.text_area(tIDset1, title="TickerID (MUST READ TOOLTIP)", tooltip="Accepts 40 TICKERID's for each
copy of the script on the chart. TEXT FORMATTING RULES FOR TICKERID'S:
(1) To exclude the EXCHANGE NAME in the Labels, de-select the next input option.
(2) MUST have a space (' ') AFTER each TickerID.
(3) Capitalization in the Labels will match cap of these TickerID's.
(4) If your asset has a BaseCurrency & QuoteCurrency (ie. ADAUSDT ) BUT you ONLY want Labels
to show BaseCurrency(ie.'ADA'), include a FORWARD SLASH ('/') between the Base & Quote (ie.'ADA/USDT')", display=display.none)
_firstLocation (simple int) : (simple int)
Optional (starts at 1 if no parameter added).
Location that you want the first asset to print its label if is triggered to do so.
ie. loc2=loc1+1, loc3=loc2+1, etc.
Returns: Returns 40 output variables in the tuple (ie. between the ' ') with the TickerIDs, 40 variables for the locations for alert labels, and 40 Colors for labels/plots
TickeridForLabelsAndSecurity(_ticker, _includeExchange)
This function accepts the TickerID Name as its parameter and produces a single string that will be used in all of your labels.
Parameters:
_ticker (simple string) : (string)
For this parameter, input the varible named '_coin' from your 'f_main()' function for this parameter. It is the raw
Ticker ID name that will be processed.
_includeExchange (simple bool) : (bool)
Optional (if parameter not included in function it defaults to false ).
Used to determine if the Exchange name will be included in all labels/triggers/alerts.
Returns: ( )
Returns 2 output variables:
1st ('_securityTickerid') is to be used in the 'request.security()' function as this string will contain everything
TV needs to pull the correct assets data.
2nd ('lblTicker') is to be used in all of the labels in your CCOMET Scanner as it will only contain what you want your labels
to show as determined by how the tickerID is formulated in the CCOMET Scanner's input.
InvalID_LblSz(_barCnt, _close, _securityTickerid, _invalidArray, _tablePosition, _stackVertical, _lblSzRfrnce)
INVALID TICKERIDs: This is to add a table in the middle right of your chart that prints all the TickerID's that were either not formulated
correctly in the '_source' input or that is not a valid symbol and should be changed.
LABEL SIZES: This function sizes your Alert Trigger Labels according to the amount of Printed Bars the chart has printed within
a set time period, while also keeping in mind the smallest relative reference size you input in the 'lblSzRfrnceInput'
parameter of this function. A HIGHER % of Printed Bars(aka...more trades occurring for that asset on the exchange),
the LARGER the Name Label will print, potentially showing you the better opportunities on the exchange to avoid
exchange manipulation liquidations.
*** SHOULD NOT be used as size of labels that are your asset Name Labels next to each asset's Line Plot...
if your CCOMET Scanner includes these as you want these to be the same size for every asset so the larger ones dont cover the
smaller ones if the plots are all close to each other ***
Parameters:
_barCnt (float) : (float)
Get the 1st variable('barCnt') from the Security function's tuple and input it as this functions 1st input
parameter which will directly affect the size of the 2nd output variable ('alertTrigLabel') that is also outputted by this function.
_close (float) : (float)
Put your 'close' variable named '_close' from the security function here.
_securityTickerid (string) : (string)
Throughout the entire charts updates, if a '_close' value is never registered then the logic counts the asset as INVALID.
This will be the 1st TickerID variable (named _securityTickerid) outputted from the tuple of the TickeridForLabels()
function above this one.
_invalidArray (array) : (array string)
Input the array from the original script that houses all of the invalidArray strings.
_tablePosition (simple string) : (string)
Optional (if parameter not included, it defaults to position.middle_right). Location on the chart you want the table printed.
Possible strings include: position.top_center, position.top_left, position.top_right, position.middle_center,
position.middle_left, position.middle_right, position.bottom_center, position.bottom_left, position.bottom_right.
_stackVertical (simple bool) : (bool)
Optional (if parameter not included, it defaults to true). All of the assets that are counted as INVALID will be
created in a list. If you want this list to be prited as a column then input 'true' here, otherwise they will all be in a row.
_lblSzRfrnce (string) : (string)
Optional (if parameter not included, it defaults to size.small). This will be the size of the variable outputted
by this function named 'assetNameLabel' BUT also affects the size of the output variable 'alertTrigLabel' as it uses this parameter's size
as the smallest size for 'alertTrigLabel' then uses the '_barCnt' parameter to determine the next sizes up depending on the "_barCnt" value.
Returns: ( )
Returns 2 variables:
1st output variable ('AssetNameLabel') is assigned to the size of the 'lblSzRfrnceInput' parameter.
2nd output variable('alertTrigLabel') can be of variying sizes depending on the 'barCnt' parameter...BUT the smallest
size possible for the 2nd output variable ('alertTrigLabel') will be the size set in the 'lblSzRfrnceInput' parameter.
PrintedBarCount(_time, _barCntLength, _barCntPercentMin)
The Printed BarCount Filter looks back a User Defined amount of minutes and calculates the % of bars that have printed
out of the TOTAL amount of bars that COULD HAVE been printed within the same amount of time.
Parameters:
_time (int) : (int)
The time associated with the chart of the particular asset that is being screened at that point.
_barCntLength (int) : (int)
The amount of time (IN MINUTES) that you want the logic to look back at to calculate the % of bars that have actually
printed in the span of time you input into this parameter.
_barCntPercentMin (int) : (int)
The minimum % of Printed Bars of the asset being screened has to be GREATER than the value set in this parameter
for the output variable 'bc_gtg' to be true.
Returns: ( )
Returns 2 outputs:
1st is the % of Printed Bars that have printed within the within the span of time you input in the '_barCntLength' parameter.
2nd is true/false according to if the Printed BarCount % is above the threshold that you input into the '_barCntPercentMin' parameter.

A_Traders_Edge__LibraryLibrary "A_Traders_Edge__Library"
- A Trader's Edge (ATE)_Library was created to assist in constructing Market Overview Scanners (MOS)
LabelLocation(_firstLocation)
This function is used when there's a desire to print an assets ALERT LABELS at a set location on the scale that will
NOT change throughout the progression of the script. This is created so that if a lot of alerts are triggered, they
will stay relatively visible and not overlap each other. Ex. If you set your '_firstLocation' parameter as 1, since
there are a max of 40 assets that can be scanned, the 1st asset's location is assigned the value in the '_firstLocation' parameter,
the 2nd asset's location is the (1st asset's location+1)...and so on. If your first location is set to 81 then
the 1st asset is 81 and 2nd is 82 and so on until the 40th location = 120(in this particular example).
Parameters:
_firstLocation (simple int) : (simple int)
Optional(starts at 1 if no parameter added).
Location that you want the first asset to print its label if is triggered to do so.
ie. loc2=loc1+1, loc3=loc2+1, etc.
Returns: Returns 40 output variables each being a different location to print the labels so that an asset is asssigned to
a particular location on the scale. Regardless of if you have the maximum amount of assets being screened (40 max), this
function will output 40 locations… So there needs to be 40 variables assigned in the tuple in this function. What I
mean by that is you need to have 40 output location variables within your tuple (ie. between the ' ') regarless of
if your scanning 40 assets or not. If you only have 20 assets in your scripts input settings, then only the first 20
variables within the ' ' Will be assigned to a value location and the other 20 will be assigned 'NA', but their
variables still need to be present in the tuple.
SeparateTickerids(_string)
You must form this single tickerID input string exactly as described in the scripts info panel (little gray 'i' that
is circled at the end of the settings in the settings/input panel that you can hover your cursor over this 'i' to read the
details of that particular input). IF the string is formed correctly then it will break up this single string parameter into
a total of 40 separate strings which will be all of the tickerIDs that the script is using in your MO scanner.
Parameters:
_string (simple string) : (string)
A maximum of 40 Tickers (ALL joined as 1 string for the input parameter) that is formulated EXACTLY as described
within the tooltips of the TickerID inputs in my MOS Scanner scripts:
assets = input.text_area(tIDset1, title="TickerID (MUST READ TOOLTIP)", tooltip="Accepts 40 TICKERID's for each
copy of the script on the chart. TEXT FORMATTING RULES FOR TICKERID'S:
(1) To exclude the EXCHANGE NAME in the Labels, de-select the next input option.
(2) MUST have a space (' ') AFTER each TickerID.
(3) Capitalization in the Labels will match cap of these TickerID's.
(4) If your asset has a BaseCurrency & QuoteCurrency (ie. ADAUSDT ) BUT you ONLY want Labels
to show BaseCurrency(ie.'ADA'), include a FORWARD SLASH ('/') between the Base & Quote (ie.'ADA/USDT')", display=display.none)
Returns: Returns 40 output variables of the different strings of TickerID's (ie. you need to output 40 variables within the
tuple ' ' regardless of if you were scanning using all possible (40) assets or not.
If your scanning for less than 40 assets, then once the variables are assigned to all of the tickerIDs, the rest
of the 40 variables in the tuple will be assigned "NA".
TickeridForLabelsAndSecurity(_includeExchange, _ticker)
This function accepts the TickerID Name as its parameter and produces a single string that will be used in all of your labels.
Parameters:
_includeExchange (simple bool) : (bool)
Optional(if parameter not included in function it defaults to false ).
Used to determine if the Exchange name will be included in all labels/triggers/alerts.
_ticker (simple string) : (string)
For this parameter, input the varible named '_coin' from your 'f_main()' function for this parameter. It is the raw
Ticker ID name that will be processed.
Returns: ( )
Returns 2 output variables:
1st ('_securityTickerid') is to be used in the 'request.security()' function as this string will contain everything
TV needs to pull the correct assets data.
2nd ('lblTicker') is to be used in all of the labels in your MOS as it will only contain what you want your labels
to show as determined by how the tickerID is formulated in the MOS's input.
InvalidTID(_tablePosition, _stackVertical, _close, _securityTickerid, _invalidArray)
This is to add a table in the middle right of your chart that prints all the TickerID's that were either not formulated
correctly in the '_source' input or that is not a valid symbol and should be changed.
Parameters:
_tablePosition (simple string) : (string)
Optional(if parameter not included, it defaults to position.middle_right). Location on the chart you want the table printed.
Possible strings include: position.top_center, position.top_left, position.top_right, position.middle_center,
position.middle_left, position.middle_right, position.bottom_center, position.bottom_left, position.bottom_right.
_stackVertical (simple bool) : (bool)
Optional(if parameter not included, it defaults to true). All of the assets that are counted as INVALID will be
created in a list. If you want this list to be prited as a column then input 'true' here.
_close (float) : (float)
If you want them printed as a single row then input 'false' here.
This should be the closing value of each of the assets being tested to determine in the TickerID is valid or not.
_securityTickerid (string) : (string)
Throughout the entire charts updates, if a '_close' value is never regestered then the logic counts the asset as INVALID.
This will be the 1st TickerID varible (named _securityTickerid) outputted from the tuple of the TickeridForLabels()
function above this one.
_invalidArray (string ) : (array string)
Input the array from the original script that houses all of the invalidArray strings.
Returns: (na)
Returns a table with the screened assets Invalid TickerID's. Table draws automatically if any are Invalid, thus,
no output variable to deal with.
LabelSizes(_barCnt, _lblSzRfrnce)
This function sizes your Alert Trigger Labels according to the amount of Printed Bars the chart has printed within
a set time period, while also keeping in mind the smallest relative reference size you input in the 'lblSzRfrnceInput'
parameter of this function. A HIGHER % of Printed Bars(aka...more trades occurring for that asset on the exchange),
the LARGER the Name Label will print, potentially showing you the better opportunities on the exchange to avoid
exchange manipulation liquidations.
*** SHOULD NOT be used as size of labels that are your asset Name Labels next to each asset's Line Plot...
if your MOS includes these as you want these to be the same size for every asset so the larger ones dont cover the
smaller ones if the plots are all close to each other ***
Parameters:
_barCnt (float) : (float)
Get the 1st variable('barCnt') from the 'PrintedBarCount' function's tuple and input it as this functions 1st input
parameter which will directly affect the size of the 2nd output variable ('alertTrigLabel') outputted by this function.
_lblSzRfrnce (string) : (string)
Optional(if parameter not included, it defaults to size.small). This will be the size of the 1st variable outputted
by this function ('assetNameLabel') BUT also affects the 2nd variable outputted by this function.
Returns: ( )
Returns 2 variables:
1st output variable ('AssetNameLabel') is assigned to the size of the 'lblSzRfrnceInput' parameter.
2nd output variable('alertTrigLabel') can be of variying sizes depending on the 'barCnt' parameter...BUT the smallest
size possible for the 2nd output variable ('alertTrigLabel') will be the size set in the 'lblSzRfrnceInput' parameter.
AssetColor()
This function is used to assign 40 different colors to 40 variables to be used for the different labels/plots.
Returns: Returns 40 output variables each with a different color assigned to them to be used in your plots & labels.
Regardless of if you have the maximum amount of assets your scanning(40 max) or less,
this function will assign 40 colors to 40 variables that you have between the ' '.
PrintedBarCount(_time, _barCntLength, _barCntPercentMin)
The Printed BarCount Filter looks back a User Defined amount of minutes and calculates the % of bars that have printed
out of the TOTAL amount of bars that COULD HAVE been printed within the same amount of time.
Parameters:
_time (int) : (int)
The time associated with the chart of the particular asset that is being screened at that point.
_barCntLength (int) : (int)
The amount of time (IN MINUTES) that you want the logic to look back at to calculate the % of bars that have actually
printed in the span of time you input into this parameter.
_barCntPercentMin (int) : (int)
The minimum % of Printed Bars of the asset being screened has to be GREATER than the value set in this parameter
for the output variable 'bc_gtg' to be true.
Returns: ( )
Returns 2 outputs:
1st is the % of Printed Bars that have printed within the within the span of time you input in the '_barCntLength' parameter.
2nd is true/false according to if the Printed BarCount % is above the threshold that you input into the '_barCntPercentMin' parameter.
RCI(_rciLength, _source, _interval)
You will see me using this a lot. DEFINITELY my favorite oscillator to utilize for SO many different things from
timing entries/exits to determining trends.Calculation of this indicator based on Spearmans Correlation.
Parameters:
_rciLength (int) : (int)
Amount of bars back to use in RCI calculations.
_source (float) : (float)
Source to use in RCI calculations (can use ANY source series. Ie, open,close,high,low,etc).
_interval (int) : (int)
Optional(if parameter not included, it defaults to 3). RCI calculation groups bars by this amount and then will.
rank these groups of bars.
Returns: (float)
Returns a single RCI value that will oscillates between -100 and +100.
RCIAVG(firstLength, _amtBtLengths, _rciSMAlen, _source, _interval)
20 RCI's are averaged together to get this RCI Avg (Rank Correlation Index Average). Each RCI (of the 20 total RCI)
has a progressively LARGER Lookback Length. Though the RCI Lengths are not individually adjustable,
there are 2 factors that ARE:
(1) the Lookback Length of the 1st RCI and
(2) the amount of values between one RCI's Lookback Length and the next.
*** If you set 'firstLength' to it's default of 200 and '_amtBtLengths' to it's default of 120 (aka AMOUNT BETWEEN LENGTHS=120)...
then RCI_2 Length=320, RCI_3 Length=440, RCI_4 Length=560, and so on.
Parameters:
firstLength (int) : (int)
Optional(if parameter is not included when the function is called, then it defaults to 200).
This parameter is the Lookback Length for the 1st RCI used in the RCI Avg.
_amtBtLengths (int) : (int)
Optional(if parameter not included when the function is called, then it defaults to 120).
This parameter is the value amount between each of the progressively larger lengths used for the 20 RCI's that
are averaged in the RCI Avg.
***** BEWARE ***** Too large of a value here will cause the calc to look back too far, causing an error(thus the value must be lowered)
_rciSMAlen (int) : (int)
Unlike the Single RCI Function, this function smooths out the end result using an SMA with a length value that is this parameter.
_source (float) : (float)
Source to use in RCI calculations (can use ANY source series. Ie, open,close,high,low,etc).
_interval (int) : (int)
Optional(if parameter not included, it defaults to 3). Within the RCI calculation, bars next to each other are grouped together
and then these groups are Ranked against each other. This parameter is the number of adjacent bars that are grouped together.
Returns: (float)
Returns a single RCI value that is the Avg of many RCI values that will oscillate between -100 and +100.
PercentChange(_startingValue, _endingValue)
This is a quick function to calculate how much % change has occurred between the '_startingValue' and the '_endingValue'
that you input into the function.
Parameters:
_startingValue (float) : (float)
The source value to START the % change calculation from.
_endingValue (float) : (float)
The source value to END the % change caluclation from.
Returns: Returns a single output being the % value between 0-100 (with trailing numbers behind a decimal). If you want only
a certain amount of numbers behind the decimal, this function needs to be put within a formatting function to do so.
Rescale(_source, _oldMin, _oldMax, _newMin, _newMax)
Rescales series with a known '_oldMin' & '_oldMax'. Use this when the scale of the '_source' to
rescale is known (bounded).
Parameters:
_source (float) : (float)
Source to be normalized.
_oldMin (int) : (float)
The known minimum of the '_source'.
_oldMax (int) : (float)
The known maximum of the '_source'.
_newMin (int) : (float)
What you want the NEW minimum of the '_source' to be.
_newMax (int) : (float)
What you want the NEW maximum of the '_source' to be.
Returns: Outputs your previously bounded '_source', but now the value will only move between the '_newMin' and '_newMax'
values you set in the variables.
Normalize_Historical(_source, _minimumLvl, _maximumLvl)
Normalizes '_source' that has a previously unknown min/max(unbounded) determining the max & min of the '_source'
FROM THE ENTIRE CHARTS HISTORY. ]
Parameters:
_source (float) : (float)
Source to be normalized.
_minimumLvl (int) : (float)
The Lower Boundary Level.
_maximumLvl (int) : (float)
The Upper Boundary Level.
Returns: Returns your same '_source', but now the value will MOSTLY stay between the minimum and maximum values you set in the
'_minimumLvl' and '_maximumLvl' variables (ie. if the source you input is an RSI...the output is the same RSI value but
instead of moving between 0-100 it will move between the maxand min you set).
Normailize_Local(_source, _length, _minimumLvl, _maximumLvl)
Normalizes series with previously unknown min/max(unbounded). Much like the Normalize_Historical function above this one,
but rather than using the Highest/Lowest Values within the ENTIRE charts history, this on looks for the Highest/Lowest
values of '_source' within the last ___ bars (set by user as/in the '_length' parameter. ]
Parameters:
_source (float) : (float)
Source to be normalized.
_length (int) : (float)
The amount of bars to look back to determine the highest/lowest '_source' value.
_minimumLvl (int) : (float)
The Lower Boundary Level.
_maximumLvl (int) : (float)
The Upper Boundary Level.
Returns: Returns a single output variable being the previously unbounded '_source' that is now normalized and bound between
the values used for '_minimumLvl'/'_maximumLvl' of the '_source' within the user defined lookback period.
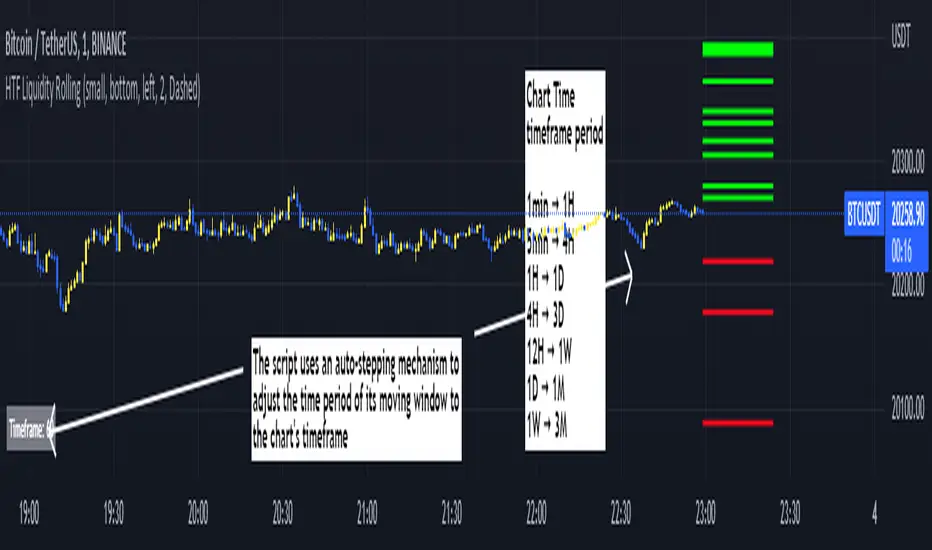
Rolling HTF Liquidity Levels [CHE]█ OVERVIEW
This indicator displays a Rolling HTF Liquidity Levels . Contrary to HTF Liquidity Levels indicators which use a fix time segment, Rolling HTF Liquidity Levels calculates using a moving window defined by a time period (not a simple number of bars), so it shows better results.
This indicator is inspired by
The indicator introduces a new representation of the previous rolling time frame highs & lows (DWM HL) with a focus on untapped levels.
█ CONCEPTS
Untapped Levels
It is popularly known that the liquidity is located behind swing points or beyond higher time frames highs/lows.
Rolling HTF Liquidity Levels uses a moving window, it does not exhibit the static of the HTF Liquidity Levels plots.
█ HOW TO USE IT
Load the indicator on an active chart (see the Help Center if you don't know how).
Time period
By default, the script uses an auto-stepping mechanism to adjust the time period of its moving window to the chart's timeframe. The following table shows chart timeframes and the corresponding time period used by the script. When the chart's timeframe is less than or equal to the timeframe in the first column, the second column's time period is used to calculate the Rolling HTF Liquidity Levels:
Chart Time
timeframe period
1min 🠆 1H
5min 🠆 4H
1H 🠆 1D
4H 🠆 3D
12H 🠆 1W
1D 🠆 1M
1W 🠆 3M
By default, the time period currently used is displayed in the lower-right corner of the chart. The script's inputs allow you to hide the display or change its size and location.
This indicator should make trading easier and improve analysis. Nothing is worse than indicators that give confusingly different signals.
I hope you enjoy my new ideas
best regards
Chervolino
Earnings Support and Resistance Levels [NeoButane]Inspired by @LazyBear's/@timwest's script:
Usage: support and resistance levels based on averaging price around earnings and quarterly opens.
What it is plotting:
1. A horizontal level whenever earnings occur. If actual earnings is higher than estimated, the line turns green, else red.
2. A horizontal level every quarterly open, colored black.
3. An average between the two mentioned above, colored orange.
4. 5% moves away from 3M open and earnings
5. Misc: 5% move away from that 5% move away, then 10% move away from the 2nd 5% move away.
By default, 4 and 5 are off to reduce visual noise.
Idea: Traders panic around certain dates that always happen, and traders always panic in the wrong direction. The market is composed of traders trading in the wrong direction at the same time, all the time. That means price will bounce back and forth as the gambling dens colloquially known as 'forex brokerages' or 'stock exchanges' take your money in the form of fees, time, and liquidations. So I put two lines on the chart and put one right in between, because it always goes back. I hope you can find it useful!
Note: This was a part of the old fundamental data indicators and is not officially for use, so while it should work on most U.S. stocks and a couple of other exchanges, it is not perfect.

PriceActionLibrary "PriceAction"
Hi all!
This library will help you to plot the market structure and liquidity. By now, the only part in the price action section is liquidity, but I plan to add more later on. The market structure will be split into two parts, 'Internal' and 'Swing' with separate pivot lengths. For these two trends it will show you:
• Break of structure (BOS)
• Change of character (CHoCH/CHoCH+) (mandatory)
• Equal high/low (EQH/EQL)
It's inspired by "Smart Money Concepts (SMC) " by LuxAlgo.
This library is now the same code as the code in my library 'MarketStructure', but it has evolved into a more price action oriented library than just a market structure library. This is more accurate and I will continue working on this library to keep it growing.
This code does not provide any examples, but you can look at my indicators 'Market structure' () and 'Order blocks' (), where I use the 'MarketStructure' library (which is the same code).
Market structure
Both of these market structures can be enabled/disabled by setting them to 'na'. The pivots lengths can be configured separately. The pivots found will be the 'base' of and will show you when price breaks it. When that happens a break of structure or a change of character will be created. The latest 5 pivots found within the current trends will be kept to take action on. They are cleared on a change of character, so nothing (break of structures or change of characters) can happen on pivots before a trend change. The internal market structure is shown with dashed lines and swing market structure is shown with solid lines.
Labels for a change of character can have either the text 'CHoCH' or 'CHoCH+'. A Change of Character plus is formed when price fails to form a higher high or a lower low before reversing. Note that a pivot that is created after the change of character might have a higher high or a lower low, thus not making the break a 'CHoCH+'. This is not changed after the pivot is found but is kept as is.
A break of structure is removed if an earlier pivot within the same trend is broken, i.e. another break of structure (with a longer distance) is created. Like in the images below, the first pivot (in the first image) is removed when an earlier pivot's higher price within the same trend is broken (the second image):
[image [https://www.tradingview.com/x/PRP6YtPA/
Equal high/lows have a configurable color setting and can be configured to be extended to the right. Equal high/lows are only possible if it's not been broken by price. A factor (percentage of width) of the Average True Length (of length 14) that the pivot must be within to to be considered an Equal high/low. Equal highs/lows can be of 2 pivots or more.
You are able to show the pivots that are used. "HH" (higher high), "HL" (higher low), "LH" (lower high), "LL" (lower low) and "H"/"L" (for pivots (high/low) when the trend has changed) are the labels used. There are also labels for break of structures ('BOS') and change of characters ('CHoCH' or 'CHoCH+'). The size of these texts is set in the 'FontSize' setting.
When programming I focused on simplicity and ease of read. I did not focus on performance, I will do so if it's a problem (haven't noticed it is one yet).
You can set alerts for when a change of character, break of structure or an equal high/low (new or an addition to a previously found) happens. The alerts that are fired are on 'once_per_bar_close' to avoid repainting. This has the drawback to alert you when the bar closes.
Price action
The indicator will create lines and zones for spotted liquidity. It will draw a line (with dotted style) at the price level that was liquidated, but it will also draw a zone from that level to the bar that broke the pivot high or low price. If that zone is large the liquidation is big and might be significant. This can be disabled in the settings. You can also change the confirmation candles (that does not close above or below the pivot level) needed after a liquidation and how many pivots back to look at.
The lines and boxes drawn will look like this if the color is orange:
Hope this is of help!
Will draw out the market structure for the disired pivot length.
Liqudity(liquidity)
Will draw liquidity.
Parameters:
liquidity (Liquidity) : The 'PriceAction.Liquidity' object.
Pivot(structure)
Sets the pivots in the structure.
Parameters:
structure (Structure)
PivotLabels(structure)
Draws labels for the pivots found.
Parameters:
structure (Structure)
EqualHighOrLow(structure)
Draws the boxes for equal highs/lows. Also creates labels for the pivots included.
Parameters:
structure (Structure)
BreakOfStructure(structure)
Will create lines when a break of strycture occures.
Parameters:
structure (Structure)
Returns: A boolean that represents if a break of structure was found or not.
ChangeOfCharacter(structure)
Will create lines when a change of character occures. This line will have a label with "CHoCH" or "CHoCH+".
Parameters:
structure (Structure)
Returns: A boolean that represents if a change of character was found or not.
VisualizeCurrent(structure)
Will create a box with a background for between the latest high and low pivots. This can be used as the current trading range (if the pivots broke strucure somehow).
Parameters:
structure (Structure)
StructureBreak
Holds drawings for a structure break.
Fields:
Line (series line) : The line object.
Label (series label) : The label object.
Pivot
Holds all the values for a found pivot.
Fields:
Price (series float) : The price of the pivot.
BarIndex (series int) : The bar_index where the pivot occured.
Type (series int) : The type of the pivot (-1 = low, 1 = high).
Time (series int) : The time where the pivot occured.
BreakOfStructureBroken (series bool) : Sets to true if a break of structure has happened.
LiquidityBroken (series bool) : Sets to true if a liquidity of the price level has happened.
ChangeOfCharacterBroken (series bool) : Sets to true if a change of character has happened.
Structure
Holds all the values for the market structure.
Fields:
LeftLength (series int) : Define the left length of the pivots used.
RightLength (series int) : Define the right length of the pivots used.
Type (series Type) : Set the type of the market structure. Two types can be used, 'internal' and 'swing' (0 = internal, 1 = swing).
Trend (series int) : This will be set internally and can be -1 = downtrend, 1 = uptrend.
EqualPivotsFactor (series float) : Set how the limits are for an equal pivot. This is a factor of the Average True Length (ATR) of length 14. If a low pivot is considered to be equal if it doesn't break the low pivot (is at a lower value) and is inside the previous low pivot + this limit.
ExtendEqualPivotsZones (series bool) : Set to true if you want the equal pivots zones to be extended.
ExtendEqualPivotsStyle (series string) : Set the style of equal pivot zones.
ExtendEqualPivotsColor (series color) : Set the color of equal pivot zones.
EqualHighs (array) : Holds the boxes for zones that contains equal highs.
EqualLows (array) : Holds the boxes for zones that contains equal lows.
BreakOfStructures (array) : Holds all the break of structures within the trend (before a change of character).
Pivots (array) : All the pivots in the current trend, added with the latest first, this is cleared when the trend changes.
FontSize (series int) : Holds the size of the font displayed.
AlertChangeOfCharacter (series bool) : Holds true or false if a change of character should be alerted or not.
AlertBreakOfStructure (series bool) : Holds true or false if a break of structure should be alerted or not.
AlerEqualPivots (series bool) : Holds true or false if equal highs/lows should be alerted or not.
Liquidity
Holds all the values for liquidity.
Fields:
LiquidityPivotsHigh (array) : All high pivots for liquidity.
LiquidityPivotsLow (array) : All low pivots for liquidity.
LiquidityConfirmationBars (series int) : The number of bars to confirm that a liquidity is valid.
LiquidityPivotsLookback (series int) : A number of pivots to look back for.
FontSize (series int) : Holds the size of the font displayed.
PriceAction
Holds all the values for the general price action and the market structures.
Fields:
Liquidity (Liquidity)
Swing (Structure) : Placeholder for all objects used for the swing market structure.
Internal (Structure) : Placeholder for all objects used for the internal market structure.

Dynamic Liquidity Depth [BigBeluga]
Dynamic Liquidity Depth
A liquidity mapping engine that reveals hidden zones of market vulnerability. This tool simulates where potential large concentrations of stop-losses may exist — above recent highs (sell-side) and below recent lows (buy-side) — by analyzing real price behavior and directional volume. The result is a dynamic two-sided volume profile that highlights where price is most likely to gravitate during liquidation events, reversals, or engineered stop hunts.
🔵 KEY FEATURES
Two-Sided Liquidity Profiles:
Plots two separate profiles on the chart — one above price for potential sell-side liquidity , and one below price for potential buy-side liquidity . Each profile reflects the volume distribution across binned zones derived from historical highs and lows.
Real Stop Zone Simulation:
Each profile is offset from the current high or low using an ATR-based buffer. This simulates where traders might cluster their stop-losses above swing highs (short stops) or below swing lows (long stops).
Directional Volume Analysis:
Buy-side volume is accumulated only from bullish candles (close > open), while sell-side volume is accumulated only from bearish candles (close < open). This directional filtering enhances accuracy by capturing genuine pressure zones.
Dynamic Volume Heatmap:
Each liquidity bin is rendered as a horizontal box with a color gradient based on volume intensity:
- Low activity bins are shaded lightly.
- High-volume zones appear more vividly in red (sell) or lime (buy).
- The maximum volume bin in each profile is emphasized with a brighter fill and a volume label.
Extended POC Zones:
The Point of Control (PoC) — the bin with the most volume — is extended backwards across the entire lookback period to mark critical resistance (sell-side) or support (buy-side) levels.
Total Volume Summary Labels:
At the center of each profile, a summary label displays Total Buy Liquidity and Total Sell Liquidity volume.
This metric helps assess directional imbalance — when buy liquidity is dominant, the market may favor upward continuation, and vice versa.
Customizable Profile Granularity:
You can fine-tune both Resolution (Bins) and Offset Distance to adjust how far profiles are displaced from price and how many levels are calculated within the ATR range.
🔵 HOW IT WORKS
The indicator calculates an ATR-based buffer above highs and below lows to define the top and bottom of the liquidity zones.
Using a user-defined lookback period, it scans historical candles and divides the buffered zones into bins.
Each bin checks if bullish (or bearish) candles pass through it based on price wicks and body.
Volume from valid candles is summed into the corresponding bin.
When volume exists in a bin, a horizontal box is drawn with a width scaled by relative volume strength.
The bin with the highest volume is highlighted and optionally extended backward as a zone of importance.
Total buy/sell liquidity is displayed with a summary label at the side of the profile.
🔵 USAGE/b]
Identify Stop Hunt Zones: High-volume clusters near swing highs/lows are likely liquidation zones targeted during fakeouts.
Fade or Follow Reactions: Price hitting a high-volume bin may reverse (fade opportunity) or break with strength (confirmation breakout).
Layer with Other Tools: Combine with market structure, order blocks, or trend filters to validate entries near liquidity.
Adjust Offset for Sensitivity: Use higher offset to simulate wider stop placement; use lower for tighter scalping zones.
🔵 CONCLUSION
Dynamic Liquidity Depth transforms raw price and volume into a spatial map of liquidity. By revealing areas where stop orders are likely hidden, it gives traders insight into price manipulation zones, potential reversal levels, and breakout traps. Whether you're hunting for traps or trading with the flow, this tool equips you to navigate liquidity with precision.

DCA Order Info PlannerDescription :
This script is a Dollar-Cost Averaging (DCA) order planner designed for SPOT, LONG, and SHORT markets. It automatically calculates the optimal price levels for your orders based on configurable parameters, while also considering leverage and liquidation price.
🔹 Key Features:
1. Automatic Order Planning:
- The script calculates price levels for your orders based on an adjustable scaling coefficient (default: 1.5).
- You can set the percentage interval between each order (default: 2%).
- Displays the number of units to buy/sell at each level.
2.Leverage Management:
- Integrates a configurable leverage and computes the liquidation price for LONG and SHORT positions.
3.Clear Visual Display:
- Markers on the chart indicating order levels with customizable labels.
- A summary table shows price levels and corresponding quantities.
- Visualizes Stop Loss and Take Profit levels if defined.
4.Automatic Alerts:
- Sends alerts when the price reaches an order level.
🔹 Customizable Parameters:
- Starting Price: Initial price for calculating orders.
- Budget: Total budget for DCA orders.
- Leverage: Multiplier for LONG/SHORT positions.
- Scaling Coefficient: Adjusts the spacing between order levels.
- Maximum DCA Levels: Limits the number of generated orders.
🔹 How to Use:
1. Configure the parameters according to your strategy.
2. The script displays order levels and quantities on the chart.
3. Use the summary table to manually input orders on your favorite trading platform.
This script is particularly useful in volatile market conditions to average your entry or exit price and manage risk effectively.

Open Interest Inflows & Outflows [LuxAlgo]The Open Interest Inflows & Outflows indicator focuses on highlighting alterations in the overall count of active contracts associated with a specific financial instrument.
The indicator also includes an oscillator highlighting the price sentiment to use in conjunction with the open interest flow sentiment and also includes a rolling correlation of the open interest flow sentiment with a user-selected source.
🔶 USAGE
Open Interest (OI) indicates the total number of active contracts, encompassing both long and short positions, for a specific financial instrument at any given moment. This key indicator helps traders and analysts assess market activity and sentiment.
An increase in open interest generally indicates new money flowing into the market, suggesting increased activity and the potential for a trending market. Conversely, a decrease in open interest indicates that traders are closing their positions, suggesting less interest in that particular contract.
Open Interest Flow Sentiment assesses the correlation between the initiation of new positions (inflows) and the closure of existing positions (outflows) for a particular instrument. Positive values suggest a prevalence of inflows, while negative values signify a prevalence of outflows.
The magnitude of the deviation from zero reflects the extent of dominance, either in inflows or outflows.
Price Sentiment estimates the relationship between the strength of bulls (buyers) and bears (sellers) on an instrument. Positive values indicate higher bull power and negative values indicate higher bear power.
The correlation feature is a key component of the indicator and helps analyze the relationship between trading volume and Open Interest changes. If volume increases along with rising Open Interest, it supports the validity of the price trend.
A divergence between price movement, volume, and Open Interest may signal potential reversals.
🔶 DETAILS
This indicator, based on Dr. Alexander Elder's acclaimed Elder-Ray concept, aids traders in evaluating the strength of both bulls and bears by delving beneath the surface of the markets. It uncovers data not immediately apparent from a superficial glance at prices. The indicator comprises two components: Bull Power and Bear Power.
Considering that the high price of any candle signifies the maximum power of buyers and the low price represents the maximum power of sellers, Elder employs the 13-period Exponential Moving Average (EMA) to depict the average consensus of price value. Bull Power assesses whether buyers can drive prices above the average consensus of value, while Bear Power assesses whether sellers can push prices below this average.
Here are the formulas for Bull Power and Bear Power:
bull_power = high - ema(close, 13)
bear_power = low - ema(close, 13)
This concept is utilized to calculate Open Interest Flow Sentiment and Price Sentiment. The Open Interest Flow Sentiment estimates the relationship between new positions (inflows) and positions being closed (outflows), providing insights into market dynamics. The Price Sentiment, on the other hand, gauges the correlation between price movements and the Elder-Ray components, aiding traders in identifying potential shifts in market sentiment and momentum.
🔶 SETTINGS
🔹Open Interest Inflows & Outflows
OI Sentiment Correlation: toggles the visibility of Open Interest correlation with a variety of sources.
Money Flow Estimates: toggles the visibility of Money Flow Estimates calculated for the last bar.
🔹Style
OI Flow Sentiment: toggles the visibility of Open Interest Flow Sentiment, along with color customization options.
Price Sentiment: toggles the visibility of Price Sentiment, along with color customization options.
Correlation Colors: color customization option for the Correlation Area.
🔹Others
Smoothing: smoothing length applicable for Open Interest Flow Sentiment and Price Sentiment.
🔶 RELATED SCRIPTS
Open-Interest-Chart
Liquidation-Estimates
Thanks to our community for recommending this script. For more conceptual scripts and related content, we welcome you to explore by visiting >>> LuxAlgo-Scripts .

Margin/Leverage CalculationMargin
This library calculates margin liquidation prices and quantities for long and short positions in your strategies.
Usage example
// ############################################################
// # INVESTMENT SETTINGS / INPUT
// ############################################################
// Get the investment capital from the properties tab of the strategy settings.
investment_capital = strategy.initial_capital
// Get the leverage from the properties tab of the strategy settings.
// The leverage is calculated from the order size for example: (300% = x3 leverage)
investment_leverage = margin.leverage()
// The maintainance rate and amount.
investment_leverage_maintenance_rate = input.float(title='Maintanance Rate (%)', defval=default_investment_leverage_maintenance_rate, minval=0, maxval=100, step=0.1, tooltip=tt_investment_leverage_maintenance_rate, group='MARGIN') / 100
investment_leverage_maintenance_amount = input.float(title='Maintanance Amount (%)', defval=default_investment_leverage_maintenance_amount, minval=0, maxval=100, step=0.1, tooltip=tt_investment_leverage_maintenance_amount, group='MARGIN')
// ############################################################
// # LIQUIDATION PRICES
// ############################################################
leverage_liquidation_price_long = 0.0
leverage_liquidation_price_long := na(leverage_liquidation_price_long ) ? na : leverage_liquidation_price_long
leverage_liquidation_price_short = 0.0
leverage_liquidation_price_short := na(leverage_liquidation_price_short ) ? na : leverage_liquidation_price_short
leverage_liquidation_price_long := margin.liquidation_price_long(investment_capital, strategy.position_avg_price, investment_leverage, investment_leverage_maintenance_rate, investment_leverage_maintenance_amount)
leverage_liquidation_price_short := margin.liquidation_price_short(investment_capital, strategy.position_avg_price, investment_leverage, investment_leverage_maintenance_rate, investment_leverage_maintenance_amount)
Get the qty for margin long or short position.
margin.qty_long(investment_capital, strategy.position_avg_price, investment_leverage, investment_leverage_maintenance_rate, investment_leverage_maintenance_amount)
margin.qty_short(investment_capital, strategy.position_avg_price, investment_leverage, investment_leverage_maintenance_rate, investment_leverage_maintenance_amount)
Get the price and qty for margin long or short position.
= margin.qty_long(investment_capital, strategy.position_avg_price, investment_leverage, investment_leverage_maintenance_rate, investment_leverage_maintenance_amount)
= margin.qty_short(investment_capital, strategy.position_avg_price, investment_leverage, investment_leverage_maintenance_rate, investment_leverage_maintenance_amount)
Multi VWAP for Wick HunterCredit: honeybadgermakesfunnymoney for this Open Source Script
Published:
This is a tool that will allow you to visualize Wick Hunter's calcation of VWAP. Wick Hunter uses this calcuation for its Liqudations Bots.
There are four settings that you need to be configured to visualize your VWAP Band:
Long VWAP - The distance from current VWAP price, in %, that price must be UNDER when a liquidation event occurs to meet your you VWAP condition. The higher the value, the more price must move below the current VWAP price for it to enter a LONG position.
Short VWAP - The distance from current VWAP price, in %, that price must be ABOVE when a liquidation event occurs to meet your you VWAP condition. The higher the value, the more price must move above the current VWAP price for it to enter a SHORT position.
VWAP Timeframe - Select the timeframe you want the VWAP to be measured on.
VWAP Periods: Input the time period over which you want the VWAP to be measured over. For example, if you use "5" for this and "15" for VWAP Timeframe. The VWAP will be calculated based on the last five 15 minute candles.
You can play around with these settings using the indicator provide above. The indicator will print a triangle when the conditon for VWAP is met for a long for short trade. Play around with these settings. A few good timeframes that are popular are 5 minute, 15 minute, and one hour (60 minute). As far as periods, the most common settings are between 5 periods and 15 periods. In general the lower the timeframe and periods and closer VWAP will follow price.

Position calculator [krazke]This indicator will help you calculate your position. This will automatically calculate potential liquidation price and select leverage for your stop loss and risk size.
How to use it:
1. Select position direction. (long checkmark - selected if it's long)
2. Select entry. If you want to use custom entry price select checkmark and set value. (Current price is default entry)
3. Enter stop loss.
4. Enter risk.
5. Enter max leverage for current ticker.
P.S. Liquidation price is not 100% correct but it almost.
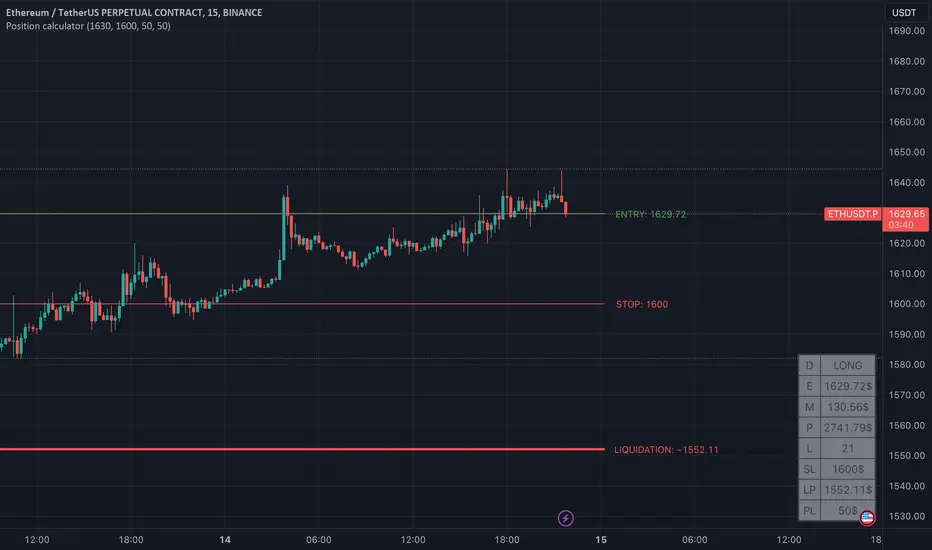
Open Interest OffsetThis indicator is used to display whether there has been an abnormal increase or decrease in recent contract positions. Its usage is similar to the RSI indicator.
Please note that this indicator uses fixed (customizable) thresholds of 0.4 and 0.6 to indicate when abnormal opening and closing occur respectively. For some altcoins, their values may far exceed 0.4 so please adjust accordingly based on your symbol.
(1) When there is an abnormal increase in recent contract positions, the value of the indicator will be above 0.4. This means that there may be a liquidation market situation occurring subsequently. If the market background at this time is rising, it may not be suitable to continue buying because the indicator shows that it is currently overbought. On the contrary, it may be appropriate to sell now.
(2) When there is an abnormal decrease in recent contract positions, the value of the indicator will be below -0.4. This means that a liquidation market situation has occurred recently. If the market background at this time is falling, it may not be suitable to continue shorting because the indicator shows that it is currently oversold. On the contrary, it may be appropriate to buy now.
Special thanks to the following TradingView community members for providing open-source indicators and contributing to the development of this indicator!
Open Interest Delta - By Leviathan - @LeviathanCapital
Regarding the relationship with the above-mentioned open source indicator:
Indicator Open Interest Delta - By Leviathan - @LeviathanCapital obtained OI data for Binance USDT perpetual contracts in the code. We refer to their method of obtaining OI data in our code.
============= 中文版本 =============
该指标用于显示近期合约持仓量是否有异常的增加和减少。它的用法类似于RSI指标
请注意,该指标使用了固定的(可定制的)阈值0.4和0.6来提示异常开仓和平仓的发生。对于某些山寨币而言,指标的数值可能远大于0.4。请根据你所关注的标的自行调整
(1)当近期合约持仓量有异常的增加时,指标的值会在0.4以上。这意味着后续可能有清算行情的发生。若此时市场背景为上涨,此时可能不太适合继续做多,因为指标显示目前处于超买行情。相反,现在可能适合卖出
(2)当近期合约的持仓量有异常的减少时,指标的值会在-0.4以下。这意味着近期已经发生了清算行情。若此时市场背景为下跌,此时可能不太适合继续做空,因为指标显示目前处于超卖行情。相反,现在可能适合买入
特别感谢以下TradingView社区成员提供开源指标并为该指标的开发做出贡献!
Open Interest Delta - By Leviathan - @LeviathanCapital
与上述开源指标的关系:
指标Open Interest Delta - By Leviathan - @LeviathanCapital在代码中获取了Binance USDT永续合约的OI数据。我们在代码中参考他们获取OI数据的方式

Crypto Leverage Ratio [Market Cap / Open Interest in %]This indicator calculates what percentage of market cap data corresponds to open interest data.
Leverage Ratio = 1/(Market Cap / 100 * Open Interest)
Market Cap data comes from TradingView -> CRYPTOCAP:YOURCOINSYMBOL
Open Interest data comes from IntoTheBlock -> INTOTHEBLOCK:YOURCOINSYMBOL_PERPETUALOPENINTEREST
IntoTheBlock refresh perpetual data at the end of the day. It means there is no intraday data.
It can only be used in Daily or higher time intervals.
This indicator and any other indicator can not precisely calculate real leverage ratio except exchanges itself. This calculation is just based on assumption.
You can see the exact same result by just adding:
1/(CRYPTOCAP:BTC/100*INTOTHEBLOCK:BTC_PERPETUALOPENINTEREST)
to your symbol search, if your chart is a BTC chart.
"
The Futures Open Interest Leverage Ratio is calculated by dividing the market open contract value, by the market cap of the asset (presented as %). This returns an estimate of the degree of leverage that exists relative to market size as a gauge for whether derivatives markets are a source of deleveraging risk.
High Values indicate that futures market open interest is large relative to the market size. This increases the risk of a short/long squeeze, deleveraging event, or liquidation cascade.
Low Values indicate that futures market open interest is small relative to the market size. This is generally coincident with a lower risk of derivative led forced buying/selling and volatility.
Deleveraging Events such as short/long squeezes, or liquidation cascades can be identified by rapid declines in OI relative to market cap, and vertical drops in the metric.
-glassnode
"
says glassnode. I think it is more than that. Especially with MAs.

Margin selling pressure levelsPredicts local bottoms and support levels. Simply enter a strong resistance level (Settings > Liquidation Resistance Level), and this indicator shows you levels where margin selling pressure is likely to drop off. This is based off of the assumption that leveraged traders will likely want their liquidation point protected above a strong resistance level.
2x - blue
3x - green
4x - yellow
5x - orange
10x - red
