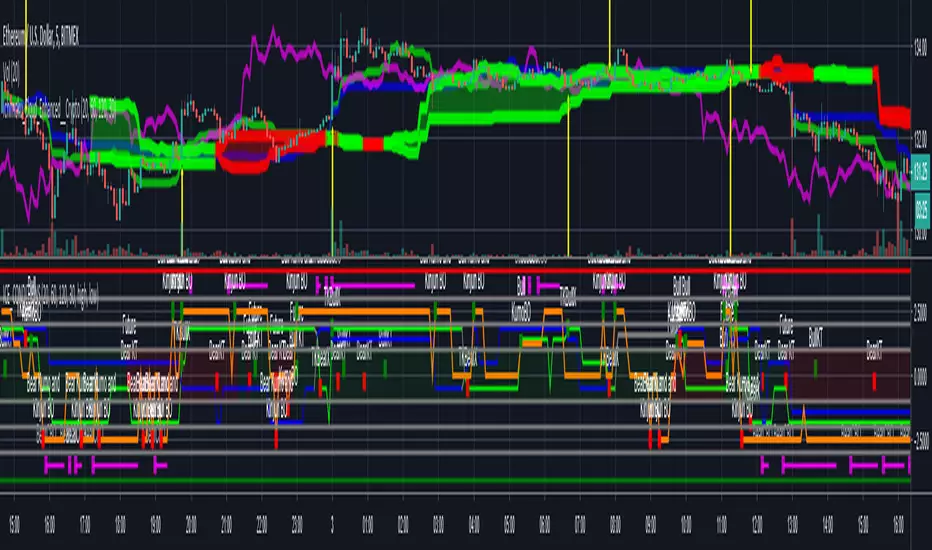
Index OverlayNote: use this indicator only with New York Timezone + you need to understand ICT concepts already, this indicator simplifies the chart work.
Also, in this script I added some open-source scripts from creators here on tradingview, but I forgot to annotate their names...
If you recognize your script, please text me and I'll add your credits.
features
- displays Midnight and Sunday open lines
- day separation (from midnight)
- FVGs
- VWAP (calculated from midnight open)
- daily labels
- TDH & TDL (liquidity)
- trading time window (from 9:30 to 12:00 ny time)
HOW TO USE
Combined with daily bias, the idea is to wait for 9:30 to open, and then wait for a liquidation of TDH (plotted in blue) or TDL (in red).
Once it happens, you can look for ICT buy / sell model, ideally in the 5m TF.
在脚本中搜索"Liquidation"

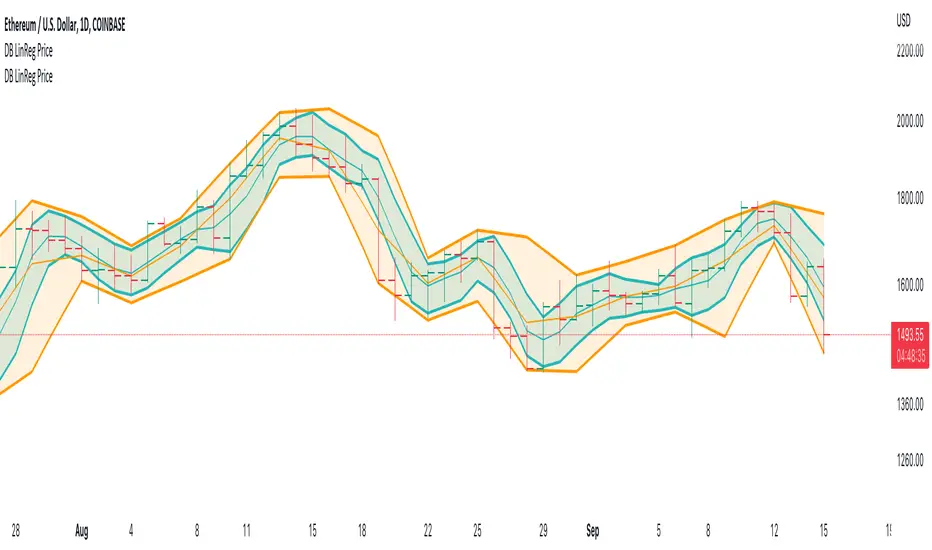
DB LinReg Price ChannelDB LinReg Price Channel
What does the indicator do?
This indicator is very simple and designed to plot a quick linear regression channel for high, hlc3, and low. It allows the symbol and timeframe to be configured in the settings.
The purpose of the indicator is to obtain a price channel for the desired timeframe with outliers removed.
How should this indicator be used?
I personally use two of the indicators with one set to the current timeframe and the second set to 2x of the current timeframe. For example, 12H and Daily which gives you a fast and slow price channel for your desired timeframe. Price channels can help you know the value of the current price in respect to the timeframe and for pricing stop losses and liquidation levels.
Does the indicator include any alerts?
Not yet.
Use at your own risk and do your own diligence.
Enjoy!
3C QFL Mean reversalWhat is QFL trading strategy?
QFL stands for Quickfingersluc, and sometimes it is referred to as the Base Strategy or Mean Reversals. Its main idea is about identifying the moment of panic selling and buying below the base level and utilizing Safety orders.
What is Base level or Support Level?
Base level or Support Level refers to the lowest price level that was reached before the moment the price started increasing again. At that level, you can notice that buyers of some cryptocurrencies make a strong reaction.
In this strategy we can also reverse the strategy and go short. But i must warn you that that is alot riskier.
QFL is meant to be used on higher TF's like 1hr, 2hr and 4hr. But this strategy also work well on lower Timeframes.
The script also simulates DCA strategy with parameters used in 3commas DCA bots for futures trading.
Experiment with parameters to find your trading setup.
Beware how large your total leveraged position is and how far can market go before you get liquidated!
Do that with the help of futures liquidation calculators you can find online!
Included:
An internal average price and profit calculating, instead of TV`s native one, which is subject to severe slippage.
A graphic interface, so levels are clearly visible and back-test analyzing made easier.
Long & Short direction of the strategy.
Table display a summary of past trades
Vertical colored lines appear when the new maximum deviation from the original price has
been reached
All the trading happens with total account capital, and all order sizes inputs are expressed in percent.

EMA bands + leledc + bollinger bands trend following strategy v2The basics:
In its simplest form, this strategy is a positional trend following strategy which enters long when price breaks out above "middle" EMA bands and closes or flips short when price breaks down below "middle" EMA bands. The top and bottom of the middle EMA bands are calculated from the EMA of candle highs and lows, respectively.
The idea is that entering trades on breakouts of the high EMAs and low EMAs rather than the typical EMA based on candle closes gives a bit more confirmation of trend strength and minimizes getting chopped up. To further reduce getting chopped up, the strategy defaults to close on crossing the opposite EMA band (ie. long on break above high EMA middle band and close below low EMA middle band).
This strategy works on all markets on all timeframes, but as a trend following strategy it works best on markets prone to trending such as crypto and tech stocks. On lower timeframes, longer EMAs tend to work best (I've found good results on EMA lengths even has high up to 1000), while 4H charts and above tend to work better with EMA lengths 21 and below.
As an added filter to confirm the trend, a second EMA can be used. Inputting a slower EMA filter can ensure trades are entered in accordance with longer term trends, inputting a faster EMA filter can act as confirmation of breakout strength.
Bar coloring can be enabled to quickly visually identify a trend's direction for confluence with other indicators or strategies.
The goods:
Waiting for the trend to flip before closing a trade (especially when a longer base EMA is used) often leaves money on the table. This script combines a number of ways to identify when a trend is exhausted for backtesting the best early exits.
"Delayed bars inside middle bands" - When a number of candle's in a row open and close between the middle EMA bands, it could be a sign the trend is weak, or that the breakout was not the start of a new trend. Selecting this will close out positions after a number of bars has passed
"Leledc bars" - Originally introduced by glaz, this is a price action indicator that highlights a candle after a number of bars in a row close the same direction and result in greatest high/low over a period. It often triggers when a strong trend has paused before further continuation, or it marks the end of a trend. To mitigate closing on false Leledc signals, this strategy has two options: 1. Introducing requirement for increased volume on the Leledc bars can help filter out Leledc signals that happen mid trend. 2. Closing after a number of Leledc bars appear after position opens. These two options work great in isolation but don't perform well together in my testing.
"Bollinger Bands exhaustion bars" - These bars are highlighted when price closes back inside the Bollinger Bands and RSI is within specified overbought/sold zones. The idea is that a trend is overextended when price trades beyond the Bollinger Bands. When price closes back inside the bands it's likely due for mean reversion back to the base EMA in which this strategy will ideally re-enter a position. Since the added RSI requirements often make this indicator too strict to trigger a large enough sample size to backtest, I've found it best to use "non-standard" settings for both the bands and the RSI as seen in the default settings.
"Buy/Sell zones" - Similar to the idea behind using Bollinger Bands exhaustion bars as a closing signal. Instead of calculating off of standard deviations, the Buy/Sell zones are calculated off multiples of the middle EMA bands. When trading beyond these zones and subsequently failing back inside, price may be due for mean reversion back to the base EMA. No RSI filter is used for Buy/Sell zones.
If any early close conditions are selected, it's often worth enabling trade re-entry on "middle EMA band bounce". Instead of waiting for a candle to close back inside the middle EMA bands, this feature will re-enter position on only a wick back into the middle bands as will sometimes happen when the trend is strong.
Any and all of the early close conditions can be combined. Experimenting with these, I've found can result in less net profit but higher win-rates and sharpe ratios as less time is spent in trades.
The deadly:
The trend is your friend. But wouldn't it be nice to catch the trends early? In ranging markets (or when using slower base EMAs in this strategy), waiting for confirmation of a breakout of the EMA bands at best will cause you to miss half the move, at worst will result in getting consistently chopped up. Enabling "counter-trend" trades on this strategy will allow the strategy to enter positions on the opposite side of the EMA bands on either a Leledc bar or Bollinger Bands exhaustion bar. There is a filter requiring either a high/low (for Leledc) or open (for BB bars) outside the selected inner or outer Buy/Sell zone. There are also a number of different close conditions for the counter-trend trades to experiment with and backtest.
There are two ways I've found best to use counter-trend trades
1. Mean reverting scalp trades when a trend is clearly overextended. Selecting from the first 5 counter-trend closing conditions on the dropdown list will usually close the trades out quickly, with less profit but less risk.
2. Trying to catch trends early. Selecting any of the close conditions below the first 5 can cause the strategy to behave as if it's entering into a new trend (from the wrong side).
This feature can be deadly effective in profiting from every move price makes, or deadly to the strategy's PnL if not set correctly. Since counter-trend trades open opposite the middle bands, a stop-loss is recommended to reduce risk. If stop-losses for counter-trend trades are disabled, the strategy will hold a position open often until liquidation in a trending market if th trade is offsides. Note that using a slower base EMA makes counter-trend stop-losses even more necessary as it can reduce the effectiveness of the Buy/Sell zone filter for opening the trades as price can spend a long time trending outside the zones. If faster EMAs (34 and below) are used with "Inner" Buy/Zone filter selected, the first few closing conditions will often trigger almost immediately closing the trade at a loss.
The niche:
I've added a feature to default into longs or shorts. Enabling these with other features (aside from the basic long/short on EMA middle band breakout) tends to break the strategy one way or another. Enabling default long works to simulate trying to acquire more of the asset rather than the base currency. Enabling default short can have positive results for those high FDV, high inflation coins that go down-only for months at a time. Otherwise, I use default short as a hedge for coins that I hold and stake spot. I gain the utility and APR of staking while reducing the risk of holding the underlying asset by maintaining a net neutral position *most* of the time.
Disclaimer:
This script is intended for experimenting and backtesting different strategies around EMA bands. Use this script for your live trading at your own risk. I am a rookie coder, as such there may be errors in the code that cause the strategy to behave not as intended. As far as I can tell it doesn't repaint, but I cannot guarantee that it does not. That being said if there's any question, improvements, or errors you've found, drop a comment below!

BTC Futures BasisShows various basis percentages in a table and plots historical basis. Also has an alert function for backwardation events. Useful for tracking bullish/bearish sentiment in BTC futures markets.
*Currently displays March and June futures for the following exchanges: Bitmex, Binance, Deribit, Okex, and FTX
Also displays CME Continuous Next Contract. All of the symbols are customizable.
-----------
Market-wide backwardation usually occurs during a heavy sell-off (such as a liquidation cascade).
**For getting alerts of backwardation events, I recommend creating an alert on the 1 minute chart with the condition "Any alert() function call". Alert level is customizable as well.
-----------
*NOTE!! : Futures contracts expire (obviously), so the contract symbols will need to be updated periodically. I will try to keep them updated going into the future.
**NOTE2!! : The alert() function does not track the CME contract. This is to avoid false triggers.

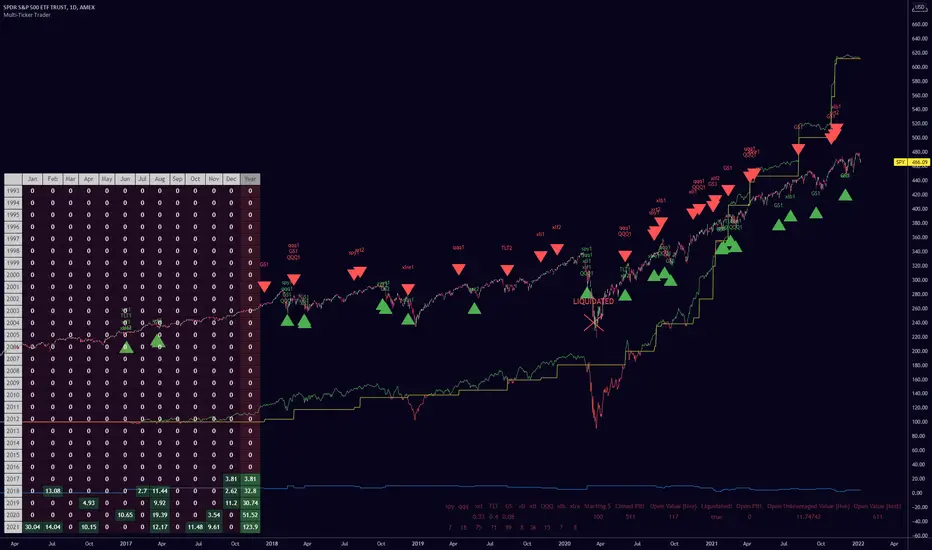
Multiple Ticker TraderThis indicator can be used as an alternative to the built in Strategy Tester for those who want to (back) test a strategy on multiple tickers simultaneously and see it's performance.
Just change the buy and sell conditions in the code to fit your needs.
The strategy I've used here is scaling into up to 10 tickers a maximum of 5 times per ticker every time they retrace (another) 10% from their all time high.
You can set the maximum number of total trades and disable scale ins by setting them to an impossible number (such as, 99% away from the all time high).
Credit to QuantNomad for the monthly/yearly returns table bottom left.
The bottom right table shows the current number of shares the algo is long and also the total all-time returns from each individual ticker, and other data.
The blue line is the number of positions the script is currently long. Each scale into the same ticker represents one position.
The yellow line is the closed P&L.
The green/red line is the live P&L.
I've used leverage for the example image just to showcase the liquidation display.
These particular buy/sell conditions cannot close positions at a loss, so be careful if you're wild enough to use this setup live without understanding the script yourself. I haven't used it live myself yet and you should assume there are serious bugs before thinking about using it live, though I'm using a similar thing on cryptos and it's going fine.
You can edit the leverage, maximum trades and back test range in the settings. The number following the ticker on each label represents which scale in was bought/sold.
Enjoy :) let me know if you find any good results
DCA Bot Long/Short Thanks to @TheTradingParrot for the inspiration and knowledge shared.
Thanks to @ericlin0122 for the original DCA Bot Emulator which is the backbone of this strategy.
The script simulates DCA strategy with parameters used in 3commas DCA bots for futures trading. Experiment with parameters
to find your trading setup.
Beware how large your total leveraged position is and how far can market go before you get liquidated!
Do that with the help of futures liquidation calculators you can find online!
I`ve added:
1) an internal average price and profit calculating, instead of TV`s native one, which is subject to severe slippage.
2) I`ve built a graphic interface, so levels are clearly visible and back-test analyzing made easier.
3) now both Long & Short direction of the strategy exist.
4) trailing TP which was featured in the initial script has been removed because TV`s execution model makes
it impossible to know how the real world trailing would have unfolded.
5) the table is self explanatory, and it is there to help you discover what happened and where.
6) vertical colored lines appear when the new maximum deviation from the original price has
been reached
All the trading happens with total account capital, and all order sizes inputs are expressed in percent.
Known issues:
When deviation is small, and the same candle triggers safety AND the close order, the initial orders are closed, but a
new one opens on the next candle. This is "resolved" by closing the unwanted trade forcefully on the next candle, affecting
profit calculating minimally and guaranteeing that what should be closed has been closed.
The code could be improved through use of arrays, making the table flexible so the number of rows should be dynamic depending
on the number of SOs.
!!!!! IMPORTANT!!!!!
This strategy script is made to receive a signal from an exterior study script, which should plot +100 for long or -100 for short
entry (that is by default - values can be changed in the strategy settings menu). That plot should be found in "Enter Trigger" input
dropdown menu at the bottom of strategy settings menu. Removing the "and trigger == long/short_trigger" condition from strategy entry
conditions makes the strategy open trades ASAP.
Cheers!

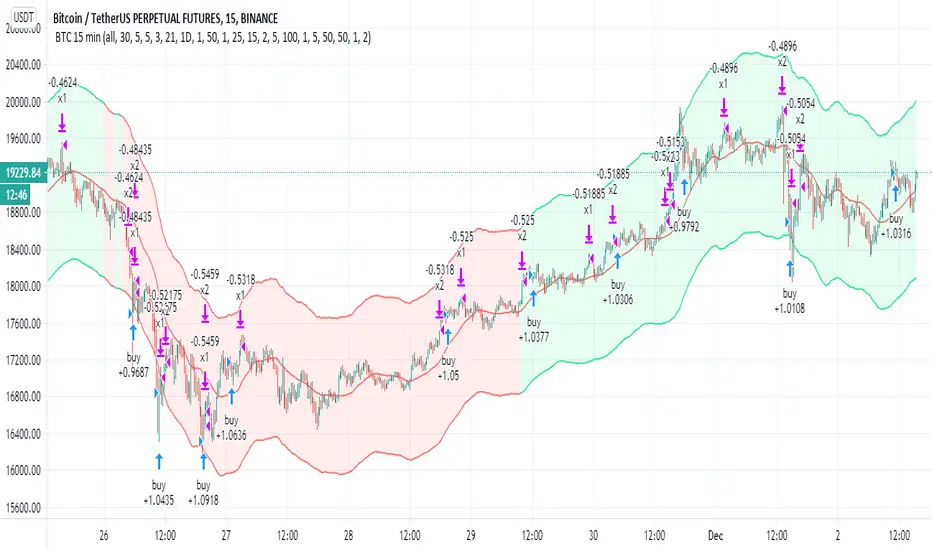
BTC 15 minThis strategy try to catch the uptrend mainly (seems to work on BTC 15 less on others)
the aim is to get 2% in uptrend which is more easy to do then to search only for lowest
since it buy in uptrend it can risky if market change direction
there are two take profit (1% and 2% ) , you take out 50% of equity after the first 1% gain
the stop loss and re buy set 5%
so you exit after 5 % loss and re buy it again at lower price
the aim here is to do leverage trades so you can calculate your risk or lot and the leverage power you want
now set on 100% lot leverage X1
you can try any combination you want but when you do leverage trading you need to do things that the back tester of TV cannot do so well
for example if you put 100X leverage you will be liquidated at 1%
50=2%
20=5%
10=10%
5=20%
you need that your stop loss will be above the liquidation level
stop loss are shit in margin trades as they can kick you out very fast and you will lose many good trades
so I prefer 5X max 10 X trade (this bot can work by himself but i prefer to do it manually for this kind of trades.
all u need to do is to choose what risk you want to have (3% of lot? 5%, 10% or higher )
so this tool try to give you upward buy strategy that aim to get longs at upward trends (short targets that are more easy to get )
and to use leverage as way to make more profit (now bot set to no leverage )
be wise with your money :)
the bot not suppose to repaint but if you find repaint issue then let me know
buy system is based on cross of linear over modified non repainted HMA that set to 1 min (so it buy the uptrend only+ filter based on ema that try not to start cycle of buy in down traade
sell is not so important is mainly cased on percentage channel seen
trend color on Chanel not related to the buy and sell system
NOT-ONLY-SHORTThis script is the same as NOT-ONLY-LONG but without the security() function.
It use the following indicators: RMI + ADX + RSI + ICHIMOKU cloud only.
The fuchsia dot is the average price of the positions. The Take Profit is calculated from there.
It does not have Stop Loss, instead it makes a re-entry to try to improve the liquidation price.
Enjoy!

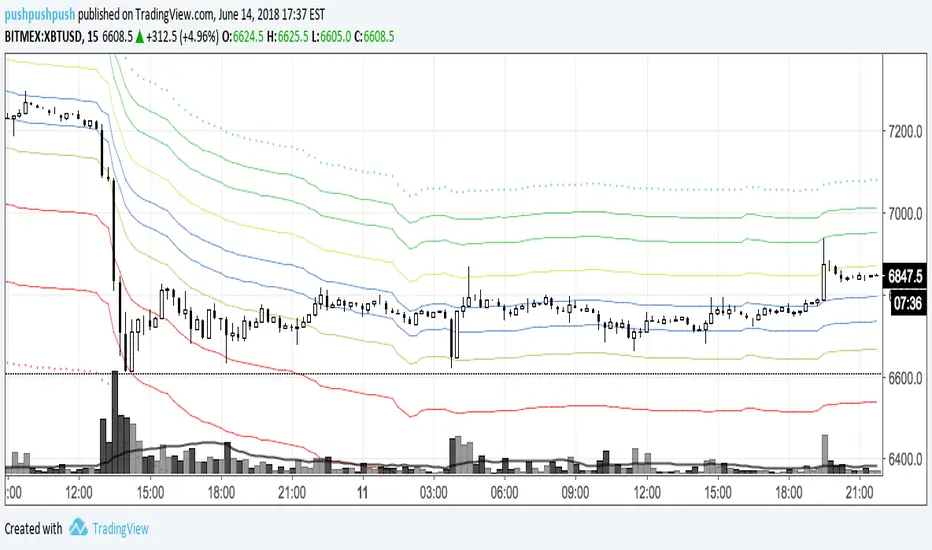
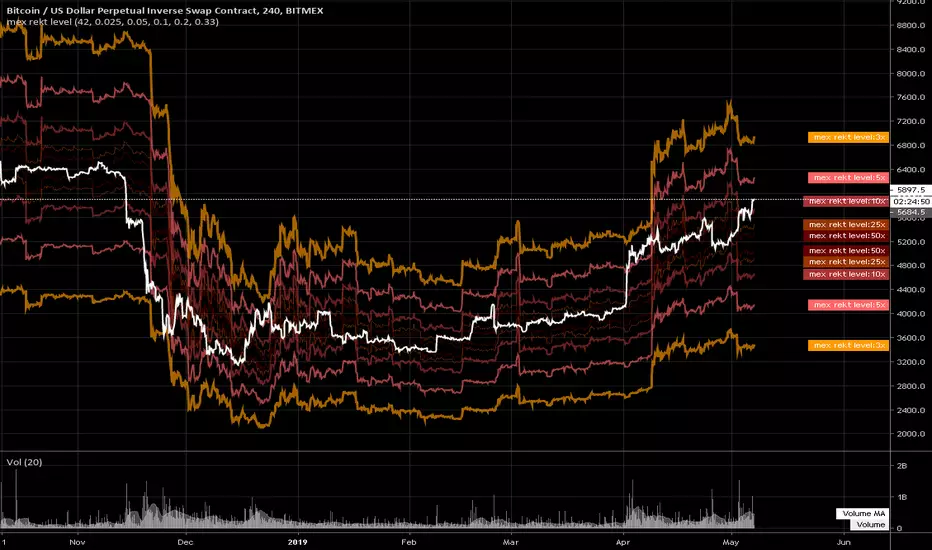
The Bitmex Liquidator v1//This plots the liquidation levels according to user inputed reference level (yellow line).
//Set the reference level to the value of choice.

mex rekt levelsimple tool to calculate where the positions are liquidated. each color is a level of default leverage used on mex, eg. 10x,25x, and so on.
there is an offset input to adjust the levels horizontally, to make it easier to see in time where the positions got liquidated
Volume Weighted ALMA RibbonsVolume weighted version of ALMA Ribbons script found here
-------------------------------------------------------
If you find it useful please consider a tip/donation to the rumpy liquidation recovery fund : BTC - 3BMEXEDyWJ58eXUEALYPadbn1wwWKmf6sA

Ichimoku Cloud Enhanced - Conditions IndicatorOriginal Cloud code base from "Ichimoku Cloud Enhanced For Crypto"
Link here
At a glance simplified rendering of ichimoku cloud elements and algorithmic detection of all ichimoku cloud events. Has alert conditions for all/most events you would want.
Central red/green band represents the cloud and the current "future" cloud colour.
Kumo Twists are shown for when they are both below/above the current candle and for when they first appear in the "future" cloud.
Orange line represents close and it's relative position to the cloud and Kinjun.
Tenkan and Kinjun, crosses and relative position to the cloud (blue/green lines). Will show crosses if they occurred above/in/below the cloud etc.
Chikouspan Breakouts (above/below cloud & price action) fuchsia lines.
It should have all the logic required to build a strategy from IC conditions by combining them however you want.
-------------------------------------------------------
If you find it useful please consider a tip/donation to the rumpy liquidation recovery fund : BTC - 3BMEXEDyWJ58eXUEALYPadbn1wwWKmf6sA
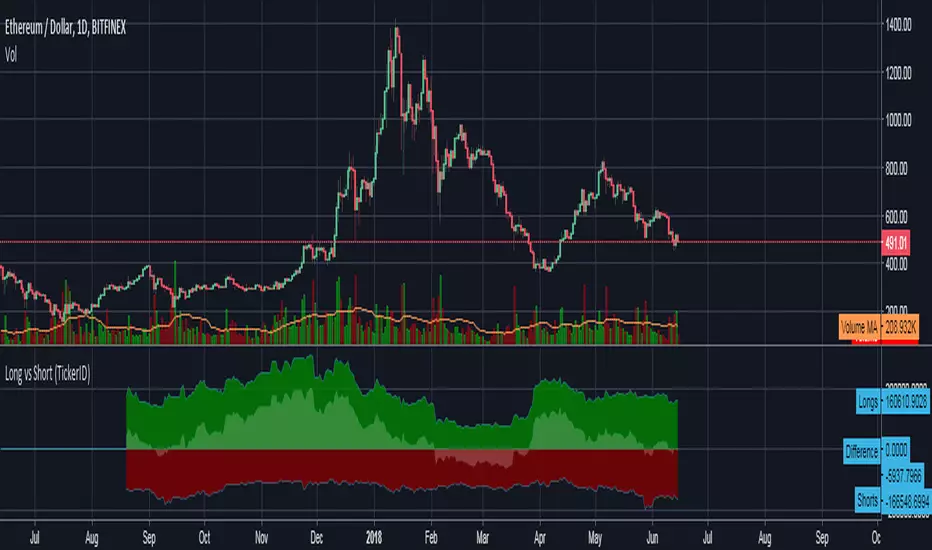
Bitfinex Long vs Short (TickerID)Uses the active ticker to show long/short values on all Bitfinex pairs that have that data available on Tradingview.
Bitmex LLVWMA - Mahal RemixOriginal credit goes to jaqobs:
Added two new liq MAs based that seemed to be missing/catching more tops/bottoms. Removed 10x short liq MA since it never gets hit.