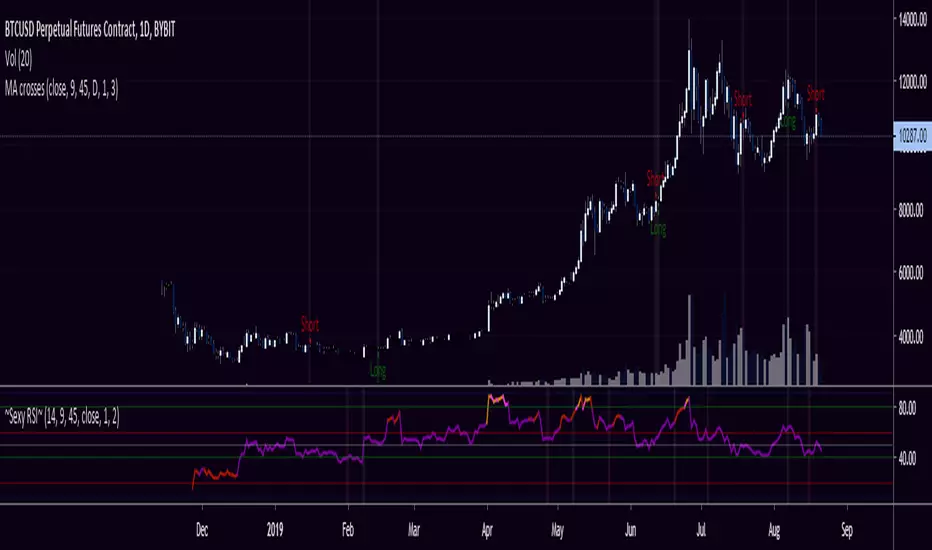
Nightrangers IndicatorDescription
This indicator combines three EMA's, Ichimoku Cloud, RSI and MACD. By combining and modifying their use case this turns into an extremely powerful and accessible indicator for finding long and short position entries, below is a description of how to use this indicator, and what makes it different.
Primary Use case
The three EMA's would be the initial indicators you would be looking at, they are based on the 7d, 25d and 200d MA - Used on their own, they would be worthless, and this is where the Ichimoku Cloud comes into it, I have removed all other aspects of the Ichimoku Cloud and only kept the baseline, combine this with the three MA's and we have a very powerful indicator for finding Long entries, that is used uniquely in a way to which the Ichimoku Cloud is not originally meant to be used for.
An early indication of a LONG entry would be when the 7d MA crosses above the Ichimoku Baseline, through this early indicator, you are able to watch and monitor the chart, you would be waiting to see if the 25d MA then also crosses above the Ichimoku Baseline, This would be the second important indication of a long entry. The 200d MA helps here when making decisions on where to set your own personal take profits - If the Ichimoku baseline, and the MA's are below the 200d MA, you would be expecting a bounce point here, or heavy resistance so the long entry could be over a shorter period, than that if it was above the 200d MA, which is why it is included here, to help make a better informed choice.
The latter is reversed for finding short positions, and entries. This indicator is completely reliant on each other to find the best possible entry/exit by complementing each other, and by using the Ichimoku Baseline on it's own, and not as the Ichimoku Cloud is intended.
Just using these though, is not enough, which is why the RSI and MACD are also combined, once the conditions are met above, You may find that there can be false positives for entries, and this is where the RSI has multiple use cases within this script.
Firstly the backdrop colour will change based on whether the chart is in an uptrend or downtrend, This is a visual indicator provided to work simultaneaously on the chart itself to help identification of entries/exits easier to identify in conjunction with the above.
Secondly, It is used to display in the top right, The current Trend in a text format, as well as if the current chart is in one of three phases, these are Overbrought, Oversold and accumulation.
And finally it will display the current RSI Value on the last candle in a clear to see blue Label, This helps with the visual accessible side, to help you make a more informed choice depending on your own personal tolerance.
This ties into the above Indicators, by combining the information, you would not be looking to take a long, if for example, the RSI showed it was over-brought, and in a downtrend, even if the MA's had crossed above the Baseline, as this would most likely be a fakeout.
However if the Indicators above, showed a potential long, and the backdrop had flipped green, indicating an uptrend, and it was in an accumulation phase, you would consider this position. and this is where the MACD comes into play.
You would use the MACD to see whether or not the Signal line has crossed over the MACD line, and vice versa - However this script uses it to simplify and portray current market sentiment, and visually display by reducing clutter on screen, and making it more accessible.
It is designed to portray an easy to read and understand visual indicator by displaying in the top right simply as Bullish or Bearish, with markers above the candles ( "M" and "MX" ).
The M indicator is to show where the MACD Crosses above the Signal, and if aligned with all the other indicators within the script, shows a very strong confirmation for a buying opportunity, and vice versa for the "MX" indicator if aligned with the other indicators in reverse, provides a very strong confirmation for opening a short position or for selling.
Secondary Use case
By combining the indicators above, the secondary conditions you would be looking for, If you opened a LONG position, would be knowing when to sell, On top of what has been described above already regarding this, you would be looking to start taking profits, when the 7d MA crosses above or across the candles, and looking to close the position, when the 25d MA also crosses above the candles, and respectively, in reverse for closing short positions. This is shown across the charts to be extremely useful, however, combine this with the other indicators, portrayed in an easy to use and understand visual representation, you are now able to make more informed decisions, on whether to close a position or not.
How is it different and not just a mash up
I have combined these indicators to make the world of trading more accessible for everyone regardless of circumstances, by creating an easy to understand visual representation, keeping colours vibrant and easy to stand out, with clear and simple to read text indications. So whether you are a seasoned trader, or just starting out, you can make more informed choices, without the need of learning how to use multiple different indicators, and learning how to combine them all, or if you have difficulties learning, this indicator also simplifies a lot of the more technical intricacies, by still allowing you to make a more informed choice.
在脚本中搜索"MA Cross"
it is a simple Ma cross alert. We can set any ma period.Simple alert for 20MA cross. We can set any ma period.
it plots the crossing candle. This script is purely testing purpose.
Oscillator Evaluator (Analysis tool)Oscillator Evaluator (Analysis tool)
The oscillator evaluator is a tool that will help you analyse and compare the oscillator of your choice to another 2 oscillators.
By selecting the strategy with which you will analyze the oscillators, you will be able to see the behaviour of the oscillators in different aspects.
First there is a moving average increase or decrease strategy, that will give you a good idea of the correlation of the oscillator with the price.
The second is a commom 2 MA crossover strategy, that will give you and idea of the validaty of that oscillator as a strategy or as a trend filter.
The third strategy is a cross over 0 signal, that will go long on a crossover of 0 and short on a crossunder 0. This helps you see how good is the oscillator at evaluating suport and resistance areas and give you an idea of its balance.
The forth strategy is a Buy/Sell on extremes of the oscillator and will let you know how good is your strategy at spotting good places to buy and sell.
The fith strategy is to evaluate how goood the oscillator is as a mean reversion filter or how good it is at spotting small price changes.
The sixth strategy is similar to the last but is focused on how good is the oscillator spotting good places to take profits on trending strategies.
The 6 strategies in the script produce signals from the oscillator and from the oscillator only.
In conclusion this tool can be used to measure your oscillator and see if it really is as good as you think in comparison to others.
This script is not intended to be used as a full strategy but as a tool.
Golden Cross Optimised For Reversal (by Coinrule)A moving average crossing is a common and widely adopted trading strategy. A short-term MA crossing above a long-term one provides the buy-signal. The opposite generates a sell-signal for the strategy.
Although very popular, this strategy has some limitations that lead to frequent "false signals" and only a few very profitable trades. If the strategy provides two many trades, that generates
the risk for more potential losses
more transaction fees paid
capital allocated to the strategy, thus the impossibility of catching other potential opportunities.
Applying an additional filter to the strategy, consisting of the crossing happening below a longer-term moving average, allows increasing the chances of catching the first crossing signaling a reversal.
The indicator is set to work with three moving averages.
Buy signal: The MA(9) to cross above the MA(50), which must be below the MA(100)
Sell Signal: The MA(9) to cross below the MA(50)
This indicator works significantly better on lower time frames, where it can reduce the noise of getting too many non-profitable signals from a conventional crossing strategy.
The indicator has been backtested mostly on cryptocurrencies.
[M10] Quad MA Trend ScalperFour adjustable moving averages set in order to produce buy and sell signals, works best on smaller timeframes from my backtesting, 10M - 30M seems optimal for scalping.
The idea behind this script is to only enter positions that are following the trend in order to minimise drawdown and decrease risk when using leverage.
The script will only enter long positions when MA crossover occurs above the Long MA 2.
The script will exit a long position when MA Short crosses below Long MA 1.
The script will only enter short positions when MA cross under occurs below the Long MA 2.
The script will exit a short position when MA Short crosses below Long MA 1.
Hull MA-X + Ichimoku Kinko Hyo StrategyHull MA-X:
The Hull MA involves the weighted moving average ( WMA ) in its calculation.
First, calculate the WMA with period (n / 2) and multiply this by 2. Remember ‘n’ is the time period configurable based on the trader’s requirement.
Second, calculate the WMA for period “n” and subtract if from the first step. Thirdly, calculate the weighted moving average with period sqrt (n) using the data from the second step. You can take a look at the below formula:
Hull MA= WMA (2*WMA (n/2) − WMA (n)), sqrt (n))
The default setting is 12 periods in this strategy, fast Hull MA crossing slow Hull MA will generate a circle on charts.
Ichimoku Kinko Hyo:
The Ichimoku Kinko Hyo system includes five kinds of signal, of which this strategy uses four signals i.e. Tenkan Sen / Kijun Sen Cross, price crosses the Kijun Sen, Chikou Span and Kumo. Although the Chikou Span, Senkou Span A and Senkou Span B (Kumo) are shifted into the past/future, these trigger signals enhances the strategy.
The Tenkan Sen, also known as the Turning or Conversion line, is a moving average of the highest high and lowest low over the last 9 periods in this strategy.
The Kijun Sen, also known as the Standard or Base line, is a moving average of the highest high and lowest low over the last 24 periods in this strategy.
The Chikou Span, also known as the Lagging line, is the closing price plotted 24 periods behind in this strategy.
The Senkou Span A, also known as the 1st leading line, is a moving average of the Tenkan Sen and Kijun Sen and is plotted 24 periods ahead in this strategy.
The Senkou Span B, also known as the 2nd leading line, is a moving average of the highest high and lowest low over the last 51 trading days is plotted 24 periods ahead in this strategy.
As with most technical analysis methods, Ichimoku is likely to produce frequent conflicting signals in non-trending markets, So in addition to Ichimoku Kinko Hyo, the Hull MA is used, which is popular amongst some day traders, in combination it attempts to give an accurate signal by eliminating lags and improving the smoothness of the line.
The Hull MA Cross in combination with Ichimoku Kinko Hyo signals tries to give an accurate signal by eliminating lags and improve the smoothness of price activity. Please note that price trends can and do change often, so your readings of the charts and this trading system should be probabilistic, rather than predictive.
Trend MA 20Simple to use for anyone trading a 20 length moving average.
Crossover is signaled once 20 MA crosses 1 MA at close of selected time interval.
3MA/EMA Alerts指标名称(中文/英文)
中文名:多均线趋势指标(带上穿与金叉提醒)
英文名:Multi MA/EMA Trend Indicator (with Price & Golden Cross Alerts)
指标功能介绍(中文)
多均线趋势指标(带上穿与金叉提醒) 是一个可自定义的均线工具,适用于趋势分析和交易信号提醒。
核心功能:
多均线显示
默认显示 EMA20,EMA80/200 可选择显示
每条均线可独立选择 EMA 或 SMA
自定义颜色和线宽
价格上穿均线提醒
当价格向上突破任意开启的均线时触发提醒
可用于捕捉短线趋势启动点
金叉提醒
当短期均线向上穿过中长期均线时触发提醒
可用于捕捉潜在的趋势反转或加速
中文 UI
参数和提醒信息均为中文,便于快速理解和使用
适用场景
趋势确认
趋势反转捕捉
短线入场和长期持仓参考
Indicator Description (English)
Multi MA/EMA Trend Indicator (with Price & Golden Cross Alerts) is a customizable moving average tool for trend analysis and trading alerts.
Key Features:
Multiple Moving Averages
Default display: EMA20; EMA80/200 optional
Each MA can be set as EMA or SMA individually
Customizable colors and line widths
Price Cross Alerts
Alerts when price crosses above any active MA
Helps identify short-term trend initiation points
Golden Cross Alerts
Alerts when a short-term MA crosses above a mid/long-term MA
Useful for detecting trend acceleration or reversal signals
User-Friendly Interface
Parameters and alerts are labeled in Chinese (can be translated)
Applications
Trend confirmation
Trend reversal detection
Short-term entries and long-term position guidance
Market Bias [Mario]Indicator Description: Market Bias
Core Objective and Philosophy
The Market Bias indicator is designed not as a simple signal generator, but as a comprehensive tool for trend analysis and directional bias assessment. Its primary purpose is to provide traders with a clear, at-a-glance understanding of the market's direction across multiple timeframes. By visualizing the alignment of trends, it helps traders make more informed decisions, ensuring they are trading in harmony with the broader market momentum rather than against it. This is a tool for strategic positioning, not for providing blind buy or sell commands.
How It Works: The Core Mechanic
The indicator's logic is based on the relationship between two configurable moving averages (MAs): a Fast MA (defaulting to a 9-period EMA) and a Slow MA (defaulting to a 21-period SMA). The market bias on any given timeframe is determined as follows:
Bullish Bias: When the Fast MA is trading above the Slow MA, it indicates positive, upward momentum.
Bearish Bias: When the Fast MA is trading below the Slow MA, it indicates negative, downward momentum.
Users have full control to customize the type (SMA, EMA, WMA, etc.) and length of each moving average to fit their specific trading style and the asset being analyzed.
Key Feature: The Higher Timeframe (HTF) Bias Table
This is the most powerful feature of the indicator and its main reason for existence. It displays a simple, color-coded table in the corner of the chart, showing the real-time bias for the Daily (D), 4-Hour (4H), and 1-Hour (1H) timeframes.
Purpose: The HTF table solves a critical problem for traders: losing sight of the bigger picture. A trader on a 15-minute chart might see a setup to go long, but if the 4H and Daily charts are strongly bearish, that trade is fighting a powerful current and has a lower probability of success.
Application: By checking this table, a trader can instantly verify if their intended trade direction is aligned with the higher timeframe trends. The ideal scenario is "confluence," where the bias is the same across all key timeframes (e.g., D, 4H, and 1H are all Bullish), giving the trader a strong conviction to only look for long entries.
On-Chart Visual Aids
To support the analysis on the current chart, the indicator provides several visual aids:
Moving Average Plots: Both the Fast and Slow MAs are drawn directly on the chart, allowing traders to see their interaction with price in real-time.
Color-Coded Bars: To make the current trend immediately obvious, the chart's price bars can be colored. Green bars signify a bullish bias (Fast > Slow), while red bars signify a bearish bias (Fast < Slow).
Crossover Markers (Optional): While the indicator is not a signal provider, it can optionally display "Buy" (up arrow) and "Sell" (down arrow) markers when the MAs cross. These should not be interpreted as direct trade signals. Instead, they serve as alerts that the market momentum may be shifting on the current timeframe. They are best used as points of interest or for confirming a thesis that is already supported by the HTF bias.
Summary
In essence, the Market Bias indicator is a decision-support tool. It encourages a disciplined, top-down approach to trading.
Use the HTF Table first to establish your strategic directional bias for the day or week.
Use the on-chart MAs and colored bars to analyze the trend on your preferred trading timeframe.
Use the optional crossover markers only as a final confirmation or timing tool, ensuring they align with the dominant bias established by the higher timeframes.
Cardwell RSI by TQ📌 Cardwell RSI – Enhanced Relative Strength Index
This indicator is based on Andrew Cardwell’s RSI methodology , extending the classic RSI with tools to better identify bullish/bearish ranges and trend dynamics.
In uptrends, RSI tends to hold between 40–80 (Cardwell bullish range).
In downtrends, RSI tends to stay between 20–60 (Cardwell bearish range).
Key Features :
Standard RSI with configurable length & source
Fast (9) & Slow (45) RSI Moving Averages (toggleable)
Cardwell Core Levels (80 / 60 / 40 / 20) – enabled by default
Base Bands (70 / 50 / 30) in dotted style
Optional custom levels (up to 3)
Alerts for MA crosses and level crosses
Data Window metrics: RSI vs Fast/Slow MA differences
How to Use :
Monitor RSI behavior inside Cardwell’s bullish (40–80) and bearish (20–60) ranges
Watch RSI crossovers with Fast (9) and Slow (45) MAs to confirm momentum or trend shifts
Use levels and alerts as confluence with your trading strategy
Default Settings :
RSI Length: 14
MA Type: WMA
Fast MA: 9 (hidden by default)
Slow MA: 45 (hidden by default)
Cardwell Levels (80/60/40/20): ON
Base Bands (70/50/30): ON
Golden Cross Strategy & BacktesterGolden Cross Strategy & Backtester 📈🚀
Overview
This script provides a complete backtesting environment for the classic Golden Cross trend-following strategy. It is designed to be simple, visual, and easy to use. 💪
The strategy operates on the following logic:
🔼 Long Entry: A "Buy" signal is generated when the short-term moving average (Short MA) crosses above the long-term moving average (Long MA).
🔽 Exit: The position is closed when the short-term moving average crosses back below the long-term moving average (a "Death Cross").
The background of the chart will be shaded green 🎨 during periods when the strategy is holding an active position.
How to Use for Backtesting 🔬
This is a strategy script, which means its main purpose is to test the historical performance of this trading idea.
Add this script to your chart.
Open the "Strategy Tester" panel at the bottom of your chart.
In the "Overview" and "Performance" tabs, you can see detailed results 📊, such as the Net Profit and Max Drawdown, to evaluate the strategy's effectiveness.
Customization ⚙️
You can easily customize the strategy's parameters without editing the code.
Click the Settings/Gear icon (⚙️) next to the script's name on your chart.
In the "Inputs" tab, you can change:
📏 Short MA Length: The period for the fast-moving average (default is 50).
📏 Long MA Length: The period for the slow-moving average (default is 200).
In the "Properties" tab, you can change:
💰 Initial Capital: The starting balance for the backtest.
Feel free to test different settings to find what works best for your preferred asset and timeframe! Happy testing! 🎉
Trend TraderDescription and Usage of the "Trend Trader" Indicator
The "Trend Trader" indicator, created by Gerardo Mercado as a legacy project, is a versatile trading tool designed to identify potential buy and sell signals across various instruments. While it provides predefined settings for popular instruments like US30, NDX100, GER40, and GOLD, it can be seamlessly adapted to any market, including forex pairs like EUR/USD. The indicator combines moving averages, time-based filters, and MACD confirmation to enhance decision-making for traders.
How It Works
Custom Moving Averages (MAs):
The indicator uses two moving averages:
Short MA: A faster-moving average (default: 10 periods).
Long MA: A slower-moving average (default: 100 periods).
Buy signals are generated when the Short MA crosses above the Long MA.
Sell signals are triggered when the Short MA crosses below the Long MA.
Time-Based Signals:
The user can define specific trading session times (start and end in UTC) to focus on high-activity periods for their chosen market.
Signals and background coloring are only active during the allowed session times.
MACD Confirmation:
A MACD (Moving Average Convergence Divergence) calculation on a 15-minute timeframe ensures stronger confirmation for signals.
Buy signals require the MACD line to be above the signal line.
Sell signals require the MACD line to be at or below the signal line.
Target Levels:
Predefined profit targets are dynamically set based on the selected trading instrument.
While it includes settings for US30, NDX100, GER40, and GOLD, the target levels can be adjusted to fit the volatility and structure of any asset, including forex pairs like EUR/USD.
Target 1 and Target 2 levels display when these thresholds are met after an entry signal.
Adaptability to Any Market:
Although predefined options are included for specific instruments, the indicator's moving averages, time settings, and MACD logic are applicable to any tradable asset, making it suitable for forex, commodities, indices, and more.
Visual Alerts:
Labels appear on the chart to highlight "BUY" and "SELL" signals at crossover points.
Additional labels indicate when price movements reach the predefined target levels.
Bar and background coloring visually represent active signals and MACD alignment.
Purpose
The indicator aims to simplify trend-following and momentum-based trading strategies. By integrating moving averages, MACD, customizable time sessions, and dynamic targets, it offers clear entry and exit points while being adaptable to the needs of individual traders across diverse markets.
How to Use
Setup:
Add the indicator to your TradingView chart.
Configure the moving average periods, trading session times, and target levels according to your preferences.
Select the instrument for predefined target settings or customize them to fit the asset you’re trading (e.g., EUR/USD or other forex pairs).
Interpreting Signals:
Buy Signal: The Short MA crosses above the Long MA, MACD confirms the upward trend, and the session is active.
Sell Signal: The Short MA crosses below the Long MA, MACD confirms the downward trend, and the session is active.
Adapt for Any Instrument:
Adjust the predefined target levels to match the volatility and trading style for your chosen asset.
For forex pairs like EUR/USD, consider typical pip movements to set appropriate profit targets.
Targets:
Use the provided target labels (e.g., 50 or 100 points) or customize them to reflect realistic profit goals based on the asset’s volatility.
Visual Aids:
Pay attention to the background color:
Greenish: Indicates a bullish trend during the allowed session.
Redish: Indicates a bearish trend during the allowed session.
Use the "BUY" and "SELL" labels for actionable insights.
This indicator is a flexible and powerful tool, suitable for traders across all markets. Its adaptability ensures that it can enhance your strategy, whether you’re trading forex, commodities, indices, or other assets. By offering actionable alerts and customizable settings, the "Trend Trader" serves as a valuable addition to any trader’s toolkit. FX:EURUSD
NonLag MAThe Non-Lag Moving Average (MA) is a technical analysis indicator designed to track price trends with significantly less lag than traditional moving averages like the SMA or EMA.
Its primary purpose is to provide a smoother, more responsive representation of the current price direction. It achieves this by using a complex, adaptive filtering algorithm—often involving trigonometric functions (like the cosine function in the code you provided)—to assign weights to past price data. This sophisticated calculation allows it to stay closer to the price action, aiming to give earlier and more reliable trend signals.
Traders use the Non-Lag MA to:
Identify Trend Direction : The slope and color of the indicator line clearly signal whether the market is in an uptrend (rising) or a downtrend (falling).
Generate Crossover Signals : Like other moving averages, a faster Non-Lag MA crossing above a slower one can indicate a buy signal, while a cross below can signal a sell.
---
Just another publicly available indicator from MT5 translated.
Smooth BTCSPL [GiudiceQuantico] – Dual Smoothed MAsSmooth BTCSPL – Dual Smoothed MAs
What it measures
• % of Bitcoin addresses in profit vs loss (on-chain tickers).
• Spread = profit % − loss % → quick aggregate-sentiment gauge.
• Optional alpha-decay normalisation ⇒ keeps the curve on a 0-1 scale across cycles.
User inputs
• Use Alpha-Decay Adjusted Input (true/false).
• Fast MA – type (SMA / EMA / WMA / VWMA) & length (default 100).
• Slow MA – type & length (default 200).
• Colours – Bullish (#00ffbb) / Bearish (magenta).
Computation flow
1. Fetch daily on-chain series.
2. Build raw spread.
3. If alpha-decay enabled:
alpha = (rawSpread − 140-week rolling min) / (1 − rolling min).
4. Smooth chosen base with Fast & Slow MAs.
5. Bullish when Fast > Slow, bearish otherwise.
6. Bars tinted with the same bull/bear colour.
How to read
• Fast crosses above Slow → rising “addresses-in-profit” momentum → bullish bias.
• Fast crosses below Slow → stress / capitulation risk.
• Price-indicator divergences can flag exhaustion or hidden accumulation.
Tips
• Keep in a separate pane (overlay = false); bar-colouring still shows on price chart.
• Shorter lengths for swing trades, longer for macro outlook.
• Combine with funding rates, NUPL or simple price-MA crossovers for confirmation.
Canuck Trading IndicatorOverview
The Canuck Trading Indicator is a versatile, overlay-based technical analysis tool designed to assist traders in identifying potential trading opportunities across various timeframes and market conditions. By combining multiple technical indicators—such as RSI, Bollinger Bands, EMAs, VWAP, MACD, Stochastic RSI, ADX, HMA, and candlestick patterns—the indicator provides clear visual signals for bullish and bearish entries, breakouts, long-term trends, and options strategies like cash-secured puts, straddles/strangles, iron condors, and short squeezes. It also incorporates 20-day and 200-day SMAs to detect Golden/Death Crosses and price positioning relative to these moving averages. A dynamic table displays key metrics, and customizable alerts help traders stay informed of market conditions.
Key Features
Multi-Timeframe Adaptability: Automatically adjusts parameters (e.g., ATR multiplier, ADX period, HMA length) based on the chart's timeframe (minute, hourly, daily, weekly, monthly) for optimal performance.
Comprehensive Signal Generation: Identifies short-term entries, breakouts, long-term bullish trends, and options strategies using a combination of momentum, trend, volatility, and candlestick patterns.
Candlestick Pattern Detection: Recognizes bullish/bearish engulfing, hammer, shooting star, doji, and strong candles for precise entry/exit signals.
Moving Average Analysis: Plots 20-day and 200-day SMAs, detects Golden/Death Crosses, and evaluates price position relative to these averages.
Dynamic Table: Displays real-time metrics, including zone status (bullish, bearish, neutral), RSI, MACD, Stochastic RSI, short/long-term trends, candlestick patterns, ADX, ROC, VWAP slope, and MA positioning.
Customizable Alerts: Over 20 alert conditions for entries, exits, overbought/oversold warnings, and MA crosses, with actionable messages including ticker, price, and suggested strategies.
Visual Clarity: Uses distinct shapes, colors, and sizes to plot signals (e.g., green triangles for bullish entries, red triangles for bearish entries) and overlays key levels like EMA, VWAP, Bollinger Bands, support/resistance, and HMA.
Options Strategy Signals: Suggests opportunities for selling cash-secured puts, straddles/strangles, iron condors, and capitalizing on short squeezes.
How to Use
Add to Chart: Apply the indicator to any TradingView chart by selecting "Canuck Trading Indicator" from the Pine Script library.
Interpret Signals:
Bullish Signals: Green triangles (short-term entry), lime diamonds (breakout), blue circles (long-term entry).
Bearish Signals: Red triangles (short-term entry), maroon diamonds (breakout).
Options Strategies: Purple squares (cash-secured puts), yellow circles (straddles/strangles), orange crosses (iron condors), white arrows (short squeezes).
Exits: X-cross shapes in corresponding colors indicate exit signals.
Monitor: Gray circles suggest holding cash or monitoring for setups.
Review Table: Check the top-right table for real-time metrics, including zone status, RSI, MACD, trends, and MA positioning.
Set Alerts: Configure alerts for specific signals (e.g., "Short-Term Bullish Entry" or "Golden Cross") to receive notifications via TradingView.
Adjust Inputs: Customize input parameters (e.g., RSI period, EMA length, ATR period) to suit your trading style or market conditions.
Input Parameters
The indicator offers a wide range of customizable inputs to fine-tune its behavior:
RSI Period (default: 14): Length for RSI calculation.
RSI Bullish Low/High (default: 35/70): RSI thresholds for bullish signals.
RSI Bearish High (default: 65): RSI threshold for bearish signals.
EMA Period (default: 15): Main EMA length (15 for day trading, 50 for swing).
Short/Long EMA Length (default: 3/20): For momentum oscillator.
T3 Smoothing Length (default: 5): Smooths momentum signals.
Long-Term EMA/RSI Length (default: 20/15): For long-term trend analysis.
Support/Resistance Lookback (default: 5): Periods for support/resistance levels.
MACD Fast/Slow/Signal (default: 12/26/9): MACD parameters.
Bollinger Bands Period/StdDev (default: 15/2): BB settings.
Stochastic RSI Period/Smoothing (default: 14/3/3): Stochastic RSI settings.
Uptrend/Short-Term/Long-Term Lookback (default: 2/2/5): Candles for trend detection.
ATR Period (default: 14): For volatility and price targets.
VWAP Sensitivity (default: 0.1%): Threshold for VWAP-based signals.
Volume Oscillator Period (default: 14): For volume surge detection.
Pattern Detection Threshold (default: 0.3%): Sensitivity for candlestick patterns.
ROC Period (default: 3): Rate of change for momentum.
VWAP Slope Period (default: 5): For VWAP trend analysis.
TradingView Publishing Compliance
Originality: The Canuck Trading Indicator is an original script, combining multiple technical indicators and custom logic to provide unique trading signals. It does not replicate existing public scripts.
No Guaranteed Profits: This indicator is a tool for technical analysis and does not guarantee profits. Trading involves risks, and users should conduct their own research and risk management.
Clear Instructions: The description and usage guide are detailed and accessible, ensuring users understand how to apply the indicator effectively.
No External Dependencies: The script uses only built-in Pine Script functions (e.g., ta.rsi, ta.ema, ta.vwap) and requires no external libraries or data sources.
Performance: The script is optimized for performance, using efficient calculations and adaptive parameters to minimize lag on various timeframes.
Visual Clarity: Signals are plotted with distinct shapes and colors, and the table provides a concise summary of market conditions, enhancing usability.
Limitations and Risks
Market Conditions: The indicator may generate false signals in choppy or low-liquidity markets. Always confirm signals with additional analysis.
Timeframe Sensitivity: Performance varies by timeframe; test settings on your preferred chart (e.g., 5-minute for day trading, daily for swing trading).
Risk Management: Use stop-losses and position sizing to manage risk, as suggested in alert messages (e.g., "Stop -20%").
Options Trading: Options strategies (e.g., straddles, iron condors) carry unique risks; consult a financial advisor before trading.
Feedback and Support
For questions, suggestions, or bug reports, please leave a comment on the TradingView script page or contact the author via TradingView. Your feedback helps improve the indicator for the community.
Disclaimer
The Canuck Trading Indicator is provided for educational and informational purposes only. It is not financial advice. Trading involves significant risks, and past performance is not indicative of future results. Always perform your own due diligence and consult a qualified financial advisor before making trading decisions.
Multi-Indicator Signal with TableThis indicator is a versatile multi-indicator tool designed for traders who want to combine signals from various popular indicators into a single framework. It not only visualizes buy and sell signals but also provides a clear, easy-to-read table that summarizes the included indicators and their respective signal colors.
Key Features:
RSI (Relative Strength Index):
Buy Signal: RSI falls below the oversold level (default: 30).
Sell Signal: RSI rises above the overbought level (default: 70).
Signal Color: Green.
MACD (Moving Average Convergence Divergence):
Buy Signal: MACD line crosses above the signal line.
Sell Signal: MACD line crosses below the signal line.
Signal Color: Blue.
MA Crossover (Moving Average Crossover):
Buy Signal: Short EMA (default: 7) crosses above Long SMA (default: 14).
Sell Signal: Short EMA crosses below Long SMA.
Signal Color: Purple.
Stochastic Oscillator:
Buy Signal: Stochastic %K falls below 20 and crosses above %D.
Sell Signal: Stochastic %K rises above 80 and crosses below %D.
Signal Color: Yellow.
TSI (True Strength Index):
Buy Signal: TSI crosses above the zero line.
Sell Signal: TSI crosses below the zero line.
Signal Color: Red.
Dynamic Signal Table:
A clean, compact table displayed at the top-right corner of the chart, summarizing the indicators and their respective signal colors for quick reference.
Customization:
All indicator parameters are fully adjustable, allowing users to fine-tune settings to match their trading strategy.
Signal colors and table design ensure a visually intuitive experience.
Usage:
This tool is ideal for traders who prefer a multi-indicator approach for generating buy/sell signals.
The combination of different indicators helps to filter out noise and increase the accuracy of trade setups.
Notes:
Signals appear only after the confirmation of the current bar to avoid false triggers.
This indicator is designed for educational purposes and should be used in conjunction with proper risk management strategies.
Detrended Price Oscillator [NexusSignals]Detrended Price Oscillator (DPO) is a detrended price oscillator, used in technical analysis, strips out price trends in an effort to estimate the length of price cycles from peak to peak or trough to trough.
DPO is not a momentum indicator, instead highlights peaks and troughs in price, which are used to estimate buy and sell points in line with the historical cycle. (cf. to investopedia)
DPO indicator made by NexusSignals components :
a filled area that allow users to see easy the trend of an asset;
a sma moving average on chart (default length is 20)
a 20 sma on oscillator, both ma's are color coded to show uptrend / downtrend
a donchian channel applied to the dpo to show breakouts, breakdowns and resistances/support, reversals
few alerts for price crossing above ma, cross above the 0 dpo line, and for cross above and below the donchian channels top and bottom
How you can use DPO indicator ?
The detrended price oscillator (DPO) can be used for measuring the distance between peaks and troughs in the indicator that may help traders to make future decisions as they can locate the most recent trough and determine when the next one may occur in the meassured distance on oscillator between peaks and troughs.
You can use the indicator to find the potential price reversals, for example when the price of an asset is in a bearish trend and the dpo is bouncing from the donchian channel bottom, that may be a potential swing low for that asset, same thing in a bullish trend when the dpo rejecting at top of donchian channel may be a trend reversal, a pullback or swing high.
When DPO is above the 0 trend is in an uptrend and when dpo is below the zero the asset is possible to move into a downtrend.
Also crosses of DPO above and below the DPO moving average may signalising a trend change.
AndreundCristianIndicator Overview:
The "Trade Signals with Volume" indicator is a custom script that generates buy and sell signals based on the crossover of two moving averages (a fast one and a slow one) and adds a volume filter to validate these signals. It plots these signals directly on the chart, using arrows or labels to indicate where buy and sell signals occur.
Key Features:
Moving Averages (MA):
The indicator uses two Simple Moving Averages (SMA): a fast SMA and a slow SMA.
A buy signal is triggered when the fast MA crosses above the slow MA, signaling potential bullish momentum.
A sell signal is triggered when the fast MA crosses below the slow MA, indicating potential bearish momentum.
Volume Filter:
To ensure that signals are more reliable, the indicator only triggers a buy or sell signal if the volume is above a certain threshold. This threshold can be adjusted by the user in the input settings.
For example, if the volume exceeds 100,000 (or any set value), and a crossover occurs, the signal is validated.
Visual Representation:
Buy signals are represented with green labels or arrows below the price bars.
Sell signals are represented with red labels or arrows above the price bars.
The MAs are also plotted on the chart for visual reference.
Input Parameters:
Fast Moving Average Length: The number of periods for the fast SMA (default is 9 periods).
Slow Moving Average Length: The number of periods for the slow SMA (default is 21 periods).
Volume Threshold: The minimum volume required to validate a buy or sell signal (default is 100,000).
Moving Average Cross Probability [AlgoAlpha]Moving Average Cross Probability 📈✨
The Moving Average Cross Probability by AlgoAlpha calculates the probability of a cross-over or cross-under between the fast and slow values of a user defined Moving Average type before it happens, allowing users to benefit by front running the market.
✨ Key Features:
📊 Probability Histogram: Displays the Probability of MA cross in the form of a histogram.
🔄 Data Table: Displays forecast information for quick analysis.
🎨 Customizable MAs: Choose from various moving averages and customize their length.
🚀 How to Use:
🛠 Add Indicator: Add the indicator to favorites, and customize the settings to suite your trading style.
📊 Analyze Market: Watch the indicator to look for trend shifts early or for trend continuations.
🔔 Set Alerts: Get notified of bullish/bearish points.
✨ How It Works:
The Moving Average Cross Probability Indicator by AlgoAlpha determines the probability by looking at a probable range of values that the price can take in the next bar and finds out what percentage of those possibilities result in the user defined moving average crossing each other. This is done by first using the HMA to predict what the next price value will be, a standard deviation based range is then calculated. The range is divided by the user defined resolution and is split into multiple levels, each of these levels represent a possible value for price in the next bar. These possible predicted values are used to calculate the possible MA values for both the fast and slow MAs that may occur in the next bar and are then compared to see how many of those possible MA results end up crossing each other.
Stay ahead of the market with the Moving Average Cross Probability Indicator AlgoAlpha! 📈💡
X48 - Strategy | MA Type Cross + TPSL | Future&Spot | V.2Thank You For Open Source Code, This Strategy Ref. By 1.Simple Strategy Like MA Crossover For Long/Short or Spot Trade, 2. CDC Action Zone V.2 for BarPaint
This Strategy Mixing With MA Crossover Strategy and BarPaint By CDC Action Zone and TP/SL by Varbara
### How To Use Strategy : Setting EMA/SMA Crossover EMA/SMA, Any Value If You Want
For Long Position : Cross Up
For Short Position : Cross Down
Can Use With Spot Trade : Cross Up = Buy, Cross Down = Sell
TP/SL When Your OrderSize Change From any % Of Your TP/SL Value
### In Strategy Setting
Intitial Capital = Ex. 200
Order Size = Should Be Money Management Not Use 100% of Capital Ex. 10% of Capital (200$) = Order Size 20$
StopLoss and Take Profit = If You Run Trend TF 4H+ or 1D+ You Can Change TP% = 1,000% for nonlimit and Stop Loss 5 - 20% from your order size
Ex. Stoploss 15% = OrderSize / 100 x %SL = 20$/100 x 15% = 3$ Loss from order size 20$ (if you not set stop loss.)
Base Currency = (Your Currency) # Ex. USD
Commission = (Your Trading Fee) # Ex. Future Fee Can Check At Binance Fee Rate > www.binance.com > Choose Your Fee Type, Ex. USD M Future (Regular User) = 0.02 (Maker), 0.04 (Taker)
Commission Symbol Type = % # (Ref. By Binance Fee Rate)
### Notice ####
Default Setting It's Realistic From Normal Life Ex. Capital 200$ / Ordersize 20$ (10%)/ Commission 0.1% (Buy+Sell) / Slippage = 2 / TP = 1000% (nonlimit) / SL = 15%/OrderSize
Low Risk But High Return, Good Luck
### Bot Auto Trade by X4815162342 ###
if you wanna try my bot auto trade X48-3in1-bot : Contact My Line ID : x4815x
Full Command Alert For This Strategy If You Wanna See It's
'{"ex":"'+markettype+'","side": "'+longcommand+'", "amount": "@{{strategy.order.contracts}}", "symbol": "{{ticker}}", "passphrase": "'+passphrase+'","leverage":"'+str.tostring(leveragex)+'"}'
'{"ex":"'+markettype+'","side": "'+shortcommand+'", "amount": "@{{strategy.order.contracts}}", "symbol": "{{ticker}}", "passphrase": "'+passphrase+'","leverage":"'+str.tostring(leveragex)+'"}'
But Easy Than Full Command Just Use Thisssssss !! Strategy Be Manage Auto Long and Short or TPSL Position
You Don't Do Anything Just Use This Message to Alerts Message
{{strategy.order.alert_message}}
### If you don't use bot but just looking for strategy test ####
Just Pass Bot Setting Function It's Nothing Effect For Strategy !!!!!!
Let's Enjoy With Your Strategy BackTest 😁
Remember Beware Max drawdown%. I'm Recommend Lower Than 10% It's Very Good.
KAMIKAMI EMA RIBBONGood evening plebians, This IS Cryptofilio, Your dark knight in the Crypto lightness.... Introducing yet another nebulous indicator... It's the KAMI, KAMI (GODS in Japanese) EMA ribbon.....
This indicator uses 3 primary lengths of EMA labeled as Short, Medium, and Long. They change colors in relation to each other and in relation to the current price of the security.
This indicator is more sophisticated than a simple MA cross strategy as you can use a wider variety of signals for entering earlier and exiting earlier, thus getting into a trade early in the run-up and getting out before the run-down. The EMA is identifiable by the color, lighter green and red representing lower lookbacks. When the OHLC4 crosses the ema it changes color. Thus if all colors are red, then the security is trading below all EMA's - a strong sell or short signal.
GREEN inside of RED indicates an uptrend within a larger downtrend... and of course, the inverse is also true.
The triangles which indicate a cross, are color-coded according to their significance by transparency - the less transparent the more important or significant the cross.
In addition, there are bull and bear bounce indicators (the arrows) that predict a bounce up or down from the security meeting a point along the EMA line and reacting.
VARIATIONS: To use this for scalping I suggest 5,8,13
Two Moving Average CrossChoose two completely different moving averages and determine crossover points. Feel free to copy and paste the code into any strategy using MA crosses in order to optimize backtesting.
Arch1tect's New ToyDescription:
Arch1tect's New Toy tries to predict market trends by simply utilising 2 moving averages crossovers.
How it works:
Buy signals are triggered when the faster MA crosses over the slower MA from the downside to the upside.
Sell signals are triggered when the faster MA crosses under the slower MA from the upside to the downside.
How to use:
Take buys when buy signal is triggered AND close existing sell position
Take sells when sell signal is triggered AND close existing buy position
Note:
Settings are optimised for XAUUSD on the M1 chart.
Extra:
Alerts are included.
You can toggle between EMA , WMA and SMA to your liking.
Strategy Tester version: