oenbot BB Buying OpportunitiesThis is my first attempt to emulate the eonbot BB strategy (github.com).
Definitely a beta version, need to work out why false positives, and stop buy/sells after previous buy/sell.
In the wiki page example of eonbot it refers to 75%, in this script enter the converse ... 25% and it should plot accurately.
If you are not familiar with eonbot check out the wiki & github sites : github.com
credits to: www.tradingview.com for the trending components
在脚本中搜索"N+credit最新动态"

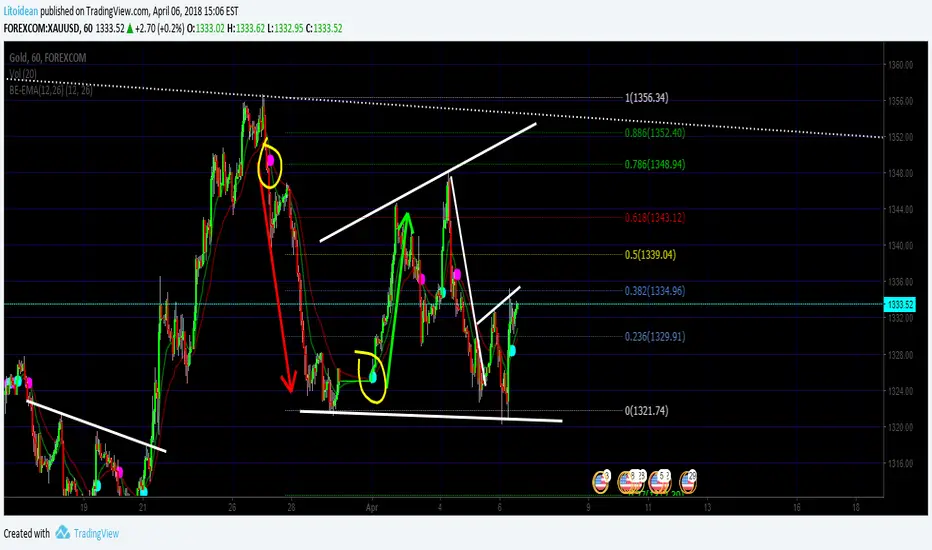
BE-EMA(12,26) (Blue Empire Exponential Moving Average)
Simple EMA where you get a CROSS mark between EMA 12 and EMA 26.
Each time a cross happens, a spot gets created.
If it's cyan, it goes up.
If it's magenta, it goes down.
I'm studying Trading at Blue Empire Academy, if you want to know more send me a PM.
Wave Analysis study the wave's behavior and tries to predict by using trendlines, elliot waves, fibonacci retracements, and EMAs basically.
In this Indicator, It's a confirmation when EMA 12 goes over to confirm the price may go up. and Vice versa.
Hope you like, please share if you think it's useful and comment if you think this can be better.
Thank you again for reading
>> This is just an indicator, it doesn't predict the future. Use it at your own risk. <<
##########
All the credits to @tracks, a genius who helped me polish the code. :] thank you.
RSI / Stoch / Stoch RSI (SRSI) Overlay [SigmaDraconis]One indicator combining RSI, Stochastic Oscillator and Stochastic RSI in one.
Credits for rwhiteside and his RSI / Stoch RSI Overlay indicator who served as inspiration to all three.
I believe this will be very useful to a lot of people.
If you like, use and i prove to be , you can contribute to my
TIP JAR :

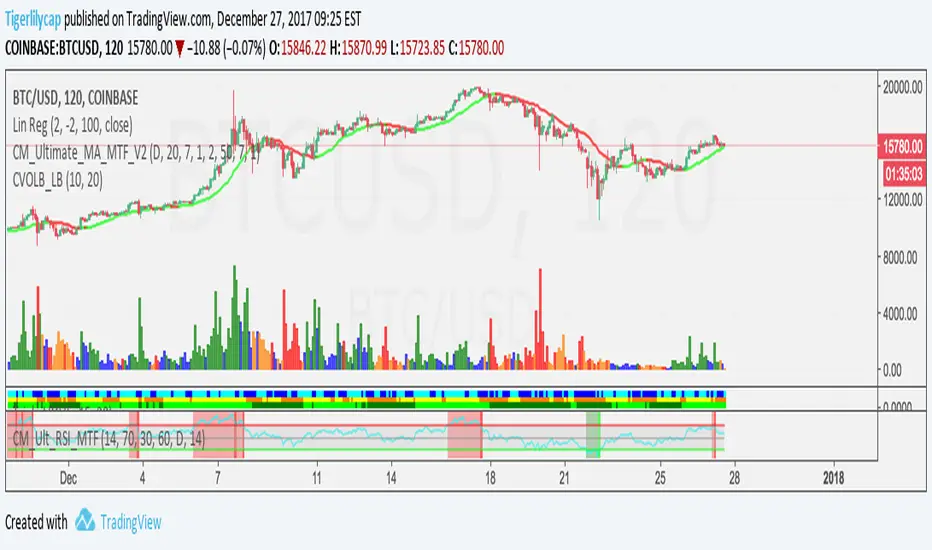
Colored Volume Bars [LazyBear] with overlayDivs and candle alignment a little easier to see - volume/2 to size correctly - could still use some refining
All credits to LazyBear for his color volume bar source code
SiL Ghanti by BHAJANPREETSiL ALERT by Bhajanpreet
fully working
credits - Arnab from Kolkata for introducing and helping me with this project!! :)

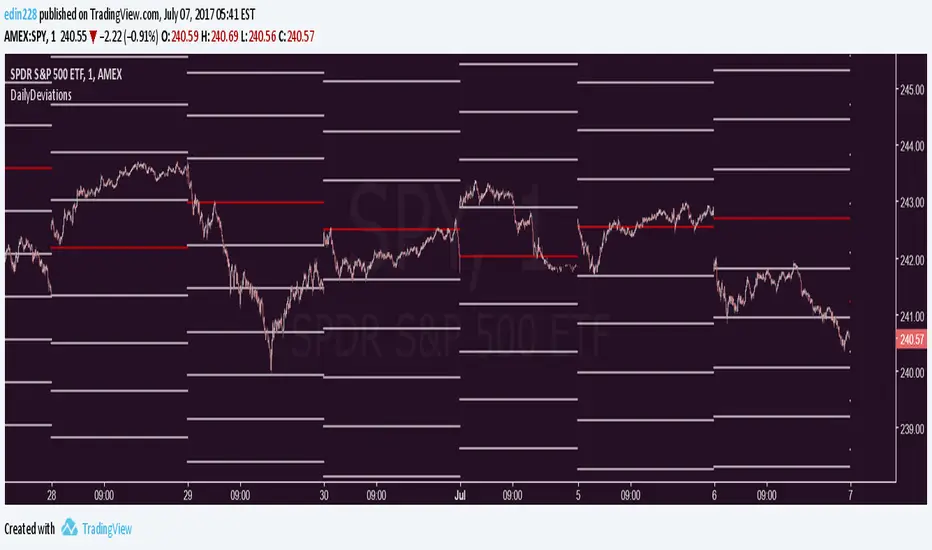
Daily Deviations Version 3Version 3 of Daily Deviations
Combines Lazy and Self Input version
HOW TO USE:
Select volatility index related to ticker. (Ex. Using SPY? Select VIX. Using QQQ? Select VXN. etc)
OR
Uncheck other volatility options and select "Use Custom Volatility" and input your own volatility.
Default setting is to use the previous close price as the "0 Level".
OR
Uncheck "Use Close Price" to enable a synthetic settlement price that is made by using the average of the daily open and close.
OR
Uncheck "Use Close Price" and select "Use Custom Settlement" and input your own settlement price.
Mess around and find the settings that you like the most.
Credits to /u/Living_Granger and /u/UberBotMan for the formulas and idea.
FuturesVsSpotShows the difference between Futures and Spot.
- Credits go to Josh Olszewicz / someone in whaleclub ts

Ehlers Optimal Tracking FilterThe original script was posted on ProRealCode by user Nicolas.
Dr. R.E. Kalman introduced his concept of optimum estimation in 1960. Since that time, his technique has proven to be a powerful and practical tool. The approach is particularly well suited for optimizing the performance of modern terrestrial and space navigation systems. Many traders not directly involved in system analysis have heard about Kalman filtering and have expressed an interest in learning more about it for market applications. Although attempts have been made to provide simple, intuitive explanations, none has been completely successful. Almost without exception, descriptions have become mired in the jargon and state-space notation of the “cult”.
Surprisingly, in spite of the obscure-looking mathematics (the most impenetrable of which can be found in Dr. Kalman’s original paper), Kalman filtering is a fairly direct and simple concept. In the spirit of being pragmatic, we will not deal with the full-blown matrix equations in this description and we will be less than rigorous in the application to trading. Rigorous application requires knowledge of the probability distributions of the statistics. Nonetheless we end with practically useful results. We will depart from the classical approach by working backwards from Exponential Moving Averages. In this process, we introduce a way to create a nearly zero lag moving average. From there, we will use the concept of a Tracking Index that optimizes the filter tracking for the given uncertainty in price movement and the uncertainty in our ability to measure it.
Credits to: www.prorealcode.com

Waddah Attar Explosion by ShizaruThe original script was posted on ProRealCode by user Nicolas.
The Waddah Attar explosion indicator is a well known indi in the forex community all over the web. It measures the price volatility "explosion" with the help of a difference between upper and lower bollinger bands (also known as "squeeze") and its direction and with a slow MACD advance or decline weighted with a coefficient (sensitivity=150).
A "deadzone" of x pips/points is at 20 points by default, but should be adjusted to the traded instrument.
If green or red oscillator histogram breach the "Explosion Line" above the dead zone, it's a signal.
This indicator act pretty much as a scalper in lower timeframe, but I found it useful with different timeframe comparison in higher ones in the past (M30/H1/H4).
Credits to www.prorealcode.com

Butterworth Filter by ShizaruThe original script was posted on ProRealCode by user StefanoCG.
Butterworth Filter (called also "maximally flat") is one of the simplest electronic filter. Its purpose is to obtain a frequency response of the flat as possible in the passband. Applied to the retail price index aims to filter out the "noise" and give you an indication on the direction of the more readable price.
Credits to: www.prorealcode.com

DSS Bresser Scalper Improved by ShizaruThe original script was posted on ProRealCode by user Nicolas.
This indicator is derived from Bressert's works in market cycles (Double Smooth Stochastic). It is converted from MT4 code and it is a part of a complete trading strategy of scalping, I certainly post on forums soon.
The DSS indicator is intended to spot overbought and oversold areas with less false signals than any other stochastic indicator. When the oscillator remains longer into one of the area, it is the beginning of a trend change.
I found it useful to spot price rebound while in a already formed trend. Of course, because stochastic is most used to find price reversal over a calculated price center, this indicator can also be nicely used in ranging markets.
Credits to: www.prorealcode.com

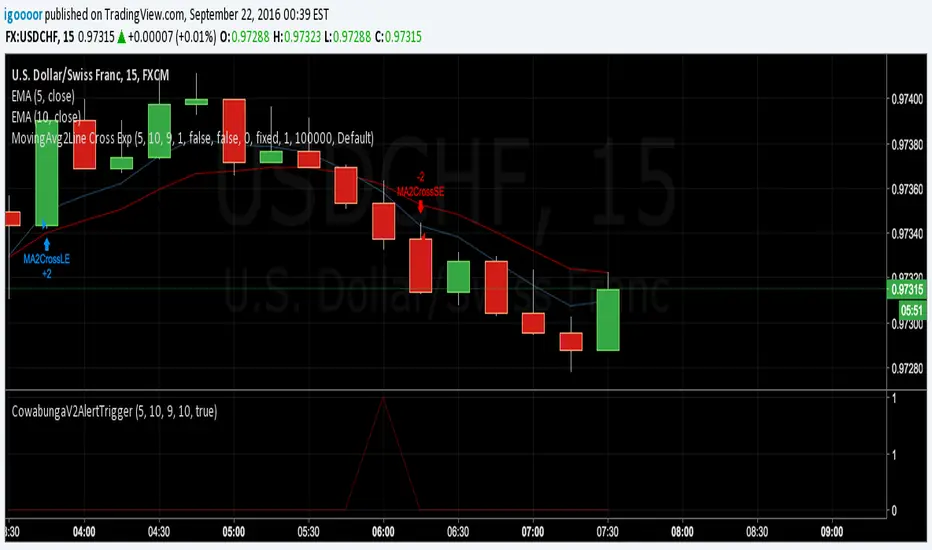
Cowabunga V2 Alert TriggerRefer to forums.babypips.com
This is the converison from mql4 files, credits goes to original poster.
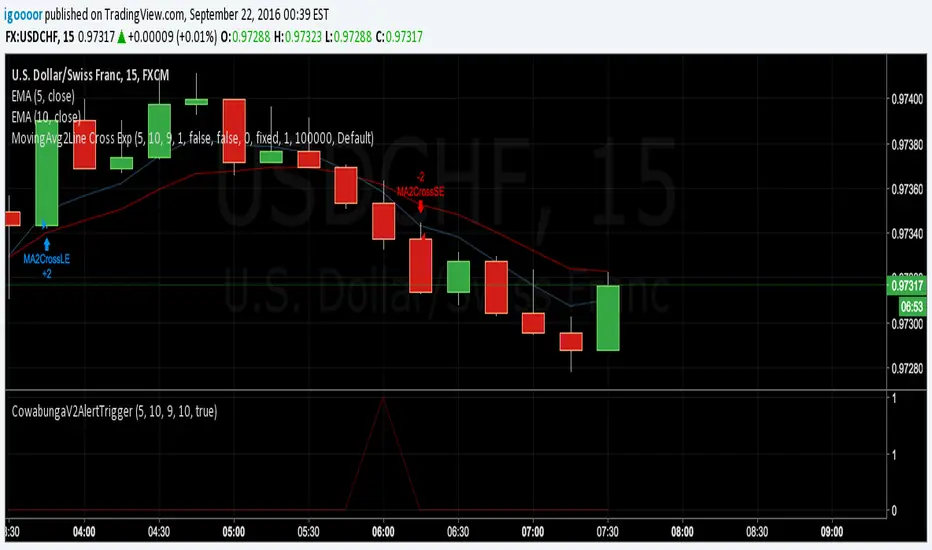
Cowabunga V2 Alert TriggerRefer to forums.babypips.com
This is the translation from mql4 files, credits goes to original poster
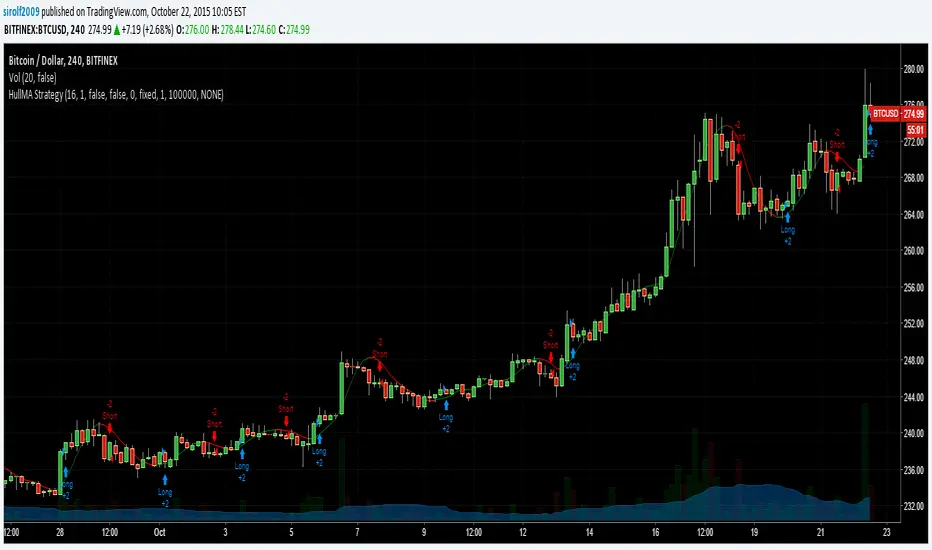
HullMA StrategyA Hull Moving Average strategy. I simply copied the code from mohamed982 and wrapped it in strategy code. All credits go to him not me.
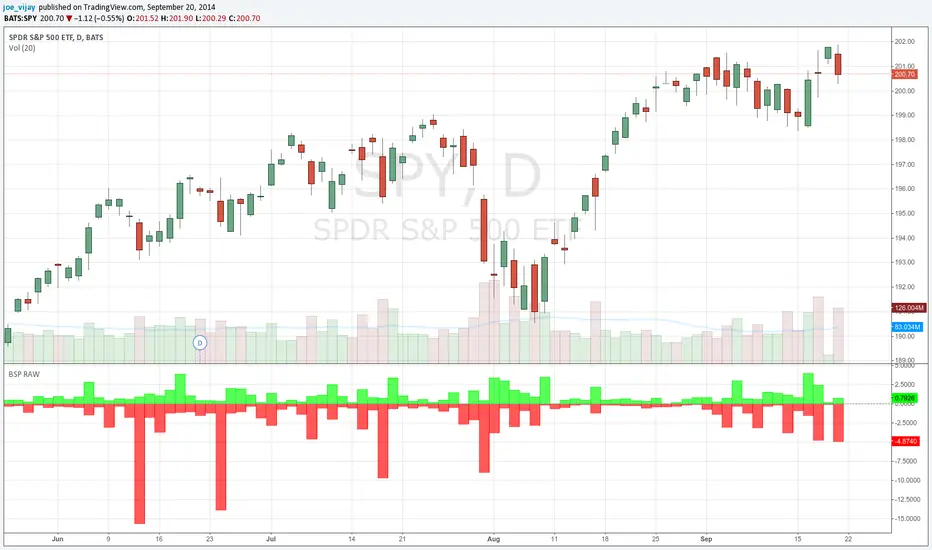
Smoothed Balance of PowerSmoothed BOP to try and find dark pool activity. Only works in charts with working volume!
Credits go to LazyBear for some coding on the plotting and Igor Livshin for the formula.

UCS Squeeze BarThis indicator is a request from tvmember jackvmk. Credits to jackvmk.
Squeeze bar = a bar which encompasses 5, 10, 15, 20, 30, 40 SMA
Squeeze bars high and lows are support and resistance. when price break one of them, this direction is direction of explosion.
I have added a further more customization
1. Using EMA instead of SMA
2. Using Heikin Ashi Optimization
3. Using Realbody (ignore wicks)
4. Plot the MA Ribbon

[Bitcoin] Spot price vs Futures indicatorA handy script to detect opportunities in the futures market during extreme movement.
During rallies, futures usually tend to be US$10 above spot price, on the other hand it can be $1 below spot price when the price starts to decline.
You could also draw a trendline to it :) measuring the amount of risk people are willing to take just to predict future prices in the rally/decline.
Credits to lowstrife for the idea, I'm just implementing it :)

Buy/Sell Pressure Raw// This is a port of the bar by bar Buy/Sell pressure indicator by Karthik Marar.
// See below link for further details.
// karthikmarar.blogspot.com
// The only difference being I used the Hull moving average instead of WMA which the HullMA is a derivative of.
// Credits to Chris Moody for the HullMA code.
// All disclaimers apply
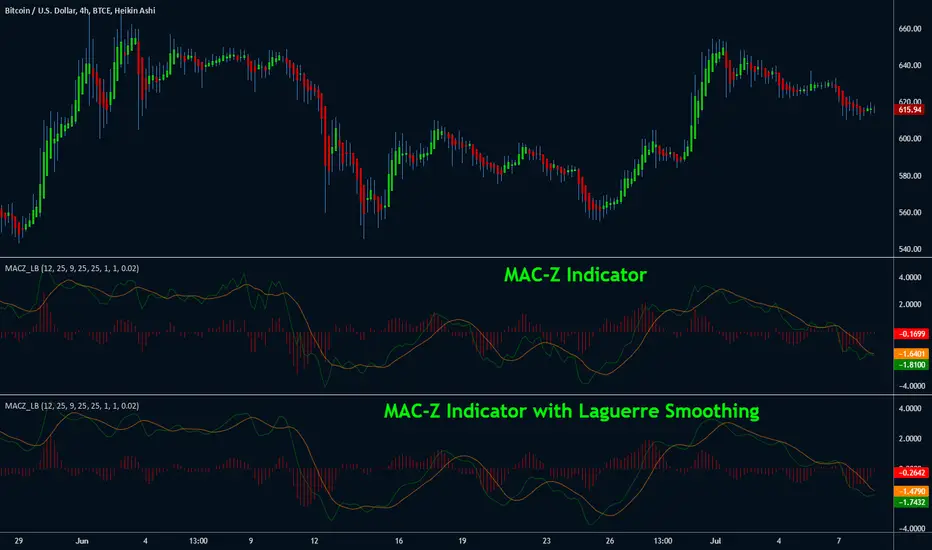
MAC-Z Indicator [LazyBear]This indicator is a composite of MACD and Z-Score (requested by @ChartAt). The general idea is that counter-trend component of the Z-score is used to adjust/improve the trend component of the MACD. The advantage is that it is a more accurate and “assumption-free” and can more accurately describe how a market or stock actually works in a given time frame.
I have also added support to smooth out the MAC-Z using Laguerre filter (Thanks @TheLark for the excellent LMA). Note that smoothing removes the "noise" component additive of Z-Score, so you may miss some good signals. By default Laguerre smoothing is OFF, I suggest playing with the Gamma to see if you can find a proper trade-off value.
Theme credits --> @liw0
More info:
cssanalytics.wordpress.com
RSI SMA lionsFX:EURUSD Strategy with basic indicators
I must thank and credit MrCat206 for this strategy
www.youtube.com
You can see his strategy explained at this URL

Relative Performance Indicator - TrendSpider StyleRelative Performance Indicator - TrendSpider Style
📈 Overview
This Relative Performance (RP) indicator measures how your stock is performing compared to a benchmark index, displayed as a percentile ranking from 0-100. Based on TrendSpider's methodology, it answers the critical question: "Is this stock a leader or a laggard?"
Unlike simple ratio charts, this indicator uses percentile ranking to normalize relative performance, making it easy to identify when a stock is showing exceptional strength (>80) or concerning weakness (<20) compared to its historical relationship with the benchmark.
✨ Key Features
Three Calculation Modes:
Quarterly: 3-month relative performance for swing trading
Yearly: Weighted 4-quarter performance for position trading
TechRank: Composite of 6 technical indicators for multi-factor analysis
Clean Visual Design:
Green fills above 80 (strong outperformance)
Red fills below 20 (significant underperformance)
Dotted median line at 50 for quick reference
Current value label for instant reading
Flexible Benchmarks:
Compare against major indices (SPY, QQQ, IWM)
Sector ETFs for within-sector analysis
Custom symbols for specialized comparisons
Built-in Alerts:
Strong performance zone entry (>80)
Weak performance zone entry (<20)
Median crossovers (50 level)
📊 How To Use
Buy Signals:
RP crosses above 80: Stock entering leadership status
RP holding above 60: Maintaining relative strength
RP rising while price consolidating: Accumulation phase
Sell/Avoid Signals:
RP drops below 50: Losing relative strength
RP below 20: Significant underperformance
RP falling while price rising: Bearish divergence
Sector Rotation:
Compare multiple assets to find strongest sectors
Rotate into high RP assets (>70)
Exit low RP positions (<30)
🎯 Reading The Values
80-100: Exceptional outperformance - Strong buy/hold
60-80: Moderate outperformance - Hold positions
40-60: Market perform - No edge
20-40: Underperformance - Caution/reduce
0-20: Severe underperformance - Avoid/exit
⚙️ Calculation Method
Calculates percentage performance of both your stock and the benchmark
Finds the performance differential
Ranks this differential against historical values using percentile analysis
Normalizes to 0-100 scale for easy interpretation
This percentile approach adapts to different market conditions and volatility regimes, providing consistent signals whether in trending or choppy markets.
💡 Pro Tips
For Growth Stocks: Use quarterly mode with QQQ as benchmark
For Value Stocks: Use yearly mode with SPY as benchmark
For Small Caps: Compare against IWM, not SPY
For Sector Analysis: Use sector ETFs (XLK, XLF, XLE, etc.)
Combine with Price Action: High RP + price breakout = powerful signal
⚠️ Important Notes
RP is relative, not absolute - stocks can fall with high RP if the market falls harder
Choose appropriate benchmarks for meaningful comparisons
Best used in conjunction with price action and volume analysis
Historical lookback period affects sensitivity (adjustable in settings)
🔧 Customization
Fully customizable visual settings, thresholds, calculation periods, and smoothing options. Adjust the normalization lookback period (default 252 days) to fine-tune sensitivity to your trading timeframe.
📌 Credit
Inspired by TrendSpider's Relative Performance implementation, adapted for TradingView with enhanced customization options and Pine Script v6 optimization.
Tags to include: relativeperformance, relativestrength, percentile, ranking, sectorrotation, benchmark, outperformance, trendspider, marketbreadth, strengthindicator
Category: Momentum Indicators / Trend Analysis
Feel free to modify this description to match your style or add any specific points you want to emphasize!

CVD Divergences (cdikici71 x tncylyv)CVD Divergence
Summary
This indicator brings the powerful and creative divergence detection logic from @cdikici71's popular "cd_RSI_Divergence_Cx" script to the world of volume analysis.
While RSI is a fantastic momentum tool, I personally choose to rely on volume as a primary source of truth. This script was born from the desire to see how true buying and selling pressure—measured by Cumulative Volume Delta (CVD)—diverges from price action. It takes the brilliant engine built by @cdikici71 and applies it to CVD, offering a unique look into market conviction.
What is Cumulative Volume Delta (CVD)?
CVD is a running total of volume that transacted at the ask price (buying) minus volume that transacted at the bid price (selling). In simple terms, it shows whether buyers or sellers have been more aggressive over a period. A rising CVD suggests net buying pressure, while a falling CVD suggests net selling pressure.
Core Features
• Divergence Engine by @cdikici71: The script uses the exact same two powerful methods for finding divergences as the original RSI version:
o Alignment with HTF Sweep: The default, cleaner method for finding high-probability divergences.
o All: A more sensitive method that finds all possible divergences.
• Anchored CVD Periods: You can choose to reset the CVD calculation on a Daily, Weekly, or Monthly basis to analyze buying and selling pressure within specific periods. Or, you can leave it on Continuous to see the all-time flow.
• Automatic Higher Timeframe (HTF) Alignment: To remove the guesswork, the "Auto-Align HTF" option will automatically select a logical higher timeframe for divergence analysis based on your current chart (e.g., 15m chart uses 4H for divergence, 1H chart uses 1D, etc.). You can also turn this off for full manual control.
• Fully Customizable Information Table: An on-screen table keeps you updated on the divergence status. You can easily adjust its Position and Size in the settings to fit your chart layout.
• Built-in Alerts: Alerts are configured for both Bullish and Bearish divergences to notify you as soon as they occur.
How to Use This Indicator
The principle is the same as any divergence strategy, but with the conviction of volume behind it.
• 🔴 Bearish Divergence: Price makes a Higher High, but the CVD makes a Lower High or an equal high. This suggests that the buying pressure is weakening and may not be strong enough to support the new price high.
• 🟢 Bullish Divergence: Price makes a Lower Low, but the CVD makes a Higher Low or an equal low. This suggests that selling pressure is exhausting and the market may be ready for a reversal.
Always use divergence signals as a confluence with your own analysis, support/resistance levels, and market structure.
Huge Thanks and Credit
This script would not exist without the brilliant and creative work of @cdikici71. The entire divergence detection engine, the visualization style, and the core logic are based on his original masterpiece, "cd_RSI_Divergence_Cx". I have simply adapted his framework to a different data source.
If you find this indicator useful, please go and show your support for his original work!
________________________________________
Disclaimer: This is a tool for analysis, not a financial advice signal service. Please use it responsibly as part of a complete trading strategy.

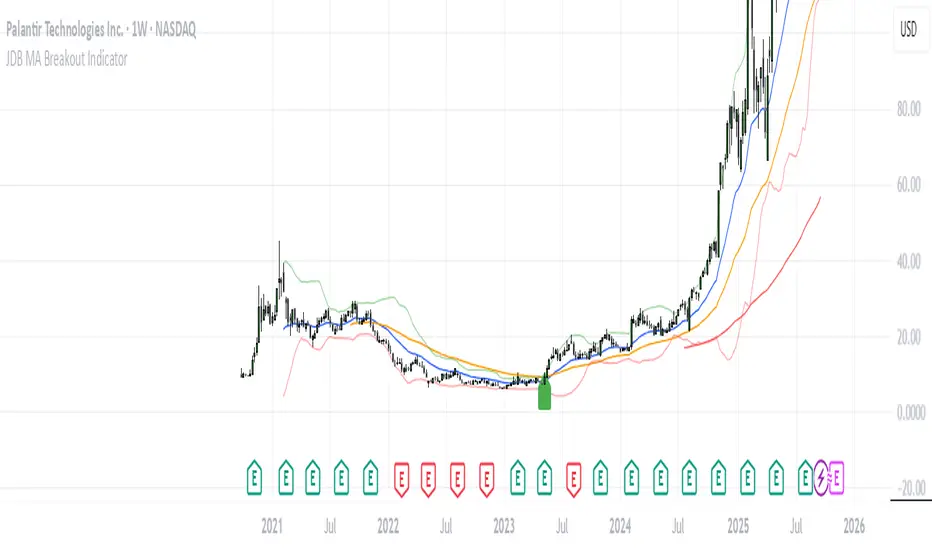
JDB MA Breakout IndicatorAll credit goes to JDB_Trading . Follow on X.
This indicator visualises one of his strategies.
1. Detecting the dominant moving average.
2. Price is supposed to be at least 70 candles below it for buy signals/40 above for sells.
3. detects break on dominant MA + BB 20,2.
4. Used on W & M timeframes.
5. alerts possible.