Multi-Timeframe Squeeze Pro/DIM/Momentum/MAIMPORTANT NOTE:
-> The table will not display any timeframes lower than the current one
-> This indicator combine multiple popular indicators and give ability to use them on Multiple timeframes (MFT)
-> Indicators used for the MFT are: Squeeze / Momentum / 10X DIM and Stacked MA (or EMA)
-> Give at glance a good way to see the trend all different timeframes
-> If you are using in combination with squeeze pro please use the one from @Beardy_Fred since it matches the colours and condition used
Credits :
-> J. Welles Wilder creating the Directional Movement System (DMS) (1978); and
-> John Carter applying the DMS to create the popular Simpler Trading 10X Bars indicator.
-> @Beardy_Fred creating a first version including MOM and SQZ
-> Makit0's evolution of Lazybear's script to factor in the TTM Squeeze Pro upgrades - Squeeze PRO Arrows
I have adapted the version from @Beardy_Fred to provide a more complete and customisable indicator while including also the Stacked EMA/MA for further validation
Explanation:
You can learn more about each indicators following those links:
Squeeze Pro:
10X:
Momentum Histogram:
The stacked EMA/MA highlights when the MA/EMA are in order:
Red when they are stacked from the highest to the lowest
Green when they are stacked from the lowest to the highest
Yellow when they are stacked without a clear order
Customisation:
You can customise:
Timeframes
Settings for each indicators (10X/MA/Momentum/Squeeze)
Colors
Visibility
Trade Signals:
If you are going Long, Since this is a combination ideally on the timeframe you are trading you should have all green + green on the above timeframes (those colors are the default ones but can be changed)
-> Green on 10X indicator meaning you are in an uptrend
-> EMA or MA (depending on the configuration of the indicator) Green meaning EMA or MA
-> Squeeze should be Orange or Red ideally (indicating an high or medium Squeeze)
-> Momentum should be Cyan indicating an increase in momentum (while Dark Blue could indicate a reversal)
Standalone indicators:
- Squeeze Pro
- 10X Bar
- Stacked MA
- Momentum
在脚本中搜索"N+credit最新动态"

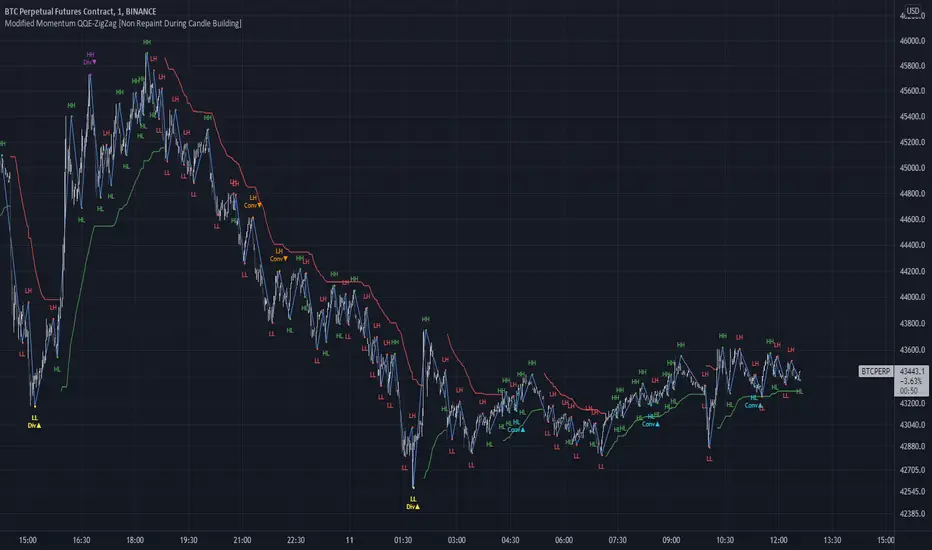
Modified QQE-ZigZag [Non Repaint During Candle Building]V V V V V V V Please Read V V V V V V V
I ask Peter and he is fine, that im published this script
Tell me if you have some ideas or criticism about that sricpt
>>>>>>>>>> This is a modified Version of Peter_O's Momentum Based ZigZag <<<<<<<<<<<
This is only a test, and i want to share it with the community
It works like other ZigZags
Because Peters_O's original Version is only non repaint on closed historical Data ,
during a Candle building process it can still repaint (signal appears / 21 seconds later signal disapears / 42 seconds later signal appears again in the same candle / etc.),
but that isnt important for backtesting, its only important for realtime PivotPoints during a candle.
My goal for this zigzag was to make it absolute non repaint neither during a candle building process (current candle),
so once the signal is shown there is no chance that it disapers and shown a few seconds later again on that same candle, it can only show up one time per candle an thats it,
and that makes it absolute non repaint in all time frames.
Credits to:
==> Thanks to @glaz , for bringing the QQE to Tradingview <3
==> Thanks to @Peter_O , for sharing his idea to use the QQE as base for a Zigzag
and for sharing his MTF RSI with the Community <3
Changes:
- I changed the MTF RSI a little bit, you can choose between two version
- I changed the QQE a little bit, its now using the MTF RSI , and its using High and Low values as Source to make it absolute non repaint during a candle is building
- I added a little Divergence Calculation beween price and the MTF RSI that is used for the ZigZag
Colors :
- Green for HH / HL Continuation
- Red for LL / LH Continuation
- Yellow for Positive Divergence
- Purple for Negative Divergence
Important:
It is not possible to backtest this script correctly with historical Data, its only possible in Realtime,
because the QQE is using crossunders with RSILowSource and the QQE Line to find the Tops and,
because the QQE is using crossovers with RSIHighSource and the QQE Line to find the Bottoms,
and that means it is not possible to find the correct Time/Moment when that crossovers / crossunders happens in historical Data
=============> So please be sure you understand the Calculation and Backtest it in Realtime when you want to use it,
because i didn't published this script for real trading
=============> Im not a financial advisor and youre using this script at your own risk
=============> Please do your own research
Swing ComparatorHere I bring you an array of methods to compare the swings and consistency between assets.
This indicator is excellent for swing traders and scalpers looking to maximize their profits by examining which of two closely related pairs provides greater price fluctuation during given period.
This indicator works against two assets, which are to be configured in settings.
This indicator has 5 particular plots for you to examine, each which can be considered for you to contemplate which pair for you to next perform a trade on.
First off, let's start with the blue.
The blue is simply a pearson correlation coefficient, thankfully now included in tradingview. This provides a value of 1 as values show to be close correlation, 0 showing no correlation, and -1 showing negative correlation - meaning an increase in one pair correlates to a decrease in another pair. This will turn green when greater than 0.975, showing a very strong relationship between the two pairs, and red when below -0.975. This is the only plot to be interpreted on a scale from -1 to +1.
Next, we have the purple and yellow background plots, followed by the white and green moving averages. Though similar, these are all slightly different.
For each of these 4 plots, a value greater than 0 indicates greater price swings for your Symbol #1, while a value less than 0 indicates greater price swings for Symbol #2.
These calculations are performed on a per bar basis, meaning you're likely going to be examining bars longer than what you'll normally be trading on. Use confluence, as well as your own judgement for this.
For example, if symbol #1 provides a bar with an open value 1% greater or less than close, providing a 1% swing on a given bar, but symbol #2 provides 2%, the indicator will fall down toward the negative, as Symbol #2 had the greater swing.
First, yellow focuses on only open/close bar values, and thus the body of the candlestick.
Purple, on the other hand, focuses on the wicks of the candle - thus, the high/low values. I've opted to make these two different values as a wick focuses on the embodiment within the time period, and body focuses on the open/close instant.
Next, the green is an extended EMA of the purple - High/Low ratio. This is important to examine trend overtime, and reduce unneeded noise.
Lastly, the white is simply difference in the standard deviation of the particular bars, between the two symbols you have selected. The tends to usually tie up with the green pretty well.
Considering this is going to by nature be very noisy datasets, I have included in settings the option to extend an EMA for everything. They have their default settings, but if you'd like to examine the trend without an EMA, feel free to set it to 1 to eliminate its effects.
I have additionally added the ability to introduce clipping, as well as scale the correlation coefficient to remain visible when examining very short term time scales. In the future, I hope to properly normalize all plots to remain within a -1 to +1 basis. Please be patient as I have multiple projects ongoing.
Suggestions and constructive criticism are very well encouraged.
Anyone is welcome to utilize this in their code, as well, i just ask you provide credit.
As you reduce to time frames less than a day, you will likely have to reduce the coefficient min/max closer to 0.025, or just hide it entirely.
TODO:
Make it look better. Sorry, folks.
Introduce latency between pairs.
Examine significance of a coefficient of determination
Remove static weights and introduce z-score and linear normalization.
Consider adding room for a 3rd pair. This could get ugly, however.

Cyclic RSI High Low With Noise Filter█ OVERVIEW
This indicator displays Cyclic Relative Strength Index based on Decoding the Hidden Market Rhythm, Part 1 written by Lars von Thienen.
To determine true or false for Overbought / Oversold are unnecessary, therefore these should be either strong or weak.
Noise for weak Overbought / Oversold can be filtered, especially for smaller timeframe.
█ FEATURES
Display calculated Cyclic Relative Strength Index.
Zigzag high low based on Cyclic Relative Strength Index.
Able to filter noise for high low.
█ LEGENDS
◍ Weak Overbought / Oversold
OB ▼ = Strong Overbought
OS ▲ = Strong Oversold
█ USAGE / TIPS
Recommend to be used for Harmonic Patterns such as XABCD and ABCD.
Condition 1 (XABCD) : When ▼ and ▲ exist side by side, usually this outline XA, while the next two ◍ can be BC.
Condition 2 (ABCD) : When ▼ and ▲ exist side by side, usually this outline AB, while the next one ◍ can be BC, strong ABCD.
Condition 3 (ABCD) : When ▼ or ▲ exist at Point A, the next two ◍ can be Point B and Point C, medium ABCD.
Condition 4 (ABCD) : When ◍ exist at Point a, the next two ◍ can be Point b and Point c, weak ABCD usually used as lower case as abcd.
█ CREDITS
LoneSomeTheBlue
WhenToTrade

[TTI] ATR channelsHISTORY AND CREDITS
Used by John Carter in his indicator’s toolbox. The ATR channels or the Keltner Channels represent the railroads or the natural movement of stocks.
WHAT IT DOES
Movements between the the The first multiplier lines (white) represent standard movement for the timeframe you are trading. Movements between the second multiplier (green/red lines) represent a 2stdv move of the stock in a single direction. Once a stock starts reaching the 3rd multiplier lines there’s an exponential chance that it will revert to the mean (cyan line)
Additionally, we have added the Institutional lines. These are thought in a Small Account Mastery class 2019 by John Carter, as the levels heavily watched by institutions. The default settings represent what John is teaching but they can be further customised.
HOW TO USE IT
ATRs channels or Keltner Channels can be great source for target or stop losses and can be used as a indicator for confluence with other technical tools like the Fibonacci lines.

Williams %R & RSI with Multiple PeriodsDESCRIPTION
1. Calculates %R and RSI with multiple period lengths.
1 period length value is defined by User.
8 period length values follow User's selection of classic number sequences, e.g. Fibonacci, Leonardo, Lucas, Narayana, etc.
2. User selects which indicator and periods to display or hide.
DEFAULTS
%R default custom period: 10.
RSI default custom period: 14.
%R & RSI default number sequence periods: Lucas numbers 11, 18, 29, 47, 76, 123, 199, 322.
CALCULATIONS
%R = (period high - most recent period's close price)/(period high - period low)
RSI = 100 - 1 / (100 + RS), where RS = SMMA(up, period) / SMMA(down, period)
PURPOSE
1. Identify price trends.
CREDITS
1. Williams %R technical analysis momentum oscillator by Larry Williams.
2. Wilder's Relative Strength Index technical analysis momentum oscillator by J. Welles Wilder.
3. "Solarized" color scheme by Ethan Schoonover.
Pythagorean Means of Moving AveragesDESCRIPTION
Pythagorean Means of Moving Averages
1. Calculates a set of moving averages for high, low, close, open and typical prices, each at multiple periods.
Period values follow the Fibonacci sequence.
The "short" set includes moving average having the following periods: 5, 8, 13, 21, 34, 55, 89, 144, 233, 377.
The "mid" set includes moving average having the following periods: 5, 8, 13, 21, 34, 55, 89, 144, 233, 377, 610, 987, 1597.
The "long" set includes moving average having the following periods: 5, 8, 13, 21, 34, 55, 89, 144, 233, 377, 610, 987, 1597, 2584, 4181.
2. User selects the type of moving average: SMA, EMA, HMA, RMA, WMA, VWMA.
3. Calculates the mean of each set of moving averages.
4. User selects the type of mean to be calculated: 1) arithmetic, 2) geometric, 3) harmonic, 4) quadratic, 5) cubic. Multiple mean calculations may be displayed simultaneously, allowing for comparison.
5. Plots the mean for high, low, close, open, and typical prices.
6. User selects which plots to display: 1) high and low prices, 2) close prices, 3) open prices, and/or 4) typical prices.
7. Calculates and plots a vertical deviation from an origin mean--the mean from which the deviation is measured.
8. Deviation = origin mean x a x b^(x/y)/c.
9. User selects the deviation origin mean: 1) high and low prices plot, 2) close prices plot, or 3) typical prices plot.
10. User defines deviation variables a, b, c, x and y.
Examples of deviation:
a) Percent of the mean = 1.414213562 = 2^(1/2) = Pythagoras's constant (default).
b) Percent of the mean = 0.7071067812 = = = sin 45˚ = cos 45˚.
11. Displaces the plots horizontally +/- by a user defined number of periods.
PURPOSE
1. Identify price trends and potential levels of support and resistance.
CREDITS
1. "Fibonacci Moving Average" by Sofien Kaabar: two plots, each an arithmetic mean of EMAs of 1) high prices and 2) low prices, with periods 5, 8, 13, 21, 34, 55, 89, 144, 233, 377, 610, 987, 1597, 2584, 4181.
2. "Solarized" color scheme by Ethan Schoonover.

Correlation StrategyThis is a basic strategy that shows how to trigger short/long/close signals on chart's symbol based on calculations made on another symbol which we consider correlated to it.
With default parameters, ETH/USDT as base symbol, the strategy shows good results in backtest for several symbols : DENT/USDT, BTT/USDT, FTT/USDT, DOT/USDT etc.
This is not surprising giving the importance of ETH in the crypto market so it makes sense many crypto currencies will follow ETH big movements.
Note : the strategy with default parameters is supposed to be applied on 4h timeframe. On other timeframes, try another support length.
How the strategy works :
A wma is calculated on the base symbol, with 200 length by default.
When wma is rising, we go long. When wma is falling we go short.
Take profit for Long/Short and Stop Loss for Long/Short are calculated percentages so 0.05 = 5% etc.
Also, Take profit / Stop loss are calculated on the base symbol not the chart's symbol.
The script uses the Monthly Returns table slightly modified to include buy & hold returns. Credits to @QuantNomad

Fib RSI++ by [JohnnySnow]Fib RSI++ by is an RSI Inspired by my absolutely favorite RSI on tradingview: RSI & EMA with Reverse Calculator Panel by balipour.
Built for quicker and easily identify prices at current RSI /possibly reversals/ RSI direction and RSI landings.
From balipour, I reuse /adapt to pinescriptV5 3 lines of code ( ) - the balipour implementation for reversing RSI formula in order to calculate price estimation based on the Given RSI level. Credits to the author.
Inspired by it, I also combine RSI with a MA but tuned to reads better the support/resistance levels (my humble opinion).
For quicker price target identification 2 features were added:
- Gridlines based on Fib levels, standard overbought/oversold levels and other levels I personally use. All of the grid lines can be configured according to user preferences.
- 2 information tables:
--First with a collection of 'close' numbers and Fib RSI levels price estimations at given RSI
--The second table allows the user to add up to 3 custom RSI levels to further target the price estimation.
Author UI Preferences to be used with this indicator: dark theme, hidden vertical and horizontal chart gridlines.

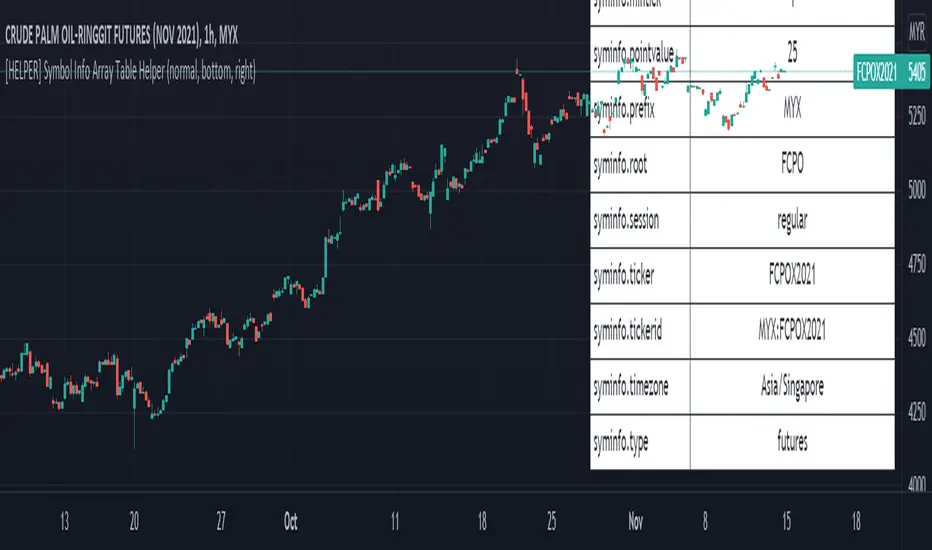
[HELPER] Symbol Info Array Table HelperThis indicator is to show symbol info in table using built-in syminfo name space, coded in latest Pine Script version 5.
Credits to PineCoders and Everget
Features :
- Display table by changing table position, font size and color.
- Show / Hide necessary symbol info.
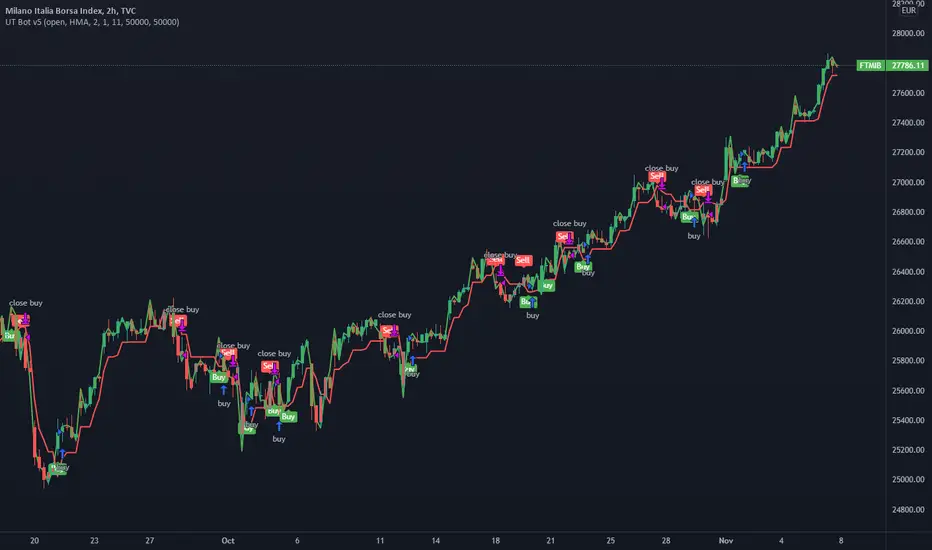
UT Bot v5This is an update by request, on someone elses strategy! well more of an edit, but also update from pine v4 to pine v5.
//CREDITS to HPotter for the orginal code. The guy trying to sell this as his own is a scammer lol.
//Edited and converted to @version=5 by SeaSide420 for Paperina
The UT Bot v5 is Movinging average (the MA) vs ATR (the ATR is in the form intended for use as trailing stop loss (ATR_TSL))
Entry logic:
buy = the MA > ATR_TSL and Price > ATR_TSL
sell = the MA < ATR_TSL and Price < ATR_TSL
The Moving average type can be changed in the settings:
options = "SMA", "EMA", "WMA", "HMA"]
the edits i made were:
convert to v5
Add TP and SL
Add Buy only or Sell only option
Add MA type option
Add price source option
Draw MA and ATR_TSL on-chart
logLibrary "log"
A Library to log and display messages in a table, with different colours.
The log consists of 3 columns:
Bar Index / Message / Log
Credits
QuantNomad - for his idea on logging messages as Error/Warnings and displaying the color based on the type of the message
setHeader(_t, _location, _header1, _header2, _header3, _halign, _valign, _size) Sets the header for the table to be used for displaying the logs.
Parameters:
_t : table, table to be used for printing
_location : string, Location of the table.
_header1 : string, the name to put into the Index Queue Header. Default is 'Bar #'
_header2 : string, the name to put into the Message Queue Header. Default is 'Message'
_header3 : string, the name to put into the Log Queue Header. Default is 'Log'
_halign : string, the horizontal alignment of header. Options - Left/Right/Center
_valign : string, the vertical alignment of header. Options - Top/Bottom/Center
_size : string, the size of text of header. Options - Tiny/Small/Normal/Large/Huge/Auto
Returns: Void
initHeader(_location, _rows, _header1, _header2, _header3, _halign, _valign, _size, _frameBorder, _cellBorder) Creates the table for logging.
3 columns will be displayed.
Bar Index Q / Message Q / Log Q
Parameters:
_location : string, Location of the table.
_rows : int, table size, excluding the header. Default value is 40.
_header1 : string, the name to put into the Index Queue Header. Default is 'Bar #'
_header2 : string, the name to put into the Message Queue Header. Default is 'Message'
_header3 : string, the name to put into the Log Queue Header. Default is 'Log'
_halign : string, the horizontal alignment of header. Options - Left/Right/Center
_valign : string, the vertical alignment of header. Options - Top/Bottom/Center
_size : string, the size of text of header. Options - Tiny/Small/Normal/Large/Huge/Auto
_frameBorder : int, table Frame BorderWidth. Default value is 1.
_cellBorder : int, table Cell Borders Width, Default value is 2.
Returns: table
init(_rows) Initiate array variables for logging.
Parameters:
_rows : int, table size, excluding the header. Default value is 40.
Returns: tuple, arrays - > error code Q, bar_index Q, Message Q, Log Q
log(_ec, _idx, _1, _2, _m1, _m2, _code, _prefix, _suffix) logs a message to logging queue.
Parameters:
_ec : int , Error/Codes (1-7) for colouring.
Default Colour Code is 1 - Gray, 2 - Orange, 3 - Red, 4 - Blue, 5 - Green, 6 - Cream, 7 - Offwhite
_idx : int , bar index Q. The index of current bar is logged automatically
you can add before and after this index value, whatever you choose to, via the _prefix and _suffix variables.
_1 : string , Message Q.
_2 : string , Log Q
_m1 : string, message needed to be logged to Message Q
_m2 : string, detailed log needed to be logged to Log Q
_code : int, Error/Code to be assigned. Default code is 1.
_prefix : string, prefix to Bar State Q message
_suffix : string, suffix to Bar State Q message
Order of logging would be Bar Index Q / Message Q / Log Q
Returns: void
resize(_ec, _idx, _1, _2, _rows) Resizes the all messaging queues.
a resize will delete the existing table, so a new header/table has to be initiated after the resize.
This is because pine doesnt allow changing the table dimensions once they have been recreated.
If size is decreased then removes the oldest messages
Parameters:
_ec : int , Error/Codes (1-7) for colouring.
_idx : int , bar index Q.
_1 : string , Message Q.
_2 : string , Log Q
_rows : int, the new size needed for the queue. Default value is 40.
Returns: void
print(_t, _ec, _idx, _1, _2, halign, halign, _size) Prints Bar Index Q / Message Q / Log Q
Parameters:
_t : table, table to be used for printing
_ec : int , Error/Codes (1-7) for colouring.
Default Colour Code is 1 - Gray, 2 - Orange, 3 - Red, 4 - Blue, 5 - Green, 6 - Cream, 7 - Offwhite
_idx : int , for bar index Q.
_1 : string , Message Q.
_2 : string , Log Q
halign : string, the horizontal alignment of all message column. Options - Left/Right/Center
halign : string, the vertical alignment of all message column. Options - Top/Bottom/Center
_size : string, the size of text across the table, excepr the headers. Options - Tiny/Small/Normal/Large/Huge/Auto
Returns: void
printx(_t, _idx, _1, _2, _ec, _fg, _bg, _halign, _valign, _size) Prints Bar Index Q / Message Q / Log Q, but with custom options to format the table and colours
Parameters:
_t : table, table to be used for printing
_idx : int , for bar index Q.
_1 : string , Message Q.
_2 : string , Log Q
_ec : int , Error/Codes (1-7) for colouring.
_fg : color , Color array specifying colours for foreground. Maximum length is seven. Need not provide all seven, but atleast one. If not enough provided then last colour in the array is used for missing codes
_bg : color , Same as fg.
_halign : string, the horizontal alignment of all message column. Options - Left/Right/Center
_valign : string, the vertical alignment of all message column. Options - Top/Bottom/Center
_size : string, the size of text across the table, excepr the headers. Options - Tiny/Small/Normal/Large/Huge/Auto
Returns: void
flush(_t, _idx, _1, _2, _ec) Clears queues of existing messages, filling with blanks and 0
Parameters:
_t : table, table to be flushed
_idx : int , for bar index Q.
_1 : string , Message Q.
_2 : string , Log Q
_ec : int , Error/Codes (1-7) for colouring.
Returns: void.
erase(_idx, _1, _2, _ec) Deletes message queue and the table used for displaying the queue
Parameters:
_idx : int , for bar index Q.
_1 : string , Message Q.
_2 : string , Log Q
_ec : int , Error/Codes (1-7) for colouring.
Returns: void

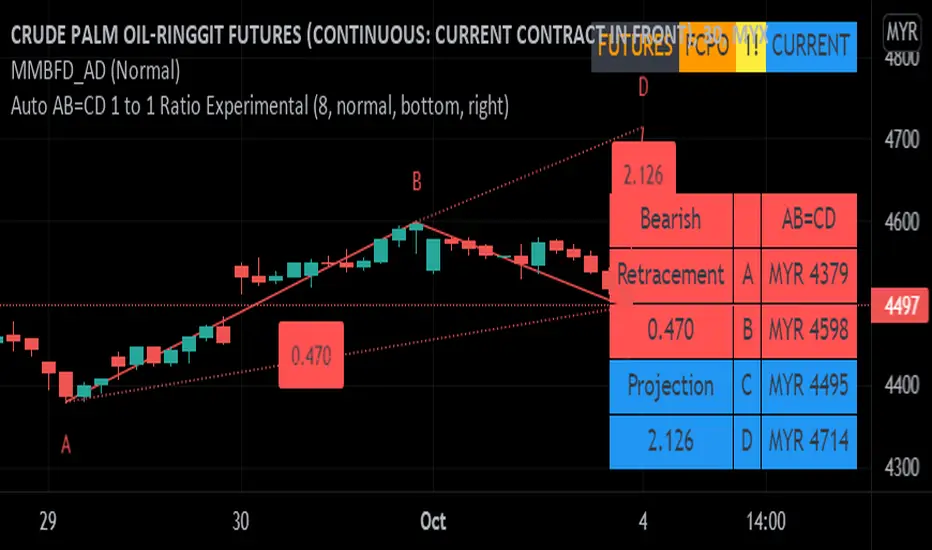
Auto AB=CD 1 to 1 Ratio ExperimentalThis indicator was experimental based AB=CD, shows last AB=CD either Standard AB=CD or Reciprocal AB=CD which uses time instead of bar_index.
This build is based upon educational materials (refer below resources).
ABCD are based on 1 to 1 Ratio for price and time.
Features / Pros:
1. Show last AB=CD points and lines including table value.
2. Customize table position and size.
3. For desktop display only, not for mobile.
Cons:
1. Time for point D less accurate for intraday timeframe (minute, hour, etc) which may including holidays and depends on price volatility.
2. Label ratio not shown properly depends on timeframe especially for intraday timeframe and maybe for Daily and Weekly timeframe.
3. Experimental code, use at your own risk.
FAQ
1. Credits
Scott M Carney, Harmonic Trading: Volume One and Two.
LonesomeTheBlue for zigzag array source code.
HeWhoMustNotBeNamed for some guidance and advice.
2. Previous Build / Resources
Link 1
Link 2
Link 3
Link 4
3. Code Usage
Free to use for personal usage.
Left : Bullish AB=CD, Right : Bullish Reciprocal AB=CD
Left : Bearish AB=CD, Right : Bearish Reciprocal AB=CD
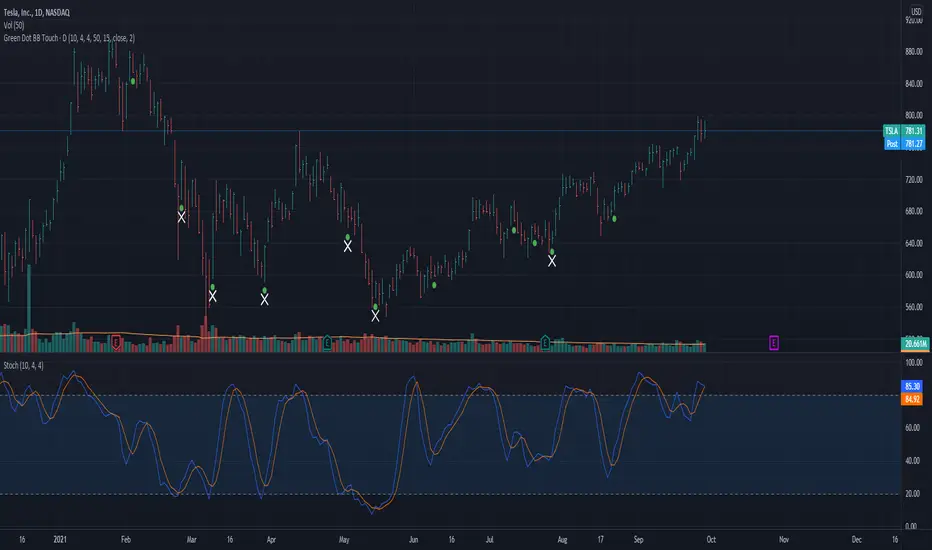
Green Dot with Lower BB TouchThis code is based on Dr. Wish's Green Dot indicator and all credits should go to him for this indicator. I have adapted the code described by Dr. Wish in his various blog posts and webinars.
This indicator involves Stochastics and Bollinger Band indicators to provide an indication when a technically sound stock is potentially oversold and reading to resume its uptrend. This is best used in Stage 2 (Weinstein) stocks viewed on a daily chart.
The green dot appears when the fast stochastic recently crosses over the slow stochastic at the oversold (OS) threshold.
The default values for this Stochastic are 10,4,4 with an oversold (OS) threshold of 50. You can add the built-in Stochastic indicator to check this out and have a better visual as to why this works.
An added enhancement is using Bollinger Bands, specifically when the price has crossed the lower band in the past 3 days. The also plays into the themes of stocks that are following an uptrend.
The default values for the Bollinger Band portion of the indicator is a length of 15 with a standard deviation of using the stock's closing price.
I have compared this indicator with the many examples from Dr. Wish's blog and feel free to do the same to make sure it is in agreement.
I welcome your feedback and any enhancements you may suggest.
[pp] Signal GeneratorResearch and Development Tool.
For anyone who is familiar with working with digital signals (audio/electrical engineers) you might appreciate this Signal Generator.
You can select and vary 4 different types of signals.
Logistic Map
If you're not familiar with the logistic map, then go watch a youtube video. By default the equation is meant to represent chaos and is a good alternative for random number generation.
Random
This uses the built-in random number generator. I'm not sure if it's better to use this or the logmap default settings. Either way, you have a choice.
Unit Impulse
Good for creating a transient impulse.
Step Impulse
Similar to the unit impulse. Except constant and not a transient.
Synthesizer
It comes with 4 wave functions (Sine, Triangle, Square, Saw) that can be combined for additive synthesis. Each wave function contains its own respective phase and amplitude control.
Credits
Many of these functions were taken from www.pinecoders.com with the exception of the logistic map. I simply aggregated them all into this toolkit for ease of use.
How to use
This is not a trading indicator. This is meant to be used for research and development. You could use it to test strategies, by generating white noise with the logmap and creating trading signals. Or you could use it for teaching and learning. Using the constant data as a dependable, repeatable resource.

Gann Square 9 Price Line Helper (Experimental)This indicator was intended as educational purpose only for Gann Square 9, specifically to show Cross and Cross Cardinal.
This indicator was build upon The Tunnel Thru The Air Or Looking Back From 1940, written by WD Gann .
Values shown is theoretical for basic understanding and may not represent actual market trend.
This pine script for educational purpose as basic understanding only, not recommend for actual trade and use at your on risk.
Indicator features :
1. Font size for table from tiny to huge.
2. Table can change position or hide.
2. For desktop display only, not for mobile.
3. All values can be selected individually or group to display individual or group lines and labels.
FAQ
1. Credits
WD Gann , The Tunnel Thru The Air Or Looking Back From 1940
2. Page involved
195 - 198
3. Code Usage
Free to use for personal usage.

Gann Square 9 Table Concept Alternate UIThis indicator was intended as educational purpose only for Gann Square 4, specifically to show Cross Cardinal.
This indicator was build upon The Tunnel Thru The Air Or Looking Back From 1940, written by WD Gann .
This build was improved by grouping similar values after selected to save time.
User Interface also was improved.
Indikator ini bertujuan sebagai pendidikan sahaja untuk Gann Square 4, khusus untuk menunjukkan Cross Cardinal.
Indikator ini dibina berdasarkan buku The Tunnel Thru The Air Or Looking Back From 1940, ditulis oleh WD Gann .
Binaan ini telah ditambah baik engan mengumpulkan nilai yang sama setelah dipilih untuk menjimatkan masa.
User Interface juga telah ditambah baik.
Indicator features :
1. Font size from tiny to huge.
2. For desktop display only, not for mobile.
3. All values can be selected by group.
Kemampuan indikator :
1. Saiz font dari paling kecil ke paling besar.
2. Untuk paparan desktop sahaja, bukan untuk mobile.
3. Semua nilai boleh dipilih secara berkumpulan.
FAQ
1. Credits / Kredit
WD Gann , The Tunnel Thru The Air Or Looking Back From 1940
Ganzilla
2. Page involved / Muka Surat terlibat
195 - 198
3. Code Usage / Penggunaan Kod
Free to use for personal usage.
Bebas untuk kegunaan peribadi.
4. Previous build / Binaan sebelum ini
Gann Square 9 Cross Cardinal Table Concept
5. Related build / Binaan berkaitan
Gann Square 4 Cross Cardinal Table Concept
Gann Square 4 Table Concept Alternate UI
Left : Even array number / Kiri : Array nombor genap
Right : Odd array number / Kanan : Array nombor ganjil
Gann Square 4 Table Concept Alternate UIThis indicator was intended as educational purpose only for Gann Square 4, specifically to show Cross Cardinal.
This indicator was build upon The Tunnel Thru The Air Or Looking Back From 1940, written by WD Gann .
This build was improved based on Gann Square 4 Cross Cardinal Table Concept by grouping similar values after selected to save time.
User Interface also was improved.
Indikator ini bertujuan sebagai pendidikan sahaja untuk Gann Square 4, khusus untuk menunjukkan Cross Cardinal.
Indikator ini dibina berdasarkan buku The Tunnel Thru The Air Or Looking Back From 1940, ditulis oleh WD Gann .
Binaan ini telah ditambah baik berdasarkan Gann Square 4 Cross Cardinal Table Concept dengan mengumpulkan nilai yang sama setelah dipilih untuk menjimatkan masa.
User Interface juga telah ditambah baik.
Indicator features :
1. Font size from tiny to huge.
2. For desktop display only, not for mobile.
3. All values can be selected by group.
Kemampuan indikator :
1. Saiz font dari paling kecil ke paling besar.
2. Untuk paparan desktop sahaja, bukan untuk mobile.
3. Semua nilai boleh dipilih secara berkumpulan.
FAQ
1. Credits / Kredit
WD Gann , The Tunnel Thru The Air Or Looking Back From 1940
Ganzilla
2. Page involved / Muka Surat terlibat
195 - 198
3. Code Usage / Penggunaan Kod
Free to use for personal usage.
Bebas untuk kegunaan peribadi.
4. Previous build / Binaan sebelum ini
Gann Square 4 Cross Cardinal Table Concept
5. Related build / Binaan berkaitan
Gann Square 9 Cross Cardinal Table Concept
Left : Even array number / Kiri : Array nombor genap
Right : Odd array number / Kanan : Array nombor ganjil

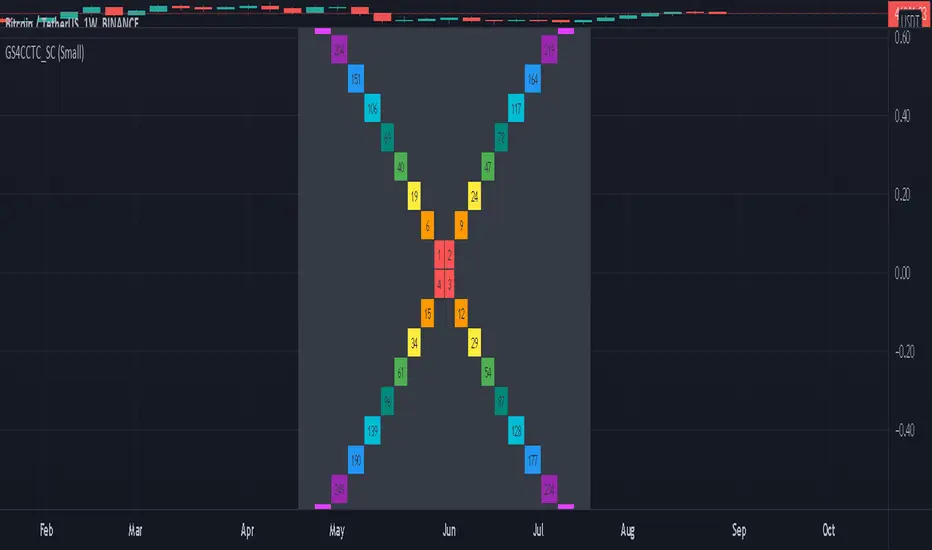
Gann Square 4 Cross Cardinal Table ConceptThis indicator was intended as educational purpose only for Gann Square 4, specifically to show Cross Cardinal.
This indicator was build upon The Tunnel Thru The Air Or Looking Back From 1940, written by WD Gann.
Gann Square 4 is similar to Gann Square 9 (Refer this build) but limited to Cross Cardinal only.
Indikator ini bertujuan sebagai pendidikan sahaja untuk Gann Square 4, khusus untuk menunjukkan Cross Cardinal.
Indikator ini dibina berdasarkan buku The Tunnel Thru The Air Or Looking Back From 1940, ditulis oleh WD Gann.
Gann Square 4 hampir sama dengan Gann Square 9 (Rujuk binaan ini) tetapi terhad kepada Cross Cardinal sahaja.
Indicator features :
1. Font size from tiny to huge.
2. For desktop display only, not for mobile.
3. All values can be selected individually.
Kemampuan indikator :
1. Saiz font dari paling kecil ke paling besar.
2. Untuk paparan desktop sahaja, bukan untuk mobile.
3. Semua nilai boleh dipilih secara individu.
FAQ
1. Credits / Kredit
WD Gann , The Tunnel Thru The Air Or Looking Back From 1940
Ganzilla
2. Page involved / Muka Surat terlibat
195 - 198
3. Code Usage / Penggunaan Kod
Free to use for personal usage.
Bebas untuk kegunaan peribadi.
Left : All values off / Kiri : Semua nilai off
Right : All values on / Kanan : Semua nilai on
Left : Random Usage / Kiri : Kegunaan Random
Right : Ideal Usage / Kanan : Kegunaan Ideal
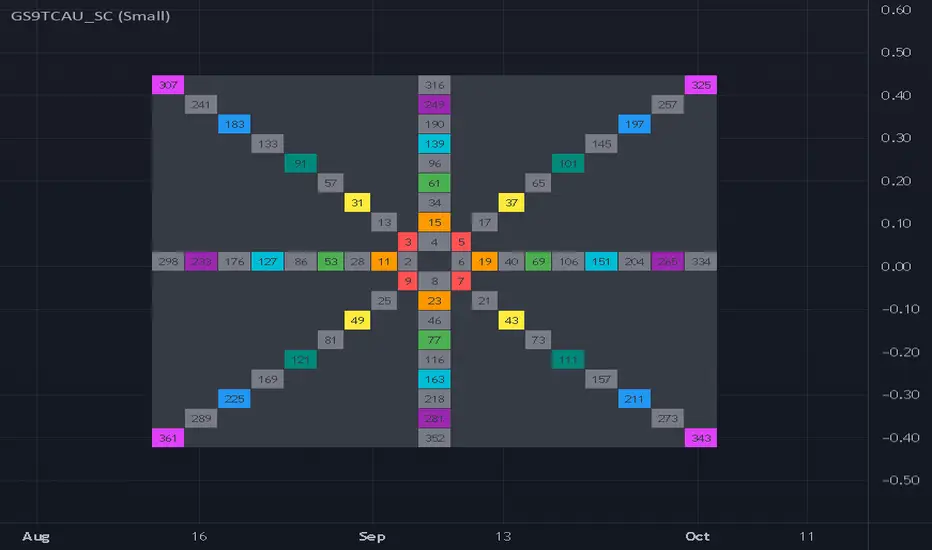
Gann Square 9 Cross Cardinal Table ConceptThis indicator was intended as educational purpose only for Gann Square 9, specifically to show Cross and Cross Cardinal.
This indicator was build upon The Tunnel Thru The Air Or Looking Back From 1940, written by WD Gann.
Indikator ini bertujuan sebagai pendidikan sahaja untuk Gann Square 9, khusus untuk menunjukkan Cross dan Cross Cardinal.
Indikator ini dibina berdasarkan buku The Tunnel Thru The Air Or Looking Back From 1940, ditulis oleh WD Gann.
Indicator features :
1. Font size from tiny to huge.
2. For desktop display only, not for mobile.
3. All values can be selected individually.
Kemampuan indikator :
1. Saiz font dari paling kecil ke paling besar.
2. Untuk paparan desktop sahaja, bukan untuk mobile.
3. Semua nilai boleh dipilih secara individu.
FAQ
1. Credits / Kredit
WD Gann, The Tunnel Thru The Air Or Looking Back From 1940
Ganzilla
2. Page involved / Muka Surat terlibat
195 - 198
3. Code Usage / Penggunaan Kod
Free to use for personal usage.
Bebas untuk kegunaan peribadi.
Left : All values off / Kiri : Semua nilai off
Right : All values on / Kanan : Semua nilai on
Left : All Cross / Kiri : Semua Cross
Right : All Cross Cardinal/ Kanan : Semua Cross Cardinal
Left : Random Usage / Kiri : Kegunaan Random
Right : Ideal Usage / Kanan : Kegunaan Ideal

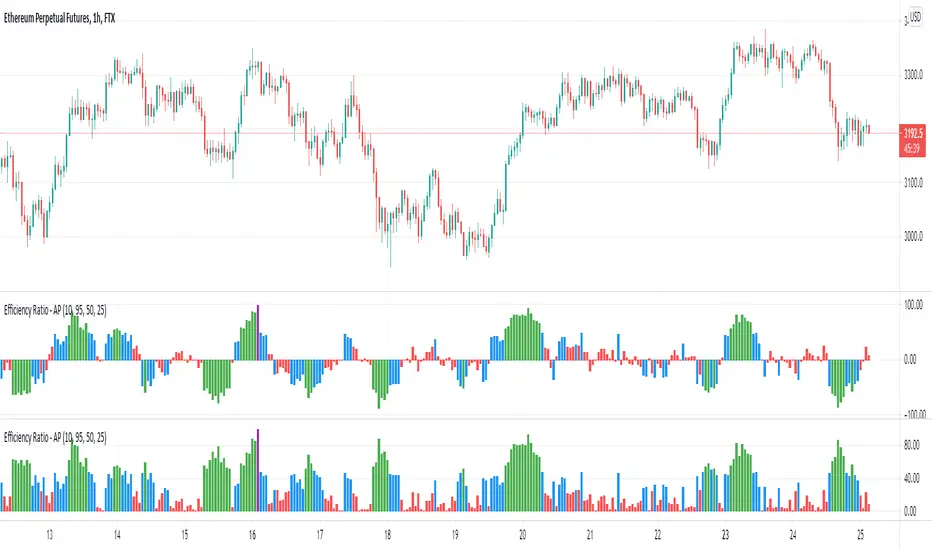
Efficiency Ratio (Market Noise) by Alejandro PThis is an indicator based on the Efficiency Ratio by Perry Kaufman. Like Price Density, which we have published previously, Perry Kaufman's Efficiency Ratio is a quantifiable method of measuring market noise.
This version of the indicator includes a feature to make the values of the indicator change based on thresholds to easier visualize different market conditions. Additionally there is a directional feature which factors in the direction of the price moves.
We can use the Efficiency Ratio to set rules and only trade particular systems when noise is at an appropriate level. For example, if noise is high then we would want to avoid trend following strategies and instead trade mean-reversion strategies, and vice-versa when the opposite is true.
The Efficiency Ratio can also be used to match assets to strategies. Some assets will be naturally more noisy than others and therefore we might have a principle where we only trade those noisy assets with our mean reversion strategies and the more quiet assets with trend following strategies.
Calculation:
Efficiency Ratio = Absolute net change in close price / absolute sum of the individual close price changes
The numerator looks at the absolute close change in price. It subtracts the starting close price in the period from the final close price in the period. The denominator compares the close price of one bar to the close price of the previous bar, this is performed for each of the successive bars in the whole period and then the value is summed. The absolute price is used because there are positive and negative values because each bar may close above or below the previous bar close.
The Efficiency Ratio provides an opposite interpretation of market noise compared to Price Density. With Price Density high values = high noise and low values = low noise. With the Efficiency Ratio high values = low noise and low values = high noise.
Comparing Price Density to Perry Kaufman's Efficiency Ratio:
Similarities
Both use the sum of the individual bar moves
- Price Density - High - Low
- Efficiency Ratio - Close to Close
Differences
Price Density uses the full price range (to determine the height of the box)
Efficiency Ratio uses the net close price change over the period
The interpretation of the values is the reverse for each
Full credits to the source of the above information and interpretation.
MYX Bursa IPO Listing Table (Source Code)This indicator intended for Malaysia Market only for Initial Public Offering (IPO) refer to Bursa Malaysia
Indikator ini adalah untuk pasaran Malaysia sahaja untuk Tawaran Awam Permulaan (IPO) rujuk kepada Bursa Malaysia
Indicator features :
1. List similar symbol or counter based on year including total.
2. Font size small for mobile app and font size normal for desktop.
Kemampuan indikator :
1. Senarai simbol atau kaunter yang terlibat mengiku tahun termasuk jumlah.
2. Saiz font kecil untuk mobile app dan saiz size normal untuk desktop.
FAQ
1. Code Usage / Penggunaan Kod
Free to use for personal usage but credits are most welcomed.
Not for business / commercial usage, any damage or lialibity are not my resposibility.
Bebas untuk kegunaan peribadi tetapi kredit adalah amat dialu-alukan.
Bukan untuk kegunaan perniagaan / komersil, sebarang kerosakan atau liability adalah di luar tanggungjawab saya.
2. Update Frequency / Frekuensi
Anytime after official update by Bursa Malaysia.
Bila-bila masa selepas kemaskini rasmi oleh Bursa Malaysia
3. Symbol/Counter not showing / Simbol/kaunter tiada
Symbol/counter not longer exist or not yet updated.
Simbol/kaunter telah tersenarai keluar atau belum dikemaskini.
4. Why table overlap with chart ? To avoid this, click indicator > Visual Order > Send to Front.
Kenapa table bertindih dengan carta ? Untuk mengatasi ini, klik indikator > Visual Order > Send to Front.
All Setting enabled.
Semua seting diaktifkan.
Small Font setting enabled, suitable for mobile app.
Setting font kecil diaktifkan., sesuai untuk mobile app.
Setting by year.
Setting mengikut tahun.

Pi Cycle bitcoin bottomFull credits go to the owner, but for reasons i cannot diclose.
Introduction
With the adoption of cryptographic assets reaching new heights, it is undeniably important to continuously expand and improve current indicators just like how these assets update with new lines of code over time.
Philip Swift’s Pi-Cycle Top Indicator has effectively signaled market and local tops to within 3 days, with the most recent occurrence being on May 12th 2021.
If it were possible to find the cycle/local top of each cycle, a similar analogy could be used to pinpoint the bottom of Bitcoin’s price.
These Pi-Cycle indicators are merely just two moving averages which, when divided by each other, are equal to the value of π.
π = Long MA / Short MA
350/111 = 3.153; as per the existing Bitcoin Pi-Cycle Top indicator.
Pi-Cycle Bottom for Bitcoin
At first, the existing “Pi moving average” pair (350/111) was realigned to see whether they cross at the bottom of the Bitcoin price.
They did not, only to be a lagging indicator in both 2015 and 2018 cycle bottoms.
A possible pair was discovered when the short MA was set to 150:
π = Long MA / 150
Long MA = π * 150
Long MA = 471 (rounded to the nearest whole number)
This resulted in a Pi MA pair of 471/150.
Using the multiple x0.745 of the 471-day SMA and the 150-day EMA (exponential average to take into account of short term volatility ), the price of Bitcoin bottoms at where they two moving averages cross:
When the 150-day EMA crossed below the 471 SMA *0.475, Bitcoin’s price had bottomed for the market cycle.
Over the last two market cycles, this indicator has been accurate to within 3 days also.
