SMA Pro (Tick)Simple moving average based on 100 ticks, by default. Use for high volume markets like ES, NQ, and RTY.
在脚本中搜索"NQ"

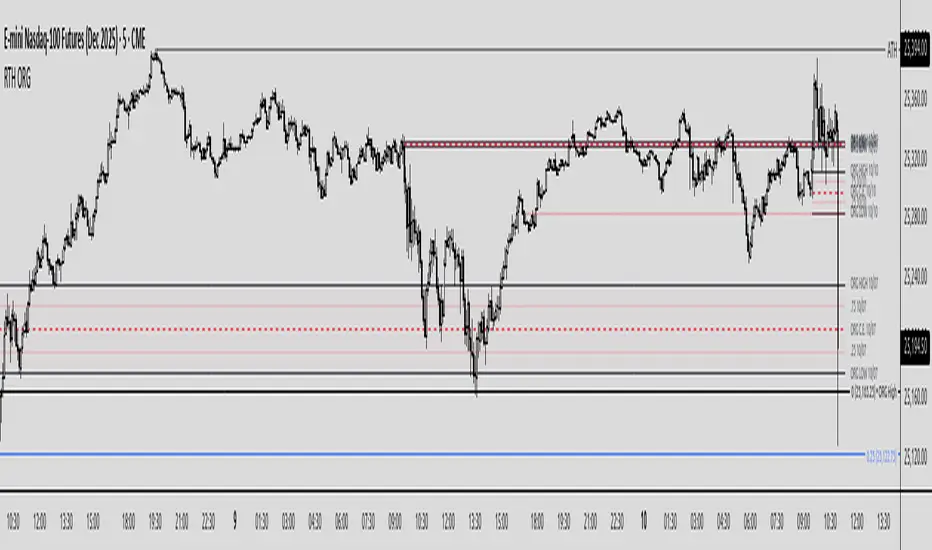
Regular Trading Hours Opening Range Gap (RTH ORG)### Regular Trading Hours (RTH) Gap Indicator with Quartile Levels
**Overview**
Discover overnight gaps in index futures like ES, YM, and NQ, or stocks like SPY, with this enhanced Pine Script v6 indicator. It visualizes the critical gap between the previous RTH close (4:15 PM ET for futures, 4:00 PM for SPY) and the next RTH open (9:30 AM ET), helping traders spot potential price sensitivity formed during after-hours trading.
**Key Features**
- **Standard Gap Boxes**: Semi-transparent boxes highlight the gap range, with optional text labels showing day-of-week and "RTH" identifier.
- **Midpoint Line**: A customizable dashed line at the 50% level, with price labels for quick reference.
- **New: Quartile Lines (25% & 75%)**: Dotted lines (default width 1) mark the quarter and three-quarter points within the gap, ideal for finer intraday analysis. Toggle on/off, adjust style/color/width, and add labels.
- **High-Low Gap Variant**: Optional boxes and midlines for gaps between the prior close's high/low and the open's high/low—perfect for wick-based overlaps on lower timeframes (5-min or below recommended).
- **RTH Close Lines**: Extend previous close levels with dotted lines and price tags.
- **Customization Galore**: Extend elements right, limit historical displays (default: 3 gaps), no-plot sessions (e.g., avoid weekends), and time offsets for non-US indices.
**How to Use**
Apply to 15-min or lower charts for best results. Toggle "extend right" for ongoing levels. SPY auto-adjusts for its 4 PM close.
Tested on major indices—enhance your gap trading strategy today! Questions? Drop a comment.
Thanks to twingall for supplying the original code.
Thanks to The Inner Circle Trader (ICT) for the logical and systematic application.
Basic ICT PD Array MarkerIt focuses on OBs and FVGs on your chosen timeframe (e.g., H1 for /NQ). This is open-source friendly and based on ICT logic from community scripts.

MYM Edge Booster MYM Long Trading Assistant - ATR-Based Edge Booster
Clean, simple indicator that tells you when MYM long setups meet high-probability criteria. No complicated charts - just clear numbers and signals.
• ATR Targets & Stops (whole numbers)
• Quality Score (0-3 stars)
• Green Circle when conditions perfect
• Warnings for choppy/high volatility
• ES/NQ sector confirmation
Eliminates guesswork. Trade when the green circle appears.

ES/NQ, Pre-Market High & Low (04:00 AM - 09:30 AM)This indicator marks the Pre market high and Pre market low from 04:00am to 09:30am for any us Index

QQQ Ladder → Adjusted to Active Ticker (5s & 10s)This indicator allows you to a grid of QQQ levels directly on futures chart like NQ, MNQ, ES and MES, automatically adjusting for the spread between the displayed symbol and QQQ. This is particularly useful for traders who perform technical analysis on QQQ but execute trades on Futures.
Features:
Renders every 5 and 10 points steps of QQQ in your current chart.
The script adjusts these levels in real-time based on the current spread between QQQ and the displayed symbol!
Plots updated horizontal lines that move with the spread
Supports Multiple Tickers, ES1!, MES1!, NQ1!, MNQ1! SPY and SPX500USD.

Confluence Engine Confluence Engine is a practical, non-repainting decision aid that scores market conditions from −100…+100 by combining six proven modules: Trend, Momentum, Volatility, Volume, Structure, and an HTF confirmation. It’s designed for crypto, forex, indices, and stocks, and it fires entries only on confirmed bar closes.
What’s inside
Trend: EMA 20/50/200 alignment plus a Supertrend/KAMA toggle (you choose the baseline).
Momentum: RSI + MACD with confirmed-pivot divergence detection.
Volatility: ATR% and Bollinger Band width vs its average to favor expansion over chop.
Volume: OBV-style cumulative flow slope + volume surge vs SMA×multiplier.
Market Structure: Confirmed pivots, BOS (break of structure) and CHOCH (change of character).
HTF Filter: Closed higher-timeframe context via request.security(..., barmerge.gaps_on, barmerge.lookahead_off).
Why it does not repaint
Signals are computed and plotted on closed bars only.
Pivots/divergences use confirmed pivot points (no forward look).
HTF series are fetched with lookahead_off and use the last closed HTF bar in realtime.
No future bar references are used for entries or alerts.
How to use (3 steps)
Pick a timeframe pair: use a 4–6× HTF multiplier (5m→30m, 15m→1h, 1h→4h, 4h→1D, 1D→1W).
Trade with the HTF: take longs only when the HTF filter is bullish; shorts only when bearish.
Prefer expansion: act when BB width > its average and ATR% is elevated; skip most signals in compression.
Suggested presets (start here)
Crypto (BTC/ETH): 15m→1h, 1h→4h. stLen=10, stMult=3.0, bbLen=20, surgeMul=1.8–2.2, thresholds +40 / −40 (intraday can try +35 / −35).
Forex majors: 15m→1h, 1h→4h. stLen=10–14, stMult=2.5–3.0, surgeMul=1.5–1.8, thresholds +35 / −35 (swing: +45 / −45).
US equities (liquid): 5m→30m/1h, 15m→1h/2h. stMult=3.0–3.5, surgeMul=1.6–2.0, thresholds +45 / −45 to reduce chop.
Indices (ES/NQ): 5m→30m, 15m→1h. Defaults are fine; start at +40 / −40.
Gold/Oil: 15m→1h, 1h→4h. Thresholds +35 / −35, surgeMul=1.6–1.9.
Inputs (plain English)
Use Supertrend (off = KAMA): choose the trend baseline.
EMA Fast/Mid/Slow: 20/50/200 by default for classic stack.
RSI/MACD + divergence pivots: momentum and exhaustion context.
ATR Length & BB Length: volatility regime detection.
Volume SMA & Surge Multiplier: defines “meaningful” volume spikes.
Pivot left/right & “Confirm BOS/CHOCH on Close”: structure strictness.
Enable HTF & Higher Timeframe: confirms the lower timeframe direction.
Thresholds (+long / −short): when the score crosses these, you get signals.
Signals & alerts (IDs preserved)
Entry shapes plot at bar close when the score crosses thresholds.
Alerts you can enable:
CONFLUENCE LONG — long entry signal
CONFLUENCE SHORT — short entry signal
BULLISH BIAS — score turned positive
BEARISH BIAS — score turned negative
Best practices
Focus on signals with HTF agreement and volatility expansion; require volume participation (surge or rising OBV slope) for higher quality.
Raise thresholds (+45/−45 or +50/−50) to reduce whipsaws in choppy sessions.
Lower thresholds (+35/−35) only if you also require volatility/volume filters.
Performance & scope
Works across crypto/FX/equities/indices; no broker data or special feeds required.
No repainting by design; signals/alerts are computed on closed bars.
As with any tool, results vary by regime; always combine with risk management.
Disclosure
This script is for educational purposes only and is not financial advice. Trading involves risk. Test on historical data and paper trade before using live.

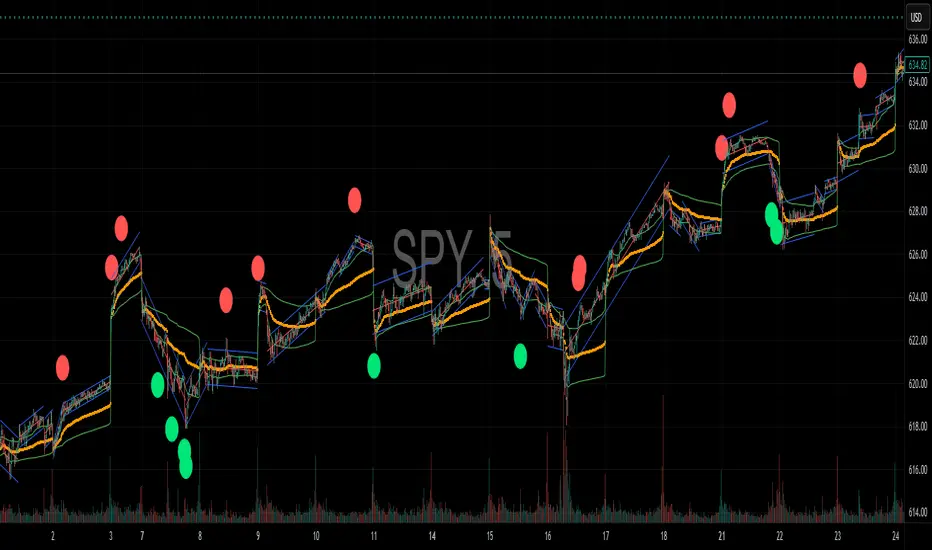
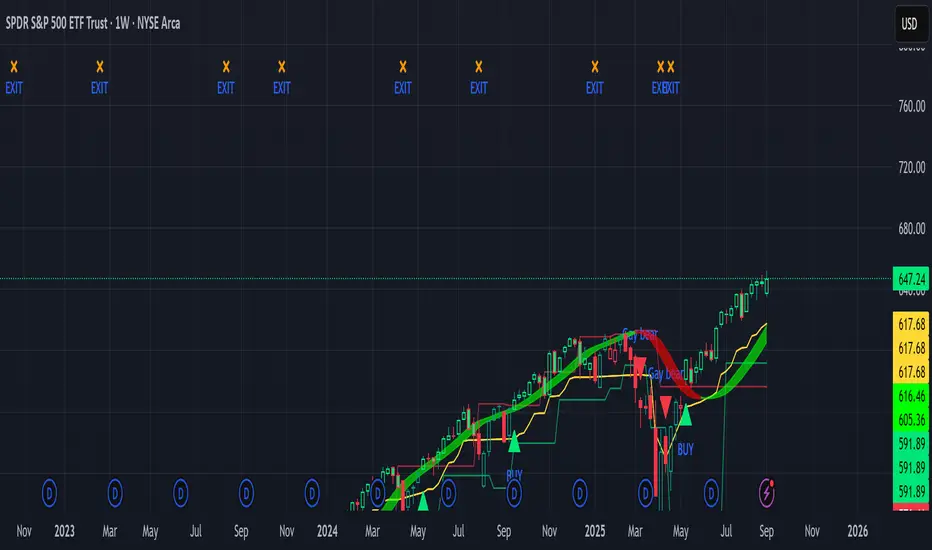
Sniper Swing — Short TF (Clean Signals) [v6]📘 How to Use the Sniper Swing Indicator
1. What It Does
It looks for short-term swing breaks in price.
It uses an oscillator (RSI/Stoch) and swing pivots to confirm moves.
It gives you 3 clear signals only:
BUY → Enter long (expecting price to go up).
Gay bear → Enter short (expecting price to go down).
EXIT → Close your trade (long or short).
Candles also change color:
Green = in a BUY trade.
Red = in a Gay bear trade.
Neutral (gray/none) = no trade.
2. When to Use
Works best on short timeframes (1m–5m) for scalping/intraday.
Use on liquid markets (MES/ES, NQ, SPY, BTC, ETH).
Avoid dead hours with no volume (like overnight futures lull or midday chop).
3. How to Trade With It
A. BUY trade
Wait for a BUY triangle below the candle.
Confirm:
Candle turned green.
Price broke a recent swing high.
Oscillator shows strength (indicator does this for you).
Enter long at the close of that candle.
Place your stop-loss:
At the yellow stop line (auto trailing stop), or
Just below the last swing low.
Stay in while candles are green.
Exit when:
An orange X appears, or
Price hits your stop.
B. Gay bear (short) trade
Wait for a Gay bear triangle above the candle.
Confirm:
Candle turned red.
Price broke a recent swing low.
Oscillator shows weakness.
Enter short at the close of that candle.
Place stop-loss:
At the yellow stop line, or
Just above the last swing high.
Stay in while candles are red.
Exit on an orange X or stop hit.
4. Pro Tips for New Traders
Only take one signal at a time → don’t double dip.
Quality > Quantity: ignore weak, sideways markets. Best signals happen during trends.
Start small: trade micros (MES) or small position sizes.
Use alerts: set TradingView alerts for BUY/Gay bear/EXIT so you don’t miss setups.
Think of the indicator like a navigator: it tells you the likely path, but you’re the driver → always manage risk.
5. Quick Mental Checklist
Signal? (BUY or Gay bear triangle)
Confirmed? (candle color + swing break)
Enter? (on close)
Stop? (yellow line or swing)
Exit? (orange X or stop)
ICT FVG Buy/Sell SignalsThis bot is built on ICT (Inner Circle Trader) concepts such as:
Fair Value Gaps (FVGs) – imbalance zones between candles.
Consequent Encroachment (CE) – the midpoint of a gap.
Premium / Discount Arrays – dealing ranges split into premium (sell-side) and discount (buy-side) zones.
Displacement candles – strong impulsive moves that confirm intent.
The bot scans for FVGs, marks CE levels, and waits for price to return to these levels.
When price revisits a valid FVG zone with displacement confirmation and in the correct PD array, the bot generates a BUY or SELL signal.
✅ Signal Rules
Buy Signal
Price trades back into a Bullish FVG.
Current bar shows bullish displacement (large bullish body relative to ATR).
Price is in discount territory of the current dealing range (if PD filter is enabled).
Close is above the CE line of the FVG.
Sell Signal
Price trades back into a Bearish FVG.
Current bar shows bearish displacement.
Price is in premium territory of the current dealing range.
Close is below the CE line of the FVG.
🎯 What You’ll See on the Chart
Green “BUY” labels below candles when long signals trigger.
Red “SELL” labels above candles when short signals trigger.
Shaded background:
Red = Premium zone (sell side).
Teal = Discount zone (buy side).
Yellow line = dealing range midpoint (equilibrium).
Dots on CE lines = midpoints of the latest bullish/bearish FVG.
🔔 Alerts
ICT Buy → Triggers when a bullish setup confirms.
ICT Sell → Triggers when a bearish setup confirms.
You can connect these alerts to:
TradingView notifications.
Webhooks (for brokers or bots like MetaTrader, NinjaTrader, or Discord).
⚙️ Settings
Swing length – how many bars to use when detecting swing highs/lows for the dealing range.
Use PD filter – toggle ON/OFF for requiring discount/premium alignment.
Displacement ATR multiple – how strong the candle body must be compared to ATR to count as a displacement.
ATR length – used for displacement filter.
📈 Supported Markets
Works on all symbols and timeframes.
Commonly applied to:
NASDAQ (NQ, QQQ)
S&P500 (ES, SPX, SPY)
Forex pairs
Crypto (BTC, ETH, etc.)
⚠️ Disclaimer
This bot is for educational purposes only. It does not guarantee profits and should be tested on demo accounts first.
Always apply proper risk management before trading live.

Futures Multi-Asset Open Distance Table## Multi-Asset Open Distance Table - Quick Description
This Pine Script indicator displays a **real-time table** that tracks how far **three user-selected assets** are from their key opening price levels.
**What it shows:**
- **Three customizable assets** (default: NQ!, ES!, YM!)
- **Distance from 3 key opens** for each asset:
- **1800 ET Open** (Electronic trading session start)
- **0930 ET Open** (Regular market hours start)
- **Weekly Open** (Beginning of trading week)
**Visual features:**
- **Percentage changes** from each open level
- **Color coding**: Green for gains above opens, red for losses below opens
- **Direction arrows**: ▲ (above), ▼ (below), ■ (unchanged)
- **Customizable table position** and size
**Perfect for:**
- **Intraday traders** monitoring key session levels
- **Multi-timeframe analysis** across different market opens
- **Quick reference** to see which assets are performing relative to major opening levels
- **Session-based trading strategies** using 6PM and 9:30AM opens
The table updates in real-time and provides an at-a-glance view of where your chosen assets stand relative to these critical price reference points throughout the trading day.

Futures Confluence Delta (FCD) - Histogram
The Futures Confluence Delta (FCD) Histogram is a powerful trend-following indicator tailored for scalping futures on 1-minute charts. Displayed in a bottom panel like RSI or volume, it visualizes cumulative volume delta to identify bullish or bearish market momentum. The histogram turns green for positive delta (buying pressure, suggesting a long trend) and red for negative delta (selling pressure, indicating a short trend), providing quick insight into market direction.
This indicator is ideal for futures traders seeking confluence with other tools, such as VWMA or order block strategies. It uses a simple yet effective delta calculation (buy volume for up candles, sell volume for down candles, smoothed with EMA) to highlight trend strength, making it perfect for fast-paced scalping environments.
Key Features:
Cumulative Delta Histogram: Tracks buying vs. selling pressure, smoothed with an EMA for clarity.
Color-Coded Trend Signals: Green for bullish (long) trends, red for bearish (short) trends.
Customizable Settings: Adjust the delta lookback period and enable/disable daily reset for flexibility.
Optimized for 1-minute charts on futures.
Alert Support: Set alerts for trend changes to stay ahead of market shifts.
How to Use:
Add the indicator to your 1-minute chart. Observe the histogram in the bottom panel:
Green bars (positive delta) suggest a bullish trend, favoring long entries.
Red bars (negative delta) indicate a bearish trend, favoring short entries.
Combine with other indicators (e.g., VWMA, order blocks, or FVGs) for confluence.
Set alerts for trend changes via the FCD Long Trend or FCD Short Trend conditions.
Adjust settings (delta lookback, daily reset) to match your trading style.
Settings:
Delta Lookback Period (default: 14): Controls the EMA smoothing of the delta. Lower values increase sensitivity; higher values smooth trends.
Reset Delta Daily (default: true): Resets cumulative delta at the start of each trading day for futures session alignment.
Long Color (default: green): Color for bullish delta.
Short Color (default: red): Color for bearish delta.
Notes:
Ensure sufficient historical data (500+ bars) for accurate delta calculations.
Test on NQ for higher volatility, as it may show stronger delta signals compared to GC or ES.
Check the Pine Logs pane (“More” > “Pine Logs”) for any NA data issues if the histogram doesn’t display.
Share your feedback or suggestions in the comments!

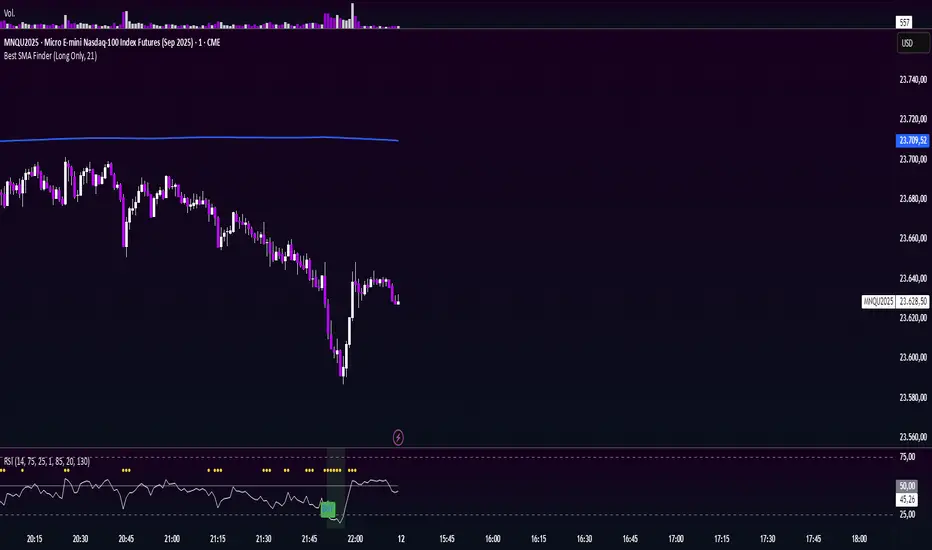
Globex Trap w/ percentage [SLICKRICK]Globex Trap w/ Percentage
Overview
The Globex Trap w/ Percentage indicator is a powerful tool designed to help traders identify high-probability trading opportunities by analyzing price action during the Globex (overnight) session and regular trading hours. By combining Globex session ranges with Supply & Demand zones, this indicator highlights potential "trap" areas where significant price reactions may occur. Additionally, it calculates the Globex session range as a percentage of the daily Average True Range (ATR), providing valuable context for assessing market volatility.
This indicator is ideal for traders in futures markets or other instruments traded during Globex sessions, offering a visual and analytical edge for spotting key price levels and potential reversals or breakouts.
Key Features
Globex Session Tracking:
Visualizes the high and low of the Globex session (default: 3:00 PM to 6:30 AM PST) with customizable time settings.
Displays a semi-transparent box to mark the Globex range, with labels for "Globex High" and "Globex Low."
Calculates the Globex range as a percentage of the daily ATR, displayed as a label for quick reference.
Supply & Demand Zones:
Identifies Supply & Demand zones during regular trading hours (default: 6:00 AM to 8:00 AM PST) with customizable time settings.
Draws semi-transparent boxes to highlight these zones, aiding in the identification of key support and resistance areas.
Trap Area Identification:
Highlights potential trap zones where Globex ranges and Supply & Demand zones overlap, indicating areas where price may reverse or consolidate due to trapped traders.
Customizable Settings:
Adjust Globex and Supply & Demand session times to suit your trading preferences.
Toggle visibility of Globex and Supply & Demand zones independently.
Customize box colors for better chart readability.
Set the lookback period (default: 10 days) to control how many historical zones are displayed.
Configure the ATR length (default: 14) for the percentage calculation.
PST Timezone Default:
All times are based on Pacific Standard Time (PST) by default, ensuring accurate session tracking for users in this timezone or those aligning with U.S. West Coast market hours.
Recommended Usage
Timeframes: Best used on 1-hour charts or lower (e.g., 15-minute, 5-minute) for precise entry and exit points.
Markets: Optimized for futures (e.g., ES, NQ, CL) and other instruments traded during Globex sessions.
Historical Data: Ensure at least 10 days of historical data for optimal visualization of zones.
Strategy Integration: Use the indicator to identify potential reversals or breakouts at Globex highs/lows or Supply & Demand zones. The ATR percentage provides context for whether the Globex range is significant relative to typical daily volatility.
How It Works
Globex Session:
Tracks the high and low prices during the user-defined Globex session (default: 3:00 PM to 6:30 AM PST).
When the session ends, a box is drawn from the start to the end of the session, capturing the high and low prices.
Labels are placed at the midpoint of the session, showing "Globex High," "Globex Low," and the range as a percentage of the daily ATR (e.g., "75.23% of Daily ATR").
Supply & Demand Zones:
Tracks the high and low prices during the user-defined regular trading hours (default: 6:00 AM to 8:00 AM PST).
Draws a box to mark these zones, which often act as key support or resistance levels.
ATR Percentage:
Calculates the Globex range (high minus low) and divides it by the daily ATR to express it as a percentage.
This metric helps traders gauge whether the overnight price movement is significant compared to the instrument’s typical volatility.
Time Handling:
Uses PST (UTC-8) for all time calculations, ensuring accurate session timing for users aligning with this timezone.
Properly handles overnight sessions that cross midnight, ensuring seamless tracking.
Input Settings
Globex Session Settings:
Show Globex Session: Enable/disable Globex session visualization (default: true).
Globex Start/End Time: Set the start and end times for the Globex session (default: 3:00 PM to 6:30 AM PST).
Globex Box Color: Customize the color of the Globex session box (default: semi-transparent gray).
Supply & Demand Zone Settings:
Show Supply & Demand Zone: Enable/disable zone visualization (default: true).
Zone Start/End Time: Set the start and end times for Supply & Demand zones (default: 6:00 AM to 8:00 AM PST).
Zone Box Color: Customize the color of the zone box (default: semi-transparent aqua).
General Settings:
Days to Look Back: Number of historical days to display zones (default: 10).
ATR Length: Period for calculating the daily ATR (default: 14).
Notes
All times are in Pacific Standard Time (PST). Adjust the start and end times if your market operates in a different timezone or if you prefer different session windows.
The indicator is optimized for instruments with active Globex sessions, such as futures. Results may vary for non-24/5 markets.
A typo in the label "Globe Low" (should be "Globex Low") will be corrected in future updates.
Ensure your TradingView chart is set to display sufficient historical data to view the full lookback period.
Why Use This Indicator?
The Globex Trap w/ Percentage indicator provides a unique combination of session-based range analysis, Supply & Demand zone identification, and volatility context via the ATR percentage. Whether you’re a day trader, swing trader, or scalper, this tool helps you:
Pinpoint key price levels where institutional traders may act.
Assess the significance of overnight price movements relative to daily volatility.
Identify potential trap zones for high-probability setups.
Customize the indicator to fit your trading style and market preferences.

Smart Money Precision Structure [BullByte]Smart Money Precision Structure
Advanced Market Structure Analysis Using Institutional Order Flow Concepts
---
OVERVIEW
Smart Money Precision Structure (SMPS) is a comprehensive market analysis indicator that combines six analytical frameworks to identify high-probability market structure patterns. The indicator uses multi-dimensional scoring algorithms to evaluate market conditions through institutional order flow concepts, providing traders with professional-grade market analysis.
---
PURPOSE AND ORIGINALITY
Why This Indicator Was Developed
• Addresses the gap between retail and institutional analysis methods
• Consolidates multiple analysis techniques that professionals use separately
• Automates complex market structure evaluation into actionable insights
• Eliminates the need for multiple indicators by providing comprehensive analysis
What Makes SMPS Original
• Six-Layer Confluence System - Unique combination of market regime, structure, volume flow, momentum, price action, and adaptive filtering
• Institutional Pattern Recognition - Identifies smart money accumulation and distribution patterns
• Adaptive Intelligence - Parameters automatically adjust based on detected market conditions
• Real-Time Market Scoring - Proprietary algorithm rates market quality from 0-100%
• Structure Break Detection - Advanced pivot analysis identifies trend reversals early
---
HOW IT WORKS - TECHNICAL METHODOLOGY
1. Market Regime Analysis Engine
The indicator evaluates five core market dimensions:
• Volatility Score - Measures current volatility against 50-period historical baseline
• Trend Score - Analyzes alignment between 8, 21, and 50-period EMAs
• Momentum Score - Combines RSI divergence with MACD signal alignment
• Structure Score - Evaluates pivot point formation clarity
• Efficiency Score - Calculates directional movement efficiency ratio
These scores combine to classify markets into five regimes:
• TRENDING - Strong directional movement with aligned indicators
• RANGING - Sideways movement with mixed directional signals
• VOLATILE - Elevated volatility with unpredictable price swings
• QUIET - Low volatility consolidation periods
• TRANSITIONAL - Market shifting between different regimes
2. Market Structure Analysis
Advanced pivot point analysis identifies:
• Higher Highs and Higher Lows for bullish structure
• Lower Highs and Lower Lows for bearish structure
• Structure breaks when established patterns fail
• Dynamic support and resistance from recent pivot points
• Key level proximity detection using ATR-based buffers
3. Volume Flow Decoding
Institutional activity detection through:
• Volume surge identification when volume exceeds 2x average
• Buy versus sell pressure analysis using price-volume correlation
• Flow strength measurement through directional volume consistency
• Divergence detection between volume and price movements
• Institutional threshold alerts when unusual volume patterns emerge
4. Multi-Period Momentum Synthesis
Weighted momentum calculation across four timeframes:
• 1-period momentum weighted at 40%
• 3-period momentum weighted at 30%
• 5-period momentum weighted at 20%
• 8-period momentum weighted at 10%
Result smoothed with 6-period EMA for noise reduction.
5. Price Action Quality Assessment
Each bar evaluated for:
• Range quality relative to 20-period average
• Body-to-range ratio for directional conviction
• Wick analysis for rejection pattern identification
• Pattern recognition including engulfing and hammer formations
• Sequential price movement analysis
6. Adaptive Parameter System
Parameters automatically adjust based on detected regime:
• Trending markets reduce sensitivity and confirmation requirements
• Volatile markets increase filtering and require additional confirmations
• Ranging markets maintain neutral settings
• Transitional markets use moderate adjustments
---
COMPLETE SETTINGS GUIDE
Section 1: Core Analysis Settings
Analysis Sensitivity (0.3-2.0)
• Default: 1.0
• Lower values require stronger price movements
• Higher values detect more subtle patterns
• Scalpers use 0.8-1.2, swing traders use 1.5-2.0
Noise Reduction Level (2-7)
• Default: 4
• Controls filtering of false patterns
• Higher values reduce pattern frequency
• Increase in volatile markets
Minimum Move % (0.05-0.50)
• Default: 0.15%
• Sets minimum price movement threshold
• Adjust based on instrument volatility
• Forex: 0.05-0.10%, Stocks: 0.15-0.25%, Crypto: 0.20-0.50%
High Confirmation Mode
• Default: True (Enabled)
• Requires all technical conditions to align
• Reduces frequency but increases reliability
• Disable for more aggressive pattern detection
Section 2: Market Regime Detection
Enable Regime Analysis
• Default: True (Enabled)
• Activates market environment evaluation
• Essential for adaptive features
• Keep enabled for best results
Regime Analysis Period (20-100)
• Default: 50 bars
• Determines regime calculation lookback
• Shorter for responsive, longer for stable
• Scalping: 20-30, Swing: 75-100
Minimum Market Clarity (0.2-0.8)
• Default: 0.4
• Quality threshold for pattern generation
• Higher values require clearer conditions
• Lower for more patterns, higher for quality
Adaptive Parameter Adjustment
• Default: True (Enabled)
• Enables automatic parameter optimization
• Adjusts based on market regime
• Highly recommended to keep enabled
Section 3: Market Structure Analysis
Enable Structure Validation
• Default: True (Enabled)
• Validates patterns against support/resistance
• Confirms trend structure alignment
• Essential for reliability
Structure Analysis Period (15-50)
• Default: 30 bars
• Period for structure pattern analysis
• Affects support/resistance calculation
• Match to your trading timeframe
Minimum Structure Alignment (0.3-0.8)
• Default: 0.5
• Required structure score for valid patterns
• Higher values need stronger structure
• Balance with desired frequency
Section 4: Analysis Configuration
Minimum Strength Level (3-5)
• Default: 4
• Minimum confirmations for pattern display
• 5 = Maximum reliability, 3 = More patterns
• Beginners should use 4-5
Required Technical Confirmations (4-6)
• Default: 5
• Number of aligned technical factors
• Higher = fewer but better patterns
• Works with High Confirmation Mode
Pattern Separation (3-20 bars)
• Default: 8 bars
• Minimum bars between patterns
• Prevents clustering and overtrading
• Increase for cleaner charts
Section 5: Technical Filters
Momentum Validation
• Default: True (Enabled)
• Requires momentum alignment
• Filters counter-trend patterns
• Essential for trend following
Volume Confluence Analysis
• Default: True (Enabled)
• Requires volume confirmation
• Identifies institutional participation
• Critical for reliability
Trend Direction Filter
• Default: True (Enabled)
• Only shows patterns with trend
• Reduces counter-trend signals
• Disable for reversal hunting
Section 6: Volume Flow Analysis
Institutional Activity Threshold (1.2-3.5)
• Default: 2.0
• Multiplier for unusual volume detection
• Lower finds more institutional activity
• Stock: 2.0-2.5, Forex: 1.5-2.0, Crypto: 2.5-3.5
Volume Surge Multiplier (1.8-4.5)
• Default: 2.5
• Defines significant volume increases
• Adjust per instrument characteristics
• Higher for stocks, lower for forex
Volume Flow Period (12-35)
• Default: 18 bars
• Smoothing for volume analysis
• Shorter = responsive, longer = smooth
• Match to timeframe used
Section 7: Analysis Frequency Control
Maximum Analysis Points Per Hour (1-5)
• Default: 3
• Limits pattern frequency
• Prevents overtrading
• Scalpers: 4-5, Swing traders: 1-2
Section 8: Target Level Configuration
Target Calculation Method
• Default: Market Adaptive
• Three modes available:
- Fixed: Uses set point distances
- Dynamic: ATR-based calculations
- Market Adaptive: Structure-based levels
Minimum Target/Risk Ratio (1.0-3.0)
• Default: 1.5
• Minimum acceptable reward vs risk
• Higher filters lower probability setups
• Professional standard: 1.5-2.0
Fixed Mode Settings:
• Fixed Target Distance: 50 points default
• Fixed Invalidation Distance: 30 points default
• Use for consistent instruments
Dynamic Mode Settings:
• Dynamic Target Multiplier: 1.8x ATR default
• Dynamic Invalidation Multiplier: 1.0x ATR default
• Adapts to volatility automatically
Market Adaptive Settings:
• Use Structure Levels: True (default)
• Structure Level Buffer: 0.1% default
• Places levels at actual support/resistance
Section 9: Visual Display Settings
Color Theme Options
• Professional (Teal/Red)
- Bullish: Teal (#26a69a)
- Bearish: Red (#ef5350)
- Neutral: Gray (#78909c)
- Best for: Traditional traders, clean appearance
• Dark (Neon Green/Pink)
- Bullish: Neon Green (#00ff88)
- Bearish: Hot Pink (#ff0044)
- Neutral: Dark Gray (#333333)
- Best for: Dark theme users, high contrast
• Light (Green/Red Classic)
- Bullish: Green (#4caf50)
- Bearish: Red (#f44336)
- Neutral: Light Gray (#9e9e9e)
- Best for: Light backgrounds, traditional colors
• Vibrant (Cyan/Magenta)
- Bullish: Cyan (#00ffff)
- Bearish: Magenta (#ff00ff)
- Neutral: Medium Gray (#888888)
- Best for: High visibility, modern appearance
Dashboard Position
• Options: Top Left, Top Right, Bottom Left, Bottom Right, Middle Left, Middle Right
• Default: Top Right
• Choose based on chart layout preference
Dashboard Size
• Full: Complete information display (desktop)
• Mobile: Compact view for small screens
• Default: Full
Analysis Display Style
• Arrows : Simple directional markers
• Labels : Detailed text information
• Zones : Colored areas showing pattern regions
• Default: Labels (most informative)
Display Options:
• Display Analysis Strength: Shows star rating
• Display Target Levels: Shows target/invalidation lines
• Display Market Regime: Shows regime in pattern labels
---
HOW TO USE SMPS - DETAILED GUIDE
Understanding the Dashboard
Top Row - Header
• SMPS Dashboard title
• VALUE column: Current readings
• STATUS column: Condition assessments
Market Regime Row
• Shows: TRENDING, RANGING, VOLATILE, QUIET, or TRANSITIONAL
• Color coding: Green = Favorable, Red = Caution
• Status: FAVORABLE or CAUTION trading conditions
Market Score Row
• Percentage from 0-100%
• Above 60% = Strong conditions
• 40-60% = Moderate conditions
• Below 40% = Weak conditions
Structure Row
• Direction: BULLISH, BEARISH, or NEUTRAL
• Status: INTACT or BREAK
• Orange BREAK indicates structure failure
Volume Flow Row
• Direction: BUYING or SELLING
• Intensity: STRONG or WEAK
• Color indicates dominant pressure
Momentum Row
• Numerical momentum value
• Positive = Upward pressure
• Negative = Downward pressure
Volume Status Row
• INST = Institutional activity detected
• HIGH = Above average volume
• NORM = Normal volume levels
Adaptive Mode Row
• ACTIVE = Parameters adjusting
• STATIC = Fixed parameters
• Shows required confirmations
Analysis Level Row
• Minimum strength level setting
• Pattern separation in bars
Market State Row
• Current analysis: BULLISH, BEARISH, NEUTRAL
• Shows analysis price level when active
T:R Ratio Row
• Current target to risk ratio
• GOOD = Meets minimum requirement
• LOW = Below minimum threshold
Strength Row
• BULL or BEAR dominance
• Numerical strength value 0-100
Price Row
• Current price
• Percentage change
Last Analysis Row
• Previous pattern direction
• Bars since last pattern
Reading Pattern Signals
Bullish Structure Pattern
• Upward triangle or "Bullish Structure" label
• Star rating shows strength (★★★★★ = strongest)
• Green line = potential target level
• Red dashed line = invalidation level
• Appears below price bars
Bearish Structure Pattern
• Downward triangle or "Bearish Structure" label
• Star rating indicates reliability
• Green line = potential target level
• Red dashed line = invalidation level
• Appears above price bars
Pattern Strength Interpretation
• ★★★★★ = 6 confirmations (exceptional)
• ★★★★☆ = 5 confirmations (strong)
• ★★★☆☆ = 4 confirmations (moderate)
• ★★☆☆☆ = 3 confirmations (minimum)
• Below minimum = filtered out
Visual Elements on Chart
Lines and Levels:
• Gray Line = 21 EMA trend reference
• Green Stepline = Dynamic support level
• Red Stepline = Dynamic resistance level
• Green Solid Line = Active target level
• Red Dashed Line = Active invalidation level
Pattern Markers:
• Triangles = Arrow display mode
• Text Labels = Label display mode
• Colored Boxes = Zone display mode
Target Completion Labels:
• "Target" = Price reached target level
• "Invalid" = Pattern invalidated by price
---
RECOMMENDED USAGE BY TIMEFRAME
1-Minute Charts (Scalping)
• Sensitivity: 0.8-1.2
• Noise Reduction: 3-4
• Pattern Separation: 3-5 bars
• High Confirmation: Optional
• Best for: Quick intraday moves
5-Minute Charts (Precision Intraday)
• Sensitivity: 1.0 (default)
• Noise Reduction: 4 (default)
• Pattern Separation: 8 bars
• High Confirmation: Enabled
• Best for: Day trading
15-Minute Charts (Short Swing)
• Sensitivity: 1.0-1.5
• Noise Reduction: 4-5
• Pattern Separation: 10-12 bars
• High Confirmation: Enabled
• Best for: Intraday swings
30-Minute to 1-Hour (Position Trading)
• Sensitivity: 1.5-2.0
• Noise Reduction: 5-7
• Pattern Separation: 15-20 bars
• Regime Period: 75-100
• Best for: Multi-day positions
Daily Charts (Swing Trading)
• Sensitivity: 1.8-2.0
• Noise Reduction: 6-7
• Pattern Separation: 20 bars
• All filters enabled
• Best for: Long-term analysis
---
MARKET-SPECIFIC SETTINGS
Forex Pairs
• Minimum Move: 0.05-0.10%
• Institutional Threshold: 1.5-2.0
• Volume Surge: 1.8-2.2
• Target Mode: Dynamic or Market Adaptive
Stock Indices (ES, NQ, YM)
• Minimum Move: 0.10-0.15%
• Institutional Threshold: 2.0-2.5
• Volume Surge: 2.5-3.0
• Target Mode: Market Adaptive
Individual Stocks
• Minimum Move: 0.15-0.25%
• Institutional Threshold: 2.0-2.5
• Volume Surge: 2.5-3.5
• Target Mode: Dynamic
Cryptocurrency
• Minimum Move: 0.20-0.50%
• Institutional Threshold: 2.5-3.5
• Volume Surge: 3.0-4.5
• Target Mode: Dynamic
• Increase noise reduction
---
PRACTICAL APPLICATION EXAMPLES
Example 1: Strong Trending Market
Dashboard Reading:
• Market Regime: TRENDING
• Market Score: 75%
• Structure: BULLISH, INTACT
• Volume Flow: BUYING, STRONG
• Momentum: +0.45
Interpretation:
• Strong uptrend environment
• Institutional buying present
• Look for bullish patterns as continuation
• Higher probability of success
• Consider using lower sensitivity
Example 2: Range-Bound Conditions
Dashboard Reading:
• Market Regime: RANGING
• Market Score: 35%
• Structure: NEUTRAL
• Volume Flow: SELLING, WEAK
• Momentum: -0.05
Interpretation:
• No clear direction
• Low opportunity environment
• Patterns are less reliable
• Consider waiting for regime change
• Or switch to a range-trading approach
Example 3: Structure Break Alert
Dashboard Reading:
• Previous: BULLISH structure
• Current: Structure BREAK
• Volume: INST flag active
• Momentum: Shifting negative
Interpretation:
• Trend reversal potentially beginning
• Institutional participation detected
• Watch for bearish pattern confirmation
• Adjust bias accordingly
• Increase caution on long positions
Example 4: Volatile Market
Dashboard Reading:
• Market Regime: VOLATILE
• Market Score: 45%
• Adaptive Mode: ACTIVE
• Confirmations: Increased to 6
Interpretation:
• Choppy conditions
• Parameters auto-adjusted
• Fewer but higher quality patterns
• Wider stops may be needed
• Consider reducing position size
Below are a few chart examples of the Smart Money Precision Structure (SMPS) indicator in action.
• Example 1 – Bullish Structure Detection on SOLUSD 5m
• Example 2 – Bearish Structure Detected with Strong Confluence on SOLUSD 5m
---
TROUBLESHOOTING GUIDE
No Patterns Appearing
Check these settings:
• High Confirmation Mode may be too restrictive
• Minimum Strength Level may be too high
• Market Clarity threshold may be too high
• Regime filter may be blocking patterns
• Try increasing sensitivity
Too Many Patterns
Adjust these settings:
• Enable High Confirmation Mode
• Increase Minimum Strength Level to 5
• Increase Pattern Separation
• Reduce Sensitivity below 1.0
• Enable all technical filters
Dashboard Shows "CAUTION"
This indicates:
• Market conditions are unfavorable
• Regime is RANGING or QUIET
• Market score is low
• Consider waiting for better conditions
• Or adjust expectations accordingly
Patterns Not Reaching Targets
Consider:
• Market may be choppy
• Volatility may have changed
• Try Dynamic target mode
• Reduce target/risk ratio requirement
• Check if regime is VOLATILE
---
ALERTS CONFIGURATION
Alert Message Format
Alerts include:
• Pattern type (Bullish/Bearish)
• Strength rating
• Market regime
• Analysis price level
• Target and invalidation levels
• Strength percentage
• Target/Risk ratio
• Educational disclaimer
Setting Up Alerts
• Click Alert button on TradingView
• Select SMPS indicator
• Choose alert frequency
• Customize message if desired
• Alerts fire on pattern detection
---
DATA WINDOW INFORMATION
The Data Window displays:
• Market Regime Score (0-100)
• Market Structure Bias (-1 to +1)
• Bullish Strength (0-100)
• Bearish Strength (0-100)
• Bull Target/Risk Ratio
• Bear Target/Risk Ratio
• Relative Volume
• Momentum Value
• Volume Flow Strength
• Bull Confirmations Count
• Bear Confirmations Count
---
BEST PRACTICES AND TIPS
For Beginners
• Start with default settings
• Use High Confirmation Mode
• Focus on TRENDING regime only
• Paper trade first
• Learn one timeframe thoroughly
For Intermediate Users
• Experiment with sensitivity settings
• Try different target modes
• Use multiple timeframes
• Combine with price action analysis
• Track pattern success rate
For Advanced Users
• Customize per instrument
• Create setting templates
• Use regime information for bias
• Combine with other indicators
• Develop systematic rules
---
IMPORTANT DISCLAIMERS
• This indicator is for educational and informational purposes only
• Not financial advice or a trading system
• Past performance does not guarantee future results
• Trading involves substantial risk of loss
• Always use appropriate risk management
• Verify patterns with additional analysis
• The author is not a registered investment advisor
• No liability accepted for trading losses
---
VERSION NOTES
Version 1.0.0 - Initial Release
• Six-layer confluence system
• Adaptive parameter technology
• Institutional volume detection
• Market regime classification
• Structure break identification
• Real-time dashboard
• Multiple display modes
• Comprehensive settings
## My Final Thoughts
Smart Money Precision Structure represents an advanced approach to market analysis, bringing institutional-grade techniques to retail traders through intelligent automation and multi-dimensional evaluation. By combining six analytical frameworks with adaptive parameter adjustment, SMPS provides comprehensive market intelligence that single indicators cannot achieve.
The indicator serves as an educational tool for understanding how professional traders analyze markets, while providing practical pattern detection for those seeking to improve their technical analysis. Remember that all trading involves risk, and this tool should be used as part of a complete analysis approach, not as a standalone trading system.
- BullByte

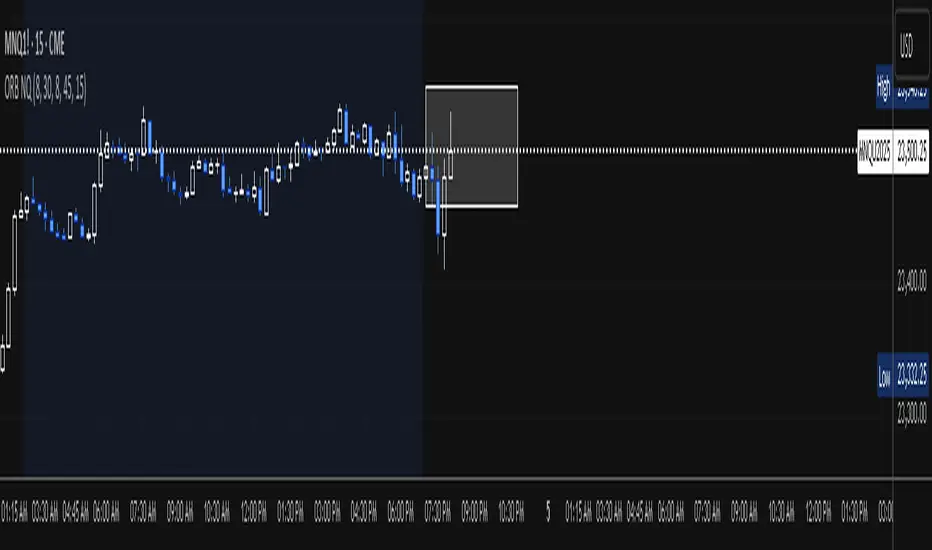
Globex Overnight Futures ORB with FIB's by TenAMTrader📌 Globex Overnight Futures ORB with FIB’s – by TenAMTrader
This indicator is designed for futures traders who want to track the Globex Overnight Opening Range (ORB) and apply Fibonacci projections to anticipate potential support/resistance zones. It’s especially useful for traders who follow overnight sessions (such as ES, NQ, CL) and want to map out key levels before the U.S. regular session begins.
⚙️ How It Works
Primary Range (ORB):
You define a start and end time (default set to 18:00 – 18:15 EST). During this period, the script tracks the session high, low, and midpoint.
Opening Range Plots:
High Line (green)
Low Line (red)
Midpoint Line (yellow)
A shaded cloud between High–Mid and Mid–Low for easy visualization.
Fibonacci Projections:
Once the ORB is complete, the script calculates a full suite of Fibonacci retracements and extensions (e.g., 0.236, 0.382, 0.618, 1.0, 1.618, 2.0).
Standard key levels (0.618, 0.786, 1.0, etc.) are always shown if enabled.
Optional extended levels (1.236, 1.382, 1.5, 2.0, etc.) can be toggled on/off.
"Between Range" fibs (such as 0.382 and 0.618 inside the ORB) are also available for traders who like intra-range precision.
🔧 User Settings
Time Inputs: Choose your ORB start/end time.
Color Controls: Customize high, low, midpoint, and fib line colors.
Display Toggles: Turn on/off High, Low, Midpoint lines and Fibonacci projections.
Fib Extensions Toggle: Decide whether to show only major fibs or all extensions.
Alerts (Optional): Alerts can be set for crossing the ORB High, Low, or Midpoint.
📊 Practical Use Cases
Breakout Traders: Use the ORB high/low as breakout triggers.
Mean Reversion Traders: Watch for rejections near fib extension levels.
Overnight Futures Monitoring: Track Globex behavior to prepare for RTH open.
Risk Management: ORB and Fib levels make for natural stop/target placement zones.
⚠️ Disclaimer
This indicator is provided for educational and informational purposes only. It does not constitute financial advice, investment advice, or trading recommendations. Trading futures involves substantial risk of loss and may not be suitable for all investors. Always do your own due diligence and consult with a licensed financial professional before making trading decisions.

Minimalist RSI - Nasdaq (14) with Volume Filter and AlertsDescription:
This indicator shows the standard RSI (period 14) adapted for Nasdaq, with a clean and minimalist design. It adds visual levels for overbought (75) and oversold (25), plus an optional centerline 50 to better interpret momentum.
It incorporates a high volume visual filter to confirm signals and avoid false entries in low-interest conditions. Buy and sell signals are based on RSI crosses in extreme zones, optionally filtered by volume to improve reliability.
You can enable automatic alerts to receive notifications when important signals occur.
How to use:
Watch the RSI and its position relative to overbought/oversold zones and the 50 line.
Wait for high volume confirmation for greater reliability (you can disable this filter if preferred).
Use buy and sell signals alongside your price action and overall context analysis to make decisions.
Set alerts to not miss opportunities.
Important Notice:
This indicator is a support tool, not a complete strategy. Trading involves risks and no guarantees. Always use risk management and test the indicator on a demo before using it live.
Personal note:
This is my first script and I would love to receive constructive feedback to improve and offer better tools to the community. Thanks for trying it!
Motivational phrase:
“No risk, no reward.”
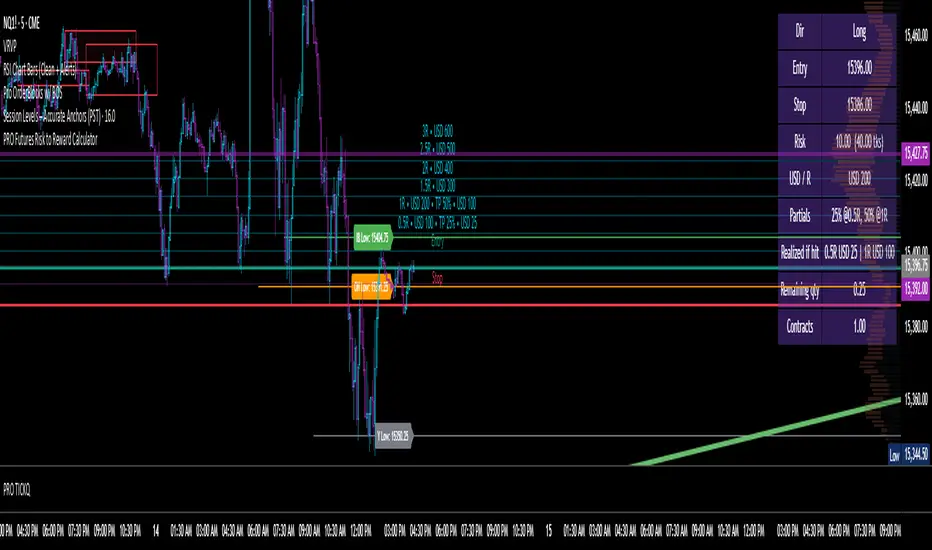
Futures Risk to Reward CalculatorFutures Risk to Reward Calculator with NQ, MNQ, ES, MES, etc price per tick built in.
$TICK & TICKQ Sentiment IndicatorThe USI:TICK & USI:TICKQ Sentiment Indicator is a versatile tool for traders analyzing the NYSE Tick Index ( USI:TICK ) or Nasdaq Tick Index ( USI:TICKQ ) to gauge market sentiment. It provides clear visual signals, a customizable moving average, and statistical insights to identify bullish and bearish conditions in real-time.
Key Features:
Sentiment Signals: Green triangle (▲) labels at a user-defined level (default: +1200) when the Tick closes above zero, and red triangle (▼) labels (default: -1200) when below zero, indicating bullish or bearish sentiment.
Adjustable Moving Average: Plots a customizable moving average (SMA, EMA, WMA, VWMA, SMMA, HullMA) with user-defined length (default: 14) to smooth Tick data and highlight trends.
Close Statistics: Displays the percentage of positive and negative Tick closes over a user-specified lookback period (default: 100) in a customizable table (position and font size adjustable).
Threshold Lines: Includes reference lines at +800/-800 (gold) and +1000/-1000 (red) to mark key Tick levels, plus a zero line (gray, dashed) for context.
Customizable Display: Adjust symbol sizes (tiny, small, normal, large, huge), table position (top-right, top-left, etc.), and table font size for a tailored chart experience.
How to Use:
Apply the indicator to a USI:TICK or USI:TICKQ chart (e.g., TVC:TICK, TVC:TICKQ) on an intraday timeframe (e.g., 1-minute, 5-minute).
In the settings:
Set the TICK Symbol to your broker’s NYSE Tick ( USI:TICK ) or Nasdaq Tick ( USI:TICKQ ) symbol.
Adjust Top Level and Bottom Level (default: +1200/-1200) to position sentiment signals at chart edges.
Set Moving Average Length and Type to suit your analysis.
Configure Lookback Period for close percentage calculations.
Customize Dot Size , Table Position , and Table Font Size for optimal visibility.
Monitor green/red triangles for sentiment, the moving average for trends, and the table for statistical insights.
Notes:
This indicator is designed for both USI:TICK (NYSE Tick) and USI:TICKQ (Nasdaq Tick, NQ Tick), allowing analysis of either market’s breadth.
Ensure your chart’s timeframe supports USI:TICK or USI:TICKQ data.
Adjust Top Level / Bottom Level if symbols don’t appear at chart edges due to scaling.
Labels may stack with frequent signals; contact the developer for customization to limit frequency.
No symbol appears if the Tick closes at 0; a neutral marker can be added upon request.
Ideal For:
Day traders and scalpers using USI:TICK or USI:TICKQ to gauge market breadth.
Analysts seeking customizable visualizations and statistical insights for Tick data.
Created by northfieldwhale.

VWAP-RSI Scalper FINAL v1Description
This script implements a robust, battle-tested intraday scalping strategy designed for prop firm challenges, funded trader programs, and serious futures scalpers.
It combines VWAP, RSI, EMA trend, and ATR-based risk management to capture high-probability mean reversion and momentum moves during the most liquid hours of the trading day.
Core Logic
RSI (Relative Strength Index):
Trades are triggered when the RSI is either oversold or overbought using a short lookback (default: 3). This ensures only the strongest intraday reversals or exhaustion moves are considered.
VWAP Filter:
Longs are only taken above VWAP, shorts only below VWAP, aligning trades with the session’s dominant bias.
EMA Filter:
Additional trend quality filter—longs require price above EMA, shorts below EMA.
Session Control:
Only trades between user-defined session hours (default: US cash session), eliminating overnight/illiquid action.
ATR-based Dynamic Stops & Targets:
Every trade uses a stop loss at 1x ATR and a take profit at 2x ATR for a positive risk/reward ratio.
Max Trades Per Day:
Prevents overtrading and controls risk exposure (default: 3).
Performance (Sample Backtest)
Profit Factor: 1.37+ (prop-firm quality)
Drawdown: <1% (very conservative risk)
Win Rate: 37–48% (RR > 1, so high edge)
Consistency: Smooth, steady equity curve over hundreds of trades.
Best For:
ES/NQ/CL/GC intraday traders
Prop firm evaluation challenges (Tradeify, Topstep, Apex, etc.)
Anyone needing robust, no-nonsense systematic edge for futures or indices.
How to Use & Tune
Apply to 3min, 5min, or 15min charts of liquid futures or indices.
Change parameters in the settings panel to suit your asset, volatility, or session hours.
Use “Strategy Tester” to validate P&L, win rate, and drawdown.
How to Optimize
Raise/lower RSI length or bands to make signals more/less frequent.
Adjust stop/target multiples for your preferred risk/reward profile.
Change session hours to match your broker or market.
Disclaimer
This is not financial advice. Use on a demo or sim account first. Results will vary by market, slippage, and execution speed. Past performance does not guarantee future results.
If you find this useful, please give it a like, follow for more strategies, and comment your results or questions!
Good luck and safe trading!

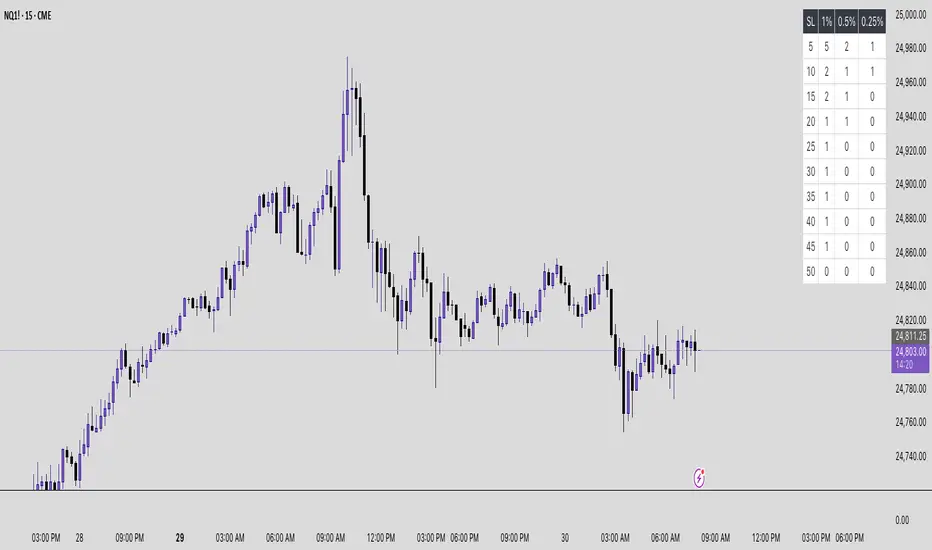
Futures Risk Contract TableFutures risk table for NQ MNQ YM MYM ES and MES
changeable capital and risk percentage along with points.
SITFX_FuturesSpec_v17SITFX_FuturesSpec_v17 – Universal Futures Contract Library
Full-scale futures contract specification library for Pine Script v6. Covers CME, CBOT, NYMEX, COMEX, CFE, Eurex, ICE, and more – including minis, micros, metals, energies, FX, and bonds.
Key Features:
✅ Instrument‑agnostic: ES/MES, NQ/MNQ, YM/MYM, RTY/M2K, metals, energies, FX, bonds
✅ Full contract data: Tick size, tick value, point value, margins
✅ Continuation‑safe: Single‑line logic, no arrays or continuation errors
✅ Foundation for SITFX tools: Gann, Fibs, structure, and risk modules
Usage example:
import SITFX_FuturesSpec_v17/1 as fs
spec = fs.get(syminfo.root)
label.new(bar_index, high, str.format("{0}: Tick={1}, Value=${2}", spec.name, spec.tickSize, spec.tickValue))

Breakout + Retest StrategyThe Breakout + Retest Strategy is a proven price action approach used by professional traders to catch high-probability market moves after key levels are broken. This strategy aims to enter the market after confirmation — reducing false breakouts and improving entry accuracy.
🔍 Strategy Logic:
Identify a Key Support or Resistance Level
These could be recent swing highs/lows, consolidation zones, or session highs.
Wait for a Clean Breakout
Price must decisively break above resistance or below support with strong momentum.
Watch for the Retest
After the breakout, wait for the price to pull back to the broken level (now flipped support/resistance).
Enter on Retest Confirmation
Look for signs like rejection wicks, bullish/bearish engulfing candles, or strong volume on the retest.
Set Risk-Managed Stops and Targets
Stop loss goes below (for long) or above (for short) the retested level.
Target is usually set at a 1:2 or higher risk-to-reward ratio, or based on structure.
✅ Why It Works:
Filters out fake breakouts
Uses market structure and liquidity traps to your advantage
Combines both momentum and confirmation
⚙️ Best Timeframes:
15-minute to 1-hour for intraday setups
4-hour and daily for swing trades
📊 Ideal for:
Futures (NQ, ES, Gold)
Forex pairs
Crypto
Stocks near key earnings or breakout zones

Reversal Signal avec TICK + RSIThis indicator is a potential reversal indicator for SCALPING, don't use it for swing. It's base on TICK and on an overbrought/oversold condition of the RSI. You can play with the setting, typicaly I like my TICK to be over reacting an 800/-800 and my rsi over 20 and 80, but it give not enough signal. So I set the TICK signal at 651/-651 and the RSI at 25/75. This indicator is made for SP500 and Nasdaq, so SPY/QQQ/SPX/ES/NQ should work well. It's the first version of it, so maybe I'll add so more data to it to increase signal and lower false one. For now I've test it on live market yet(26/7/25).
The RSI is Fast(5 period), I like to use it on the 1 or 5 min chart.
Please not that it only work during 9h30am to 4pm EST.(Because of the TICK)
Feel free to try and even comment. Don't be harsh on me, it's my first try!
(Sorry for my 'english' it's not my first language)
FAUCON