SMT Oscillator: Smarter Money Divergence Detector [PhenLabs]📊Phenlabs - SMT Oscillator: Smarter Money Divergence Detector
Version: PineScript™v6
📌Description
The SMT Oscillator is a sophisticated tool designed to identify smart money divergence between two correlated assets. By analyzing the momentum and volume-weighted price action of a primary and secondary symbol, traders can spot subtle shifts in market dynamics that often precede significant price movements. This indicator is built to provide a clearer, more filtered view of inter-market relationships, solving the common problem of false signals and market noise. Its primary purpose is to equip traders with a quantifiable edge in detecting potential reversals or continuations that are not obvious on a standard price chart.
🚀Points of Innovation
Dual-Symbol Divergence Core: Directly compares momentum (RSI or MACD) between two user-selected symbols to pinpoint true SMT divergence.
Volume-Weighted Analysis: Integrates volume delta into the divergence calculation, giving more weight to moves backed by significant market participation.
Entropy Filter for Noise Reduction: Employs an entropy calculation to filter out low-quality signals during choppy or consolidating market conditions.
Predictive Forecast Line: Utilizes a linear regression model to project the oscillator’s future trajectory, offering a forward-looking glimpse of potential momentum shifts.
Customizable Signal Sensitivity: Allows fine-tuning of overbought and oversold levels to adapt to different market volatilities and trading styles.
Integrated Signal Alerts: Provides built-in alerts for bullish/bearish zero crosses and overbought/oversold conditions.
🔧Core Components
Momentum Engine: The user can select either RSI or MACD as the underlying engine for the divergence calculation, allowing for flexibility in analysis.
Normalization Function: Price data from both symbols is normalized using percentage change to ensure a true “apples-to-apples” comparison, regardless of their nominal price differences.
Divergence Calculator: The core algorithm that subtracts the secondary symbol’s momentum from the primary’s and normalizes the result using the combined standard deviation.
Smoothing Mechanism: An Exponential Moving Average (EMA) is applied to the raw oscillator output to reduce choppiness and provide a clearer signal line.
🔥Key Features
Multi-Asset Comparison: Go beyond single-asset analysis by comparing correlated pairs like ES/NQ or BTC/ETH to uncover hidden trading opportunities.
Heatmap Visualization: An optional heatmap mode provides an intuitive visual representation of divergence strength, making it easier to gauge market sentiment at a glance.
Configurable Lookback and Timeframe: Adjust the lookback period and analysis timeframe to suit your specific strategy, from short-term scalping to long-term trend analysis.
Signal Markers: Visual markers are plotted directly on the chart for bullish and bearish zero-line crossovers, providing clear entry and exit signals.
🎨Visualization
SMT Oscillator Line: The primary visual element, colored blue for bullish (positive) divergence and orange for bearish (negative) divergence.
Zero Line: A solid horizontal line at the zero level, indicating the equilibrium point between the two assets. Crossovers of this line signal a shift in relative strength.
Overbought/Oversold Zones: Dotted lines at the +80 and -80 levels (customizable) that highlight extreme divergence readings, often indicating potential exhaustion points.
Forecast Line: A predictive line that plots the anticipated path of the oscillator, giving traders an advanced warning of potential changes in momentum.
📖Usage Guidelines
Setting Categories
Primary Symbol
Default: (Chart Symbol)
Description: The main asset you are analyzing. Leave blank to use the symbol currently on your chart.
Secondary Symbol
Default: CME_MINI:ES1! (used with NASDAQ futures due to inherent heavy correlation
Description: The asset to compare against the primary symbol.
Lookback Period
Default: 14
Range: 8-100
Description: Controls the calculation window for momentum (RSI/MACD). Higher values result in a smoother, less sensitive oscillator.
Divergence Type
Default: RSI
Options: RSI, MACD
Description: Choose the momentum indicator to use for the divergence calculation.
Enable Volume Weighting
Default: true
Description: When enabled, gives more weight to divergence signals that are accompanied by significant volume.
✅Best Use Cases
Identifying high-probability reversal points by spotting divergence in overbought or oversold territory.
Confirming the strength of a trend by observing sustained positive or negative divergence.
Pairs trading by taking a long position on the outperforming asset and a short position on the underperforming one during a divergence.
Risk management by recognizing when a current trend is losing its underlying momentum.
⚠️Limitations
Requires Correlated Assets: The indicator’s effectiveness is highly dependent on the selection of two assets with a known correlation (e.g., ES and NQ).
Not a Standalone System: Divergence signals should be used in conjunction with other forms of analysis (price action, market structure) and not as a complete trading system.
Lagging by Nature: As it is based on moving averages and past price data, the oscillator is inherently lagging and may not capture all rapid price changes.
💡What Makes This Unique
Combined Momentum & Volume: Unlike standard oscillators, it fuses momentum with volume delta for a more robust “Smart Money” perspective.
Noise-Filtering Mechanism: The proprietary entropy filter is a unique feature designed to weed out insignificant market chatter and focus on high-conviction signals.
🔬How It Works
Data Normalization:
The script first normalizes the price data of the two selected symbols into percentage changes. This ensures that the comparison is fair, regardless of the difference in their price scales.
Momentum Calculation:
It then calculates the chosen momentum value (either RSI or MACD histogram) for each of the normalized price series.
Divergence Computation:
The core of the indicator lies in subtracting the momentum of the secondary symbol from the primary one. This raw divergence is then optionally weighted by volume and filtered for market noise (entropy) to produce the final oscillator value.
💡Note:
For best results, use this indicator on adequate timeframes to filter out market noise. Always confirm signals with price action analysis before entering a trade.
在脚本中搜索"RSI MACD"

MTF Dashboard 9 Timeframes + Signals# MTF Dashboard Pro - Multi-Timeframe Confluence Analysis System
## WHAT THIS SCRIPT DOES
This script creates a comprehensive dashboard that simultaneously analyzes market conditions across 9 different timeframes (1m, 5m, 15m, 30m, 1H, 4H, Daily, Weekly, Monthly) using a proprietary confluence scoring methodology. Unlike simple multi-timeframe displays that show individual indicators separately, this script combines trend analysis, momentum, volatility signals, and volume analysis into unified confluence scores for each timeframe.
## WHY THIS COMBINATION IS ORIGINAL AND USEFUL
**The Problem Solved:** Most traders manually check multiple timeframes and struggle to quickly assess overall market bias when different timeframes show conflicting signals. Existing MTF scripts typically display individual indicators without synthesizing them into actionable intelligence.
**The Solution:** This script implements a mathematical confluence algorithm that:
- Weights each indicator's signal strength (trend direction, RSI momentum, MACD volatility, volume analysis)
- Calculates normalized scores across all active timeframes
- Determines overall market bias with statistical confidence levels
- Provides instant visual feedback through color-coded symbols and star ratings
**Unique Features:**
1. **Confluence Scoring Algorithm**: Mathematically combines multiple indicator signals into a single confidence rating per timeframe
2. **Market Bias Engine**: Automatically calculates overall directional bias with percentage strength across all selected timeframes
3. **Dynamic Display System**: Real-time updates with customizable layouts, color schemes, and selective timeframe activation
4. **Statistical Analysis**: Provides bullish/bearish vote counts and overall confluence percentages
## HOW THE SCRIPT WORKS TECHNICALLY
### Core Calculation Methodology:
**1. Trend Analysis (EMA-based):**
- Fast EMA (default: 9) vs Slow EMA (default: 21) crossover analysis
- Returns values: +1 (bullish), -1 (bearish), 0 (neutral)
**2. Momentum Analysis (RSI-based):**
- RSI levels: >70 (strong bullish +2), >50 (bullish +1), <30 (strong bearish -2), <50 (bearish -1)
- Provides overbought/oversold context for trend confirmation
**3. Volatility Analysis (MACD-based):**
- MACD line vs Signal line positioning
- Histogram strength comparison with previous bar
- Combined score considering both direction and momentum strength
**4. Volume Analysis:**
- Current volume vs 20-period moving average
- Thresholds: >150% MA (strong +2), >100% MA (bullish +1), <50% MA (weak -2)
**5. Confluence Calculation:**
```
Confluence Score = (Trend + RSI + MACD + Volume) / 4.0
```
**6. Market Bias Determination:**
- Counts bullish vs bearish signals across all active timeframes
- Calculates bias strength percentage: |Bullish Count - Bearish Count| / Total Active TFs * 100
- Determines overall market direction: BULLISH, BEARISH, or NEUTRAL
### Multi-Timeframe Implementation:
Uses `request.security()` calls to fetch data from each timeframe, ensuring all calculations are performed on the respective timeframe's data rather than current chart timeframe, providing accurate multi-timeframe analysis.
## HOW TO USE THIS SCRIPT
### Initial Setup:
1. **Timeframe Selection**: Enable/disable specific timeframes in "Timeframe Selection" group based on your trading style
2. **Indicator Configuration**: Adjust EMA periods (Fast: 9, Slow: 21), RSI length (14), and MACD settings (12/26/9) to match your analysis preferences
3. **Display Options**: Choose table position, text size, and color scheme for optimal visibility
### Reading the Dashboard:
**Symbol Interpretation:**
- ⬆⬆ = Strong bullish signal (score ≥ 2)
- ⬆ = Bullish signal (score > 0)
- ➡ = Neutral signal (score = 0)
- ⬇ = Bearish signal (score < 0)
- ⬇⬇ = Strong bearish signal (score ≤ -2)
**Confluence Stars:**
- ★★★★★ = Very high confidence (score > 0.75)
- ★★★★☆ = High confidence (score > 0.5)
- ★★★☆☆ = Medium confidence (score > 0.25)
- ★★☆☆☆ = Low confidence (score > 0)
- ★☆☆☆☆ = Very low confidence (score > -0.25)
**Market Bias Section:**
- Shows overall market direction across all active timeframes
- Strength percentage indicates conviction level
- Overall confluence score represents average agreement across timeframes
### Trading Applications:
**Entry Signals:**
- Look for high confluence (4-5 stars) across multiple timeframes in same direction
- Higher timeframe alignment provides stronger signal validation
- Use confluence percentage >75% for high-probability setups
**Risk Management:**
- Lower timeframe conflicts may indicate choppy conditions
- Neutral bias suggests ranging market - adjust position sizing
- Strong bias with high confluence supports larger position sizes
**Timeframe Harmony:**
- Short-term trades: Focus on 1m-1H alignment
- Swing trades: Emphasize 1H-Daily alignment
- Position trades: Prioritize Daily-Monthly confluence
## SCRIPT SETTINGS EXPLANATION
### Dashboard Settings:
- **Table Position**: Choose optimal location (Top Right recommended for most layouts)
- **Text Size**: Adjust based on screen resolution and preferences
- **Color Scheme**: Professional (default), Classic, Vibrant, or Dark themes
- **Background Color/Transparency**: Customize table appearance
### Timeframe Selection:
All timeframes optional - activate based on trading timeframe preference:
- **Lower Timeframes (1m-30m)**: Scalping and day trading
- **Medium Timeframes (1H-4H)**: Swing trading
- **Higher Timeframes (D-M)**: Position trading and long-term bias
### Indicator Parameters:
- **Fast EMA (Default: 9)**: Shorter period for trend sensitivity
- **Slow EMA (Default: 21)**: Longer period for trend confirmation
- **RSI Length (Default: 14)**: Standard momentum calculation period
- **MACD Settings (12/26/9)**: Standard MACD configuration for volatility analysis
### Alert Configuration:
- **Strong Signals**: Alerts when confluence >75% with clear directional bias
- **High Confluence**: Alerts when multiple timeframes strongly agree
- All alerts use `alert.freq_once_per_bar` to prevent spam
## VISUAL FEATURES
### Chart Elements:
- **Background Coloring**: Subtle background tint reflects overall market bias
- **Signal Labels**: Strong buy/sell labels appear on chart during high-confluence signals
- **Clean Presentation**: Dashboard overlays chart without interfering with price action
### Color Coding:
- **Green/Bullish**: Various green shades for positive signals
- **Red/Bearish**: Various red shades for negative signals
- **Gray/Neutral**: Neutral color for conflicting or weak signals
- **Transparency**: Configurable transparency maintains chart readability
## IMPORTANT USAGE NOTES
**Realistic Expectations:**
- This tool provides analysis framework, not trading signals
- Always combine with proper risk management
- Past performance does not guarantee future results
- Market conditions can change rapidly - use appropriate position sizing
**Best Practices:**
- Verify signals with additional analysis methods
- Consider fundamental factors affecting the instrument
- Use appropriate timeframes for your trading style
- Regular parameter optimization may be beneficial for different market conditions
**Limitations:**
- Effectiveness may vary across different instruments and market conditions
- Confluence scoring is mathematical model - not predictive guarantee
- Requires understanding of underlying indicators for optimal use
This script serves as a comprehensive analysis tool for traders who need quick, organized access to multi-timeframe market information with statistical confidence levels.

OpenAI Signal Generator - Enhanced Accuracy# AI-Powered Trading Signal Generator Guide
## Overview
This is an advanced trading signal generator that combines multiple technical indicators using AI-enhanced logic to generate high-accuracy trading signals. The indicator uses a sophisticated combination of RSI, MACD, Bollinger Bands, EMAs, ADX, and volume analysis to provide reliable buy/sell signals with comprehensive market analysis.
## Key Features
### 1. Multi-Indicator Analysis
- **RSI (Relative Strength Index)**
- Length: 14 periods (default)
- Overbought: 70 (default)
- Oversold: 30 (default)
- Used for identifying overbought/oversold conditions
- **MACD (Moving Average Convergence Divergence)**
- Fast Length: 12 (default)
- Slow Length: 26 (default)
- Signal Length: 9 (default)
- Identifies trend direction and momentum
- **Bollinger Bands**
- Length: 20 periods (default)
- Multiplier: 2.0 (default)
- Measures volatility and potential reversal points
- **EMAs (Exponential Moving Averages)**
- Fast EMA: 9 periods (default)
- Slow EMA: 21 periods (default)
- Used for trend confirmation
- **ADX (Average Directional Index)**
- Length: 14 periods (default)
- Threshold: 25 (default)
- Measures trend strength
- **Volume Analysis**
- MA Length: 20 periods (default)
- Threshold: 1.5x average (default)
- Confirms signal strength
### 2. Advanced Features
- **Customizable Signal Frequency**
- Daily
- Weekly
- 4-Hour
- Hourly
- On Every Close
- **Enhanced Filtering**
- EMA crossover confirmation
- ADX trend strength filter
- Volume confirmation
- ATR-based volatility filter
- **Comprehensive Alert System**
- JSON-formatted alerts
- Detailed technical analysis
- Multiple timeframe analysis
- Customizable alert frequency
## How to Use
### 1. Initial Setup
1. Open TradingView and create a new chart
2. Select your preferred trading pair
3. Choose an appropriate timeframe
4. Apply the indicator to your chart
### 2. Configuration
#### Basic Settings
- **Signal Frequency**: Choose how often signals are generated
- Daily: Signals at the start of each day
- Weekly: Signals at the start of each week
- 4-Hour: Signals every 4 hours
- Hourly: Signals every hour
- On Every Close: Signals on every candle close
- **Enable Signals**: Toggle signal generation on/off
- **Include Volume**: Toggle volume analysis on/off
#### Technical Parameters
##### RSI Settings
- Adjust `rsi_length` (default: 14)
- Modify `rsi_overbought` (default: 70)
- Modify `rsi_oversold` (default: 30)
##### EMA Settings
- Fast EMA Length (default: 9)
- Slow EMA Length (default: 21)
##### MACD Settings
- Fast Length (default: 12)
- Slow Length (default: 26)
- Signal Length (default: 9)
##### Bollinger Bands
- Length (default: 20)
- Multiplier (default: 2.0)
##### Enhanced Filters
- ADX Length (default: 14)
- ADX Threshold (default: 25)
- Volume MA Length (default: 20)
- Volume Threshold (default: 1.5)
- ATR Length (default: 14)
- ATR Multiplier (default: 1.5)
### 3. Signal Interpretation
#### Buy Signal Requirements
1. RSI crosses above oversold level (30)
2. Price below lower Bollinger Band
3. MACD histogram increasing
4. Fast EMA above Slow EMA
5. ADX above threshold (25)
6. Volume above threshold (if enabled)
7. Market volatility check (if enabled)
#### Sell Signal Requirements
1. RSI crosses below overbought level (70)
2. Price above upper Bollinger Band
3. MACD histogram decreasing
4. Fast EMA below Slow EMA
5. ADX above threshold (25)
6. Volume above threshold (if enabled)
7. Market volatility check (if enabled)
### 4. Visual Indicators
#### Chart Elements
- **Moving Averages**
- SMA (Blue line)
- Fast EMA (Yellow line)
- Slow EMA (Purple line)
- **Bollinger Bands**
- Upper Band (Green line)
- Middle Band (Orange line)
- Lower Band (Green line)
- **Signal Markers**
- Buy Signals: Green triangles below bars
- Sell Signals: Red triangles above bars
- **Background Colors**
- Light green: Buy signal period
- Light red: Sell signal period
### 5. Alert System
#### Alert Types
1. **Signal Alerts**
- Generated when buy/sell conditions are met
- Includes comprehensive technical analysis
- JSON-formatted for easy integration
2. **Frequency-Based Alerts**
- Daily/Weekly/4-Hour/Hourly/Every Close
- Includes current market conditions
- Technical indicator values
#### Alert Message Format
```json
{
"symbol": "TICKER",
"side": "BUY/SELL/NONE",
"rsi": "value",
"macd": "value",
"signal": "value",
"adx": "value",
"bb_upper": "value",
"bb_middle": "value",
"bb_lower": "value",
"ema_fast": "value",
"ema_slow": "value",
"volume": "value",
"vol_ma": "value",
"atr": "value",
"leverage": 10,
"stop_loss_percent": 2,
"take_profit_percent": 5
}
```
## Best Practices
### 1. Signal Confirmation
- Wait for multiple confirmations
- Consider market conditions
- Check volume confirmation
- Verify trend strength with ADX
### 2. Risk Management
- Use appropriate position sizing
- Implement stop losses (default 2%)
- Set take profit levels (default 5%)
- Monitor market volatility
### 3. Optimization
- Adjust parameters based on:
- Trading pair volatility
- Market conditions
- Timeframe
- Trading style
### 4. Common Mistakes to Avoid
1. Trading without volume confirmation
2. Ignoring ADX trend strength
3. Trading against the trend
4. Not considering market volatility
5. Overtrading on weak signals
## Performance Monitoring
Regularly review:
1. Signal accuracy
2. Win rate
3. Average profit per trade
4. False signal frequency
5. Performance in different market conditions
## Disclaimer
This indicator is for educational purposes only. Past performance is not indicative of future results. Always use proper risk management and trade responsibly. Trading involves significant risk of loss and is not suitable for all investors.

Visually Layered OscillatorVisually Layered Oscillator User's Manual
Visually Layered Oscillator is a multi-oscillator designed to provide an intuitive visualization of RSI, MACD, ADX + DMI, allowing traders to interpret multiple signals at a glance.
It is designed to allow comparison within the same panel while maintaining the inherent meaning of each oscillator and compensating for visual distortion issues caused by size differences.
Component Overview
Item Description
RSI (x10) Displays relative buy/sell strength. Values above 70 are overbought; values below 30 are oversold.
MACD (3,16,10) Momentum indicator showing the difference between moving averages. Consists of lines and histograms
ADX ×50 + DMI Indicates the strength of the trend; ADX determines the strength of the trend and DMI determines whether it is buy/sell dominant.
White background color treatment Removes difficult-to-see grid lines to improve visibility.
🖥️ Screen Example
The panel is divided into the following three layers
mathematica
Copy
Edit
Top: ⬆️ RSI (purple)
Middle: 📈 MACD, Signal, Histogram + Color Fill
Bottom: 📉 ADX × 50, DMI+ / DMI- (Red, Blue, Orange)
TIP: If you zoom in on the indicators at a larger scale, you can see that each indicator is drawn at a different height level and placed in such a way that they do not overlap.
⚙️ Settings
Fast Length: MACD Quick Line Duration (Basic 3)
Slow Length: MACD slow line period (basic 16)
Smoothing: Signal line smoothing value (basic 10)
Notes and Tips
RSI × 10 and ADX × 50 are for visualization purposes only multiplied by multiples of the actual values. It does not affect the calculation and maintains the original RSI/ADX characteristics.
The MACD fill color visually highlights crossing conditions.
The background is treated in full white, making the indicator look clean without grid lines.

Canuck Trading IndicatorOverview
The Canuck Trading Indicator is a versatile, overlay-based technical analysis tool designed to assist traders in identifying potential trading opportunities across various timeframes and market conditions. By combining multiple technical indicators—such as RSI, Bollinger Bands, EMAs, VWAP, MACD, Stochastic RSI, ADX, HMA, and candlestick patterns—the indicator provides clear visual signals for bullish and bearish entries, breakouts, long-term trends, and options strategies like cash-secured puts, straddles/strangles, iron condors, and short squeezes. It also incorporates 20-day and 200-day SMAs to detect Golden/Death Crosses and price positioning relative to these moving averages. A dynamic table displays key metrics, and customizable alerts help traders stay informed of market conditions.
Key Features
Multi-Timeframe Adaptability: Automatically adjusts parameters (e.g., ATR multiplier, ADX period, HMA length) based on the chart's timeframe (minute, hourly, daily, weekly, monthly) for optimal performance.
Comprehensive Signal Generation: Identifies short-term entries, breakouts, long-term bullish trends, and options strategies using a combination of momentum, trend, volatility, and candlestick patterns.
Candlestick Pattern Detection: Recognizes bullish/bearish engulfing, hammer, shooting star, doji, and strong candles for precise entry/exit signals.
Moving Average Analysis: Plots 20-day and 200-day SMAs, detects Golden/Death Crosses, and evaluates price position relative to these averages.
Dynamic Table: Displays real-time metrics, including zone status (bullish, bearish, neutral), RSI, MACD, Stochastic RSI, short/long-term trends, candlestick patterns, ADX, ROC, VWAP slope, and MA positioning.
Customizable Alerts: Over 20 alert conditions for entries, exits, overbought/oversold warnings, and MA crosses, with actionable messages including ticker, price, and suggested strategies.
Visual Clarity: Uses distinct shapes, colors, and sizes to plot signals (e.g., green triangles for bullish entries, red triangles for bearish entries) and overlays key levels like EMA, VWAP, Bollinger Bands, support/resistance, and HMA.
Options Strategy Signals: Suggests opportunities for selling cash-secured puts, straddles/strangles, iron condors, and capitalizing on short squeezes.
How to Use
Add to Chart: Apply the indicator to any TradingView chart by selecting "Canuck Trading Indicator" from the Pine Script library.
Interpret Signals:
Bullish Signals: Green triangles (short-term entry), lime diamonds (breakout), blue circles (long-term entry).
Bearish Signals: Red triangles (short-term entry), maroon diamonds (breakout).
Options Strategies: Purple squares (cash-secured puts), yellow circles (straddles/strangles), orange crosses (iron condors), white arrows (short squeezes).
Exits: X-cross shapes in corresponding colors indicate exit signals.
Monitor: Gray circles suggest holding cash or monitoring for setups.
Review Table: Check the top-right table for real-time metrics, including zone status, RSI, MACD, trends, and MA positioning.
Set Alerts: Configure alerts for specific signals (e.g., "Short-Term Bullish Entry" or "Golden Cross") to receive notifications via TradingView.
Adjust Inputs: Customize input parameters (e.g., RSI period, EMA length, ATR period) to suit your trading style or market conditions.
Input Parameters
The indicator offers a wide range of customizable inputs to fine-tune its behavior:
RSI Period (default: 14): Length for RSI calculation.
RSI Bullish Low/High (default: 35/70): RSI thresholds for bullish signals.
RSI Bearish High (default: 65): RSI threshold for bearish signals.
EMA Period (default: 15): Main EMA length (15 for day trading, 50 for swing).
Short/Long EMA Length (default: 3/20): For momentum oscillator.
T3 Smoothing Length (default: 5): Smooths momentum signals.
Long-Term EMA/RSI Length (default: 20/15): For long-term trend analysis.
Support/Resistance Lookback (default: 5): Periods for support/resistance levels.
MACD Fast/Slow/Signal (default: 12/26/9): MACD parameters.
Bollinger Bands Period/StdDev (default: 15/2): BB settings.
Stochastic RSI Period/Smoothing (default: 14/3/3): Stochastic RSI settings.
Uptrend/Short-Term/Long-Term Lookback (default: 2/2/5): Candles for trend detection.
ATR Period (default: 14): For volatility and price targets.
VWAP Sensitivity (default: 0.1%): Threshold for VWAP-based signals.
Volume Oscillator Period (default: 14): For volume surge detection.
Pattern Detection Threshold (default: 0.3%): Sensitivity for candlestick patterns.
ROC Period (default: 3): Rate of change for momentum.
VWAP Slope Period (default: 5): For VWAP trend analysis.
TradingView Publishing Compliance
Originality: The Canuck Trading Indicator is an original script, combining multiple technical indicators and custom logic to provide unique trading signals. It does not replicate existing public scripts.
No Guaranteed Profits: This indicator is a tool for technical analysis and does not guarantee profits. Trading involves risks, and users should conduct their own research and risk management.
Clear Instructions: The description and usage guide are detailed and accessible, ensuring users understand how to apply the indicator effectively.
No External Dependencies: The script uses only built-in Pine Script functions (e.g., ta.rsi, ta.ema, ta.vwap) and requires no external libraries or data sources.
Performance: The script is optimized for performance, using efficient calculations and adaptive parameters to minimize lag on various timeframes.
Visual Clarity: Signals are plotted with distinct shapes and colors, and the table provides a concise summary of market conditions, enhancing usability.
Limitations and Risks
Market Conditions: The indicator may generate false signals in choppy or low-liquidity markets. Always confirm signals with additional analysis.
Timeframe Sensitivity: Performance varies by timeframe; test settings on your preferred chart (e.g., 5-minute for day trading, daily for swing trading).
Risk Management: Use stop-losses and position sizing to manage risk, as suggested in alert messages (e.g., "Stop -20%").
Options Trading: Options strategies (e.g., straddles, iron condors) carry unique risks; consult a financial advisor before trading.
Feedback and Support
For questions, suggestions, or bug reports, please leave a comment on the TradingView script page or contact the author via TradingView. Your feedback helps improve the indicator for the community.
Disclaimer
The Canuck Trading Indicator is provided for educational and informational purposes only. It is not financial advice. Trading involves significant risks, and past performance is not indicative of future results. Always perform your own due diligence and consult a qualified financial advisor before making trading decisions.

NeuroFlow Pro IndicatorThe **NeuroFlow Pro Indicator** is a comprehensive technical analysis tool designed for traders on the TradingView platform. It provides actionable buy and sell signals by combining multiple technical indicators, including Moving Averages, MACD, RSI, Stochastic RSI, SuperTrend, Ichimoku Cloud, Bollinger Bands, and Volume analysis. The indicator generates a **Composite Score** (0–100) that reflects market conditions, with low scores indicating bullish opportunities and high scores suggesting bearish conditions. It also identifies key trend reversal points and significant EMA crossovers (Golden Cross and Death Cross) to help traders make informed decisions.
**Key Features**:
- **Composite Score**: Aggregates signals from multiple indicators to provide a single, easy-to-read metric.
- **Buy/Sell Signals**: Generates clear signals for potential long (buy) and short (sell) opportunities.
- **Golden/Death Cross**: Marks EMA 50 crossing above (🚀) or below (💀) EMA 200, indicating major trend shifts.
- **Dashboard**: Displays real-time metrics like trend direction, momentum, volume, and signal confidence.
- **Customizable Alerts**: Notifies users of buy/sell signals, divergences, and EMA crossovers via TradingView’s alert system.
- **Multi-Timeframe Analysis**: Incorporates higher timeframe trends for enhanced signal reliability.
- **Candlestick Patterns**: Optionally includes patterns like Hammer, Engulfing, or Morning Star for signal confirmation.
This indicator is ideal for traders seeking a robust, all-in-one tool to identify trading opportunities across various markets (e.g., crypto, stocks, forex) and timeframes (e.g., 1H, 4H, daily).
User Guide for NeuroFlow Pro Indicator
Understanding the Indicator
- **Dashboard**:
- Located on the chart (left or right, configurable), it shows real-time metrics:
- **Comp Score**: Composite Score (0–100); low (<30) is bullish, high (>70) is bearish.
- **Trend**: Bullish, Bearish, or Neutral
- **MTF Trend**: Trend from a higher timeframe (e.g., 60m or 240m).
- **Momentum**: RSI and Stochastic RSI-based momentum (Bullish, Bearish, Neutral).
- **MFI**: Money Flow Index (Inflow, Outflow, Neutral).
- **Volatility**: High or Low based on ATR and Bollinger Bands.
- **Volume**: High, Low, or Neutral relative to volume MA.
- **Ichimoku**: Bullish, Bearish, or Neutral based on cloud position.
- **ADX Strength**: Strong or Weak trend based on ADX.
- **Divergence**: Bullish, Bearish, or Neutral for RSI/MACD divergences.
- **Reversal**: Bullish or Bearish reversal potential with confidence percentage.
- **Signal Status**: Long (buy), Short (sell), or None.
- **Signal Confid**: Confidence percentage for the current signal.
- **Chart Visuals**:
- **EMA 50 (White)**: Fast-moving average for short-term trends.
- **EMA 200 (Blue)**: Long-moving average for long-term trends.
- **Golden Cross (🚀)**: Green rocket emoji when EMA 50 crosses above EMA 200 (bullish).
- **Death Cross (💀)**: Red skull emoji when EMA 50 crosses below EMA 200 (bearish).
- **Alerts**:
- Configurable for Buy/Sell Signals, Golden/Death Cross, and Bullish/Bearish Divergences.
Configuring Settings
1. **Open Settings**:
- Right-click the indicator’s name on the chart and select “Settings,” or double-click the indicator in the chart’s indicator list.
2. **Key Settings to Customize**:
- **Strategy Settings**:
- **Max ATR Multiplier**: Adjusts sensitivity to volatility (default: 3.0).
- **Main Settings**:
- **Candlestick Pattern**: Choose Hammer, Engulfing, Morning Star, or Custom (default: Hammer).
- **Multi-Timeframe Period**: Set higher timeframe for trend analysis (e.g., 60m, 240m, Daily; default: 60m).
- **Higher Timeframe**: Secondary timeframe for confirmation (default: 240m).
- **Use Candlestick Patterns**: Enable/disable pattern-based signals (default: off).
- **Use Volume Filter**: Require high volume for signals (default: on).
- **Use ADX Filter**: Require strong trend for signals (default: on).
- **Momentum Settings**:
- **RSI/Stochastic/MFI Lengths**: Adjust periods for RSI, Stochastic RSI, and MFI (defaults: 14, 14, 60).
- **EMA Lengths**: Fast (50), Slow (100), Long (200) for trend and crossovers.
- **ATR/ADX Lengths**: Volatility and trend strength periods (default: 14).
- **SuperTrend/Bollinger/Ichimoku Settings**:
- Customize periods and multipliers (defaults: SuperTrend 10/3.0, Bollinger 20/2.0, Ichimoku 9/26/52).
- **MACD Settings**:
- **MACD Preset**: Auto (timeframe-based), 1H (3-10-16), 4H (5-34-21), D (5-15-9), or Custom (default: Auto).
- **Custom MACD Lengths**: Fast (12), Slow (26), Signal (9) for Custom preset.
- **Weights Settings**:
- Adjust weights for trend, momentum, volatility, etc., to prioritize certain indicators (defaults: Trend 1.0, Momentum 0.3, etc.).
- **Threshold Settings**:
- **Bullish/Bearish Reversal Thresholds**: Set score thresholds for reversals (default: 30/70).
- **ADX Threshold**: Minimum ADX for trend strength (default: 20).
- **Signal Thresholds**: Base (70) and alert (80) thresholds for signals.
- **Dashboard Settings**:
- **Position**: Left or Right (default: Right).
- **Show/Hide Metrics**: Enable/disable dashboard rows (e.g., Comp Score, Trend, MFI; all enabled by default except Volatility and Volume MA).
3. **Save Changes**:
- Click “OK” to apply settings. The dashboard and plots update instantly.
Using the Indicator
1. **Interpreting Signals**:
- **Buy Signal (Long)**: Appears when Composite Score is low (≤30), with at least two bullish confirmations . Shown as “Long” in Signal Status with confidence percentage.
- **Sell Signal (Short)**: Appears when Composite Score is high (≥70), with at least two bearish confirmations. Shown as “Short” in Signal Status.
- **Golden Cross (🚀)**: Indicates a bullish trend when EMA 50 crosses above EMA 200. Look for confirmation from Composite Score and Signal Status.
- **Death Cross (💀)**: Indicates a bearish trend when EMA 50 crosses below EMA 200. Confirm with dashboard metrics.
- **Reversal Signals**: Dashboard shows “Bullish” or “Bearish” with a percentage when reversal conditions are met .
2. **Monitoring the Dashboard**:
- Use the dashboard to assess market conditions in real-time.
- Green (bullish), red (bearish), or gray (neutral) colors highlight key metrics.
- Check “Signal Confid” for confidence in buy/sell signals (higher is better, e.g., >60%).
3. **Trading Decisions**:
- Combine signals with your own analysis (e.g., support/resistance, news).
- Use Golden/Death Cross for long-term trend confirmation.
- Avoid trading in high volatility (dashboard: “Volatility: High”) unless experienced
Best Practices
- **Timeframe Selection**:
- Use higher timeframes (e.g., 4H, Daily) for more reliable signals, especially for Golden/Death Cross.
- Lower timeframes (e.g., 5m, 15m) may produce more signals but with higher noise.
- **Confirm Signals**:
- Cross-check buy/sell signals with dashboard metrics (e.g., Trend, MFI, ADX).
- Use Golden/Death Cross as a trend filter rather than a standalone signal.
- **Risk Management**:
- Always use stop-losses and position sizing based on your risk tolerance.
- Avoid trading during high volatility unless part of your strategy.
- **Regular Updates**:
- Monitor TradingView for script updates from the author (KoKalito) to access new features or bug fixes.
Troubleshooting
- **No Signals**:
- Ensure the chart timeframe matches your settings (e.g., 60m for MTF Period).
- Check if filters (Volume, ADX) are too strict; try disabling them.
- **Dashboard Missing**:
- Verify “Dashboard Position” is set to Left or Right.
- Ensure dashboard metrics are enabled (e.g., Show Comp Score).
- **Alerts Not Triggering**:
- Confirm the alert condition is set to “NeuroFlow Pro Indicator” and the correct option (e.g., “Golden Cross Alert”).
- Check TradingView’s “Alerts” panel for errors or expired alerts.
- Reapply the indicator to the chart if it was recently updated.
- **EMA Crosses Not Showing**:
- Zoom in on the chart to see 🚀 (Golden Cross) or 💀 (Death Cross) symbols.
- Ensure EMA 50 and EMA 200 lengths are not identical (defaults: 50, 200).
Support
- **Author**: KoKalito (check TradingView profile for updates or contact info).
- **TradingView Community**: Post questions in the TradingView Pine Script community or forums.
- **Documentation**: Refer to TradingView’s Pine Script v5 documentation for advanced customization.
- **Risk Warning**: Trading involves risk. Use the indicator as a tool, not a guarantee of profits. Always conduct your own analysis and manage risk appropriately.
Happy trading with **NeuroFlow Pro Indicator**! 🚀

Ultimate CoinTadpoleTrader Indicator Altcoins (UCTA)2.0Overview
UCTA (Ultimate CoinTadpoleTrader Indicator for Altcoins) is designed to help traders identify key turning points in volatile altcoin markets. It applies RSI momentum analysis, along with references to Stochastic RSI’s overbought/oversold zones and MACD expansion behavior to filter out low-probability signals. The script looks for repeated RSI dips below certain thresholds and subsequent recoveries, among other internal checks, to provide clear Buy/Sell icons on the chart.
1. Core Concepts
Multi-Stage RSI & Oscillator References
UCTA primarily relies on standard RSI thresholds (e.g., ≤30 or ≥70) but also references Stochastic RSI for deeper confirmation in potential overextended markets.
When the script detects repeated dives into oversold territory or significant momentum shifts, it generates stronger signals.
MACD Expansion Consideration
Internally, the script checks for moments when MACD lines diverge or “expand” notably, indicating an accelerating move.
If RSI conditions and MACD expansions align, the likelihood of a valid reversal or continuation signal increases.
Multi-Trigger Approach
The indicator may require multiple oversold or overbought triggers within a certain bar count to issue a final Buy or Sell signal.
For instance, RSI might dip into oversold, recover, and dip again. Such repeated patterns are used internally to reduce false positives.
Adaptive Filtering for Altcoins
Altcoins can have sharper, more frequent spikes than BTC.
UCTA’s logic attempts to handle these abrupt moves by fine-tuning the thresholds and waiting periods based on repeated triggers, rather than single crosses.
2. Usage Recommendations
Markets & Timeframes
While originally optimized for altcoins on 1H–4H charts, traders can experiment with different timeframes depending on each coin’s volatility.
If the market is extremely choppy, consider referencing higher timeframes to reduce whipsaws.
Signal Interpretation
Buy Signal → The script detects a probable bottoming pattern when RSI and other oscillator conditions reenter oversold territory multiple times within a short window.
Sell Signal → Identifies points where markets may be hitting a peak, considering repeated or extreme overbought metrics.
Complementary Analysis
Use additional technical or fundamental analysis tools to confirm signals.
UCTA is not intended as a standalone guarantee; rapid price swings can invalidate any single indicator.
3. Disclaimers
Closed-Source Code
The logic behind UCTA is proprietary and not publicly visible.
It comprises advanced filtering methods that rely on recognized indicators (RSI, Stoch RSI, MACD) in a unique combination.
No Performance Guarantees
Cryptocurrency trading is highly speculative. Historical signals do not ensure future results.
Users should apply prudent risk management and never trade solely based on one tool.
Non-Repainting Logic
Signals are determined once a bar closes, so they do not repaint retroactively.
Intrabar fluctuations can cause potential signals to appear or disappear until confirmed at candle close.

Hippo Battlefield - Bulls VS Bears 20 bars## Hippo Battlefield – Bulls VS Bears (20 Bars)
**What it is**
A multi-dimensional momentum-and-sentiment oscillator that combines classic Bull/Bear Power with ATR- or peak-normalization, then layers on RSI and MACD-derived metrics into:
1. **A colored bar series** showing net Bull+Bear Power strength over the last 20 bars,
2. **A dynamic table** of each of those 20 BBP values (grouped into four 5-bar “quartals”), with symbols, per-bar change, and rolling averages, and
3. **A composite “Weighted BBP” histogram** blending normalized RSI, MACD, and BBP into a single view.
---
### Key Inputs
- **Length (EMA)** – look-back for the underlying EMA (default 60)
- **Normalization Length** – look-back window for peak-normalization (default 60)
- **Use ATR for Norm.** – toggle ATR-based normalization vs. highest-abs(BBP)
- **Show Tables** – toggle the bottom-right 21×11 grid of raw and average BBP values
---
### What You See
#### 1. Colored Bars (Overlay = false)
- Bars are colored by normalized BBP intensity:
- Extreme Bull (≥+10): deep blue
- Strong Bull (+5 to +10): green/yellow
- Weak Bull (+0 to +5): dark green
- Weak Bear (–0 to –5): dark red
- Strong Bear (–5 to –10): pink/red
- Extreme Bear (<–10): magenta
#### 2. Bottom-Right Table (20 Bars of Data)
- Divided into four columns (0–4, 5–9, 10–14, 15–19 bars ago) and one “average” row.
- Each cell shows:
1. Bar index (1–20),
2. Normalized BBP value (to four decimals),
3. Direction symbol (↑/↓/=),
4. Bar-to-bar change (± value),
5. A separator “|”.
- At the very bottom, each column’s 5-bar average is displayed as “Avg: X.XXXX” with a dot marker.
#### 3. Top-Center Mini-Table
- When ≥20 bars have elapsed, shows the date at 20 bars ago and the average BBP across the full 20-bar window.
#### 4. Normalized RSI Line
- Rescales the classic 14-period RSI into a –20…+20 band to align with BBP.
#### 5. MACD Lines (Hidden) & Composite Histogram
- MACD and signal lines are calculated but not plotted by default.
- A “Weighted BBP” histogram combines:
- 20% normalized RSI,
- 20% average of (MACD + signal + normalized BBP),
- 60% normalized BBP
- Plotted as columns, color-coded by strength using the same palette as the main bars.
#### 6. Middle Reference Line
- A horizontal zero line to anchor over/under-zero readings.
---
### How to Use It
- **Trend confirmation**: Strong blue/green bars alongside a rising histogram suggest bull conviction; strong reds/magentas signal bear dominance.
- **Divergence spotting**: Watch for price making new highs/lows while BBP or the histogram fails to follow.
- **Quartal analysis**: The 5-bar group averages can reveal whether recent momentum is accelerating or waning.
- **Cross-indicator weighting**: Because RSI, MACD, and raw BBP all feed into the final histogram, you get a smoothed, blended view of momentum shifts.
---
**Tip:** Tweak the EMA and normalization length to suit your preferred timeframe (e.g. shorter for intraday scalps, longer for swing trades). Enable/disable the table if you prefer a cleaner pane.

GZ Indicator✍️ Description:
GZ Indicator is an advanced indicator that automatically detects Golden Zones, optimal market entry zones based on the latest significant pivots. The system uses Fibonacci extensions to project precise price targets, while providing a dynamic, visual stop-loss.
Main features:
- Pivot Detection: Automatic identification of significant pivots (high/low).
- Optimal Entry Zones (OTE): Automatically calculates ideal entry zones based on Fibonacci retracements.
- Precise Targets: Displays price targets with Fibonacci extensions.
- Dynamic Stop-Loss: Visual stop-loss zone adjusted to market conditions.
- RSI and MACD display: Add an RSI and MACD chart to facilitate trend analysis and confirm your entries.
- Intelligent refresh: Automatic deletion of the active zone as soon as the stop-loss is reached.
🔥 Key features:
Automatic detection of significant pivots (highs and lows)
Dynamic calculation of the OTE (Optimal Trade Entry) zone on retracements 0.618 - 0. 705
Clear display of price targets based on extensions
Intelligent updating: old zones are retained for historical analysis
Automatic deletion of current zone if Stop-Loss is reached
Contextual RSI and MACD chart for improved trend analysis
Code optimized for minimum recalculations, fluid even on fast time units.
⚡ How to use it:
Spot the appearance of a Golden Zone.
Enter a position in the zone with RSI/MACD or price action confirmation.
Use the targets displayed to set your progressive Take-Profits.
Respect the Stop-Loss zone automatically drawn.
🛠️ Available parameters:
Activate/deactivate RSI/MACD chart
Choose number of pivots for detection
Display old targets
[⚠️ Disclaimer:
This indicator is a decision-making tool. It is not intended to be used as financial advice. Please always perform your own analysis and manage your risks properly.
🔥 Bon trading ! 🚀

Scalper's Fractal Cloud with RSI + VWAP + MACD (Fixed)Scalper’s Fractal Confluence Dashboard
1. Purpose of the Indicator
This TradingView indicator script provides a high-confluence setup for scalping and day trading. It blends momentum indicators (RSI, MACD), trend bias tools (EMA Cloud, VWAP), and structure (fractal swings, gap zones) to help confirm precise entries and exits.
2. Components of the Indicator
- EMA Cloud (50 & 200 EMA): Trend bias – green means bullish, red means bearish. Avoid longs under red cloud.
- VWAP: Institutional volume anchor. Ideal entries are pullbacks to VWAP in direction of trend.
- Gap Zones: Shows open-air zones (white space) where price can move fast. Used to anticipate momentum moves.
- ZigZag Swings: Marks structural pivots (highs/lows) – useful for stop placement and range anticipation.
- MACD Histogram: Shows bullish or bearish momentum via background color.
- RSI: Overbought (>70) or oversold (<30) warnings. Good for exits or countertrend reversion plays.
- EMA Spread Label: Quick view of momentum strength. Wide spread = strong trend.
3. Scalping Entry Checklist
Before entering a trade, confirm these conditions:
• • Bias: EMA cloud color supports trade direction
• • Price is above/below VWAP (confirming institutional flow)
• • MACD histogram matches direction (green for long, red for short)
• • RSI not at extreme (unless you’re fading trend)
• • If entering gap zone, expect fast move
• • Recent swing high/low nearby for target or stop
4. Risk & Sizing Guidelines
Risk 1–2% of account per trade. Place stop below recent swing low (for longs) or high (for shorts). Use fractional sizing near VWAP or white space zones for scalping reversals.
5. Daily Trade Journal Template
- Date:
- Ticker:
- Setup Type (VWAP pullback, Gap Break, EMA reversion):
- Entry Time:
- Bias (Green/Red Cloud):
- RSI Level / MACD Reading:
- Stop Loss:
- Target:
- Result (P/L):
- What I Did Well:
- What Needs Work:

BBMA Strategy - EXT CSD CSM MHV RE CodesBINANCE:BTCUSD
Below is a detailed guide for using and interpreting the "BBMA Strategy - Enhanced EXT CSD CSM with Subplot" indicator. This guide is designed to be added to the description of the indicator when publishing it on TradingView. It provides clear instructions for users on how to apply the indicator, interpret its signals, and understand its features, including the multi-timeframe analysis and subplot table.
BBMA Strategy - Enhanced EXT CSD CSM with Subplot: User Guide
Overview
The "BBMA Strategy - Enhanced EXT CSD CSM with Subplot" is a comprehensive trading indicator built on the Bollinger Bands Moving Average (BBMA) framework. It combines multiple technical analysis tools—Bollinger Bands, Moving Averages (MAHI and MALO), EMA, ATR, volume analysis, RSI, MACD, market structure, and candlestick patterns—to identify high-probability trading setups. The indicator supports five key BBMA setups: EXT (Extreme), CSD (Consolidation), CSM (Continuation Setup Movement), RE (Re-Entry), and MHV (Market High Volatility).
This enhanced version includes:
Multi-Timeframe (MTF) Analysis: Confirms signals across a Lower Timeframe (LTF) and Higher Timeframe (HTF) for stronger trade validation.
Subplot Table: Displays signal status ("Active" or "Upcoming") and MTF confirmations in a clear table format.
Market Structure and Volume Filters: Incorporates Break of Structure (BOS), RSI divergence, and volume conditions to filter out low-probability trades.
Customizable Settings: Adjust Bollinger Bands, MA periods, timeframes, and more to suit your trading style.
This indicator is suitable for traders of all levels and can be used across various markets (e.g., forex, crypto, stocks) and timeframes (1M to 1D).
How to Use the Indicator
1. Add the Indicator to Your Chart
Open TradingView and load the chart of your chosen asset (e.g., BTCUSD, EURUSD, XAUUSD).
Go to the Pine Editor, paste the indicator code, and click "Add to Chart."
The indicator will overlay on your chart, displaying Bollinger Bands, Moving Averages, EMA, and signal labels. A subplot table will appear at the bottom of the chart.
2. Configure the Settings
The indicator provides customizable inputs to tailor it to your trading preferences. Access the settings by clicking the gear icon next to the indicator name on your chart:
Bollinger Bands Settings:
BB Period: Default is 20. Adjust the lookback period for Bollinger Bands.
BB Deviations: Default is 2. Adjust the standard deviation for the bands.
MAHI Settings (Moving Averages on High):
MAHI 5 Period: Default is 5. Period for the shorter MA on highs.
MAHI 10 Period: Default is 10. Period for the longer MA on highs.
MALO Settings (Moving Averages on Low):
MALO 5 Period: Default is 5. Period for the shorter MA on lows.
MALO 10 Period: Default is 10. Period for the longer MA on lows.
EMA Settings:
EMA Period: Default is 50. Adjust the period for the Exponential Moving Average.
ATR Settings:
ATR Period: Default is 14. Period for the Average True Range.
ATR SMA Period: Default is 14. Period for the ATR smoothing.
Timeframe Settings:
Minor HTF: Default is 1h. Select the minor higher timeframe for trend confirmation.
Major HTF: Default is 4h. Select the major higher timeframe for trend confirmation.
Lower TF for Confirmation: Default is 5m. Select the lower timeframe for signal confirmation.
Market Structure Settings:
Market Structure Lookback: Default is 10. Adjust the lookback period for swing highs/lows in market structure analysis.
3. Select Your Chart Timeframe
The indicator works on any timeframe from 1 minute (1M) to 1 day (1D).
For best results, align your chart timeframe (Current Timeframe, CTF) with the LTF and HTF settings:
Example: If CTF is 15m, set LTF to 5m and HTF to 1h or 4h.
This ensures proper multi-timeframe alignment for signal confirmation.
Indicator Components
Main Chart Elements
Bollinger Bands (BB): Plotted as three lines (upper, middle, lower) to identify volatility and potential reversal zones.
Upper Band: Blue line.
Middle Band: Black line (basis).
Lower Band: Blue line.
MAHI (Moving Averages on High): Two weighted moving averages on highs to detect trend direction.
MAHI 5: Green line.
MAHI 10: Lime line.
MALO (Moving Averages on Low): Two weighted moving averages on lows to confirm trend direction.
MALO 5: Red line.
MALO 10: Orange line.
EMA (50-period): Purple line to identify the overall trend.
Signal Labels: Appear on the chart when a setup is confirmed:
EXT Buy: Green upward arrow (reversal buy at BB lower band).
EXT Sell: Red downward arrow (reversal sell at BB upper band).
CSM Buy: Teal upward arrow (continuation buy above BB middle).
CSM Sell: Maroon downward arrow (continuation sell below BB middle).
RE Buy: Aqua upward arrow (re-entry buy between BB lower and middle).
RE Sell: Fuchsia downward arrow (re-entry sell between BB upper and middle).
MHV: Orange label (high volatility breakout after consolidation).
CSD: Yellow diamond (consolidation signal).
Subplot Table
Located at the bottom of the chart, the table summarizes signal status across three timeframes:
CTF (Current Timeframe): Shows "Active" (signal confirmed) or "Upcoming" (signal forming) for each setup.
LTF (Lower Timeframe): Displays a checkmark (✔) if the signal is confirmed on the LTF.
HTF (Higher Timeframe): Displays a checkmark (✔) if the signal is confirmed on the HTF.
Columns represent the five BBMA setups: EXT Buy, EXT Sell, CSD, CSM Buy, CSM Sell, RE Buy, RE Sell, and MHV.
Interpreting the Signals
1. EXT (Extreme) Setup
EXT Buy (Green Arrow):
Condition: Price touches or breaks below the BB lower band, closes above it, with high ATR volatility, strong volume, and additional confirmations (e.g., hammer candle, RSI oversold, MACD bullish, MAHI/MALO crossover, or bullish divergence).
Interpretation: A potential reversal buy signal. Look for confirmation in the subplot table (LTF and HTF rows).
Action: Consider a long position if LTF and HTF confirm (✔ in both rows). Use the BB middle or upper band as a target.
EXT Sell (Red Arrow):
Condition: Price touches or breaks above the BB upper band, closes below it, with high ATR volatility, strong volume, and additional confirmations (e.g., shooting star candle, RSI overbought, MACD bearish, MAHI/MALO crossunder, or bearish divergence).
Interpretation: A potential reversal sell signal.
Action: Consider a short position if LTF and HTF confirm. Use the BB middle or lower band as a target.
2. CSD (Consolidation) Setup
CSD (Yellow Diamond):
Condition: BB width is narrow (below its SMA), low ATR volatility, small candles, and no MAHI/MALO crossovers.
Interpretation: The market is consolidating, often preceding a breakout (e.g., MHV).
Action: Avoid trading during CSD unless preparing for an MHV breakout. Monitor the subplot for "Upcoming" MHV signals.
3. CSM (Continuation Setup Movement)
CSM Buy (Teal Arrow):
Condition: Price is above the BB middle, MAHI crossover, MALO crossover or MACD bullish, price above EMA 50, with additional confirmations (e.g., bullish engulfing or MACD bullish).
Interpretation: A continuation buy signal in an uptrend.
Action: Enter a long position if LTF and HTF confirm. Target the BB upper band or recent swing highs.
CSM Sell (Maroon Arrow):
Condition: Price is below the BB middle, MAHI crossunder, MALO crossunder or MACD bearish, price below EMA 50, with additional confirmations (e.g., bearish engulfing or MACD bearish).
Interpretation: A continuation sell signal in a downtrend.
Action: Enter a short position if LTF and HTF confirm. Target the BB lower band or recent swing lows.
4. RE (Re-Entry) Setup
RE Buy (Aqua Arrow):
Condition: Price is between the BB lower and middle bands, MAHI crossover, MALO crossover or MACD bullish, price above EMA 50, with additional confirmations (e.g., bullish engulfing or MACD bullish).
Interpretation: A re-entry buy signal after a pullback in an uptrend.
Action: Enter a long position if LTF and HTF confirm. Target the BB middle or upper band.
RE Sell (Fuchsia Arrow):
Condition: Price is between the BB upper and middle bands, MAHI crossunder, MALO crossunder or MACD bearish, price below EMA 50, with additional confirmations (e.g., bearish engulfing or MACD bearish).
Interpretation: A re-entry sell signal after a pullback in a downtrend.
Action: Enter a short position if LTF and HTF confirm. Target the BB middle or lower band.
5. MHV (Market High Volatility) Setup
MHV (Orange Label):
Condition: Follows a CSD signal, with expanding BB width, high ATR volatility, strong volume, and MAHI/MALO crossover or crossunder.
Interpretation: A breakout signal after consolidation, indicating high volatility and potential for a strong move.
Action: Trade in the direction of the breakout (e.g., buy if MAHI crossover, sell if MAHI crossunder). Confirm with LTF and HTF. Target significant levels like recent swing highs/lows.
6. Multi-Timeframe Confirmation
LTF Confirmation: A checkmark (✔) in the LTF row indicates the signal is also present on the lower timeframe (e.g., 5m). This adds confidence to the trade.
HTF Confirmation: A checkmark (✔) in the HTF row indicates alignment with the higher timeframe trend (e.g., 4h). This confirms the signal's strength.
Strongest Signals: Look for signals with both LTF and HTF confirmations (✔ in both rows). These have the highest probability of success.
7. Upcoming Signals
The CTF row in the subplot table may show "Upcoming" for a setup (e.g., EXT Buy: Upcoming). This indicates the setup is forming but not yet confirmed.
Action: Monitor these setups closely. They may turn "Active" on the next candle if conditions are met.
Trading Tips
Trend Alignment: Use the EMA 50 and market structure (is_uptrend) to ensure trades align with the overall trend. For example, prioritize CSM Buy signals in an uptrend.
Risk Management:
Set stop-losses below recent swing lows (for buys) or above recent swing highs (for sells).
Use the BB middle or opposite band as a target for most setups.
Avoid Overtrading: Focus on signals with LTF and HTF confirmations to filter out noise.
Timeframe Selection:
Scalping: Use 1m or 5m CTF with 1m LTF and 15m HTF.
Day Trading: Use 15m or 1h CTF with 5m LTF and 4h HTF.
Swing Trading: Use 4h or 1D CTF with 1h LTF and 1D HTF.
Backtesting: Test the indicator on historical data for your chosen asset and timeframe to understand its performance.
Alerts
The indicator includes built-in alerts for each setup:
EXT Buy/Sell: Triggers when an EXT signal is confirmed.
CSD: Triggers during consolidation.
CSM Buy/Sell: Triggers for continuation signals.
RE Buy/Sell: Triggers for re-entry signals.
MHV: Triggers for high volatility breakouts. To set up alerts:
Right-click on the chart and select "Add Alert."
Choose the condition (e.g., "BBMA EXT Buy").
Set your preferred notification method (e.g., email, SMS).
Limitations
Lagging Indicators: The indicator uses moving averages and other lagging tools, which may delay signals in fast-moving markets.
False Signals: Like all indicators, it can produce false signals, especially in choppy markets. Use LTF/HTF confirmations to filter trades.
Timeframe Dependency: Ensure your CTF, LTF, and HTF are properly aligned to avoid conflicting signals.
Multi-Indicator Trading DashboardMulti-Indicator Trading Dashboard: Comprehensive Analysis and Actionable Signals
This Pine Script indicator, "Multi-Indicator Trading Dashboard," provides a comprehensive overview of key market indicators and generates actionable trading signals, all presented in a clear, easy-to-read table format on your TradingView chart.
Key Features:
Real-time Indicator Analysis: The dashboard displays real-time values and signals for:
RSI (Relative Strength Index): Tracks overbought and oversold conditions.
MACD (Moving Average Convergence Divergence): Identifies trend changes and momentum.
ADX (Average Directional Index): Measures trend strength.
Volatility (ATR-based): Estimates volatility as a percentage, acting as a VIX proxy for single-symbol charts.
Trend Determination: Analyzes 20, 50, and 200-period EMAs to provide a clear trend assessment (Strong Bullish, Cautious Bullish, Cautious Bearish, Strong Bearish).
Combined Trading Signals: Integrates signals from RSI, MACD, ADX, and trend analysis to generate a combined "Buy," "Sell," or "Neutral" action signal.
User-Friendly Table Display: Presents all information in a neatly organized table, positioned at the top-right of your chart.
Visual Chart Overlays: Plots 20, 50, and 200-period EMAs directly on the chart for visual trend confirmation.
Background Color Alerts: Colors the chart's background based on the "Buy" or "Sell" action signal for quick visual cues.
Customizable Inputs: Allows you to adjust key parameters like RSI lengths, MACD settings, ADX thresholds, and EMA periods.
How It Works:
Indicator Calculations: The script calculates RSI, MACD, ADX, and a volatility proxy (ATR) using standard Pine Script functions.
Trend Analysis: It compares 20, 50, and 200-period EMAs to determine the overall trend direction.
Individual Signal Generation: It generates individual "Buy," "Sell," or "Neutral" signals based on RSI, MACD, and ADX values.
Combined Signal Logic: It combines the individual signals and trend analysis, assigning a "Buy" or "Sell" action only when at least two indicators align.
Table Display: It creates a table and populates it with the calculated values, signals, and trend information.
Chart Overlays: It plots the EMAs on the chart and colors the background based on the combined action signal.
Use Cases:
Quick Market Overview: Get a snapshot of key market indicators and trend direction at a glance.
Confirmation Tool: Use the combined signals to confirm your existing trading strategies.
Educational Purpose: Learn how different indicators interact and influence trading decisions.
Automated Alerting: Set up alerts based on the "Buy" or "Sell" action signals.
Customization:
Adjust the input parameters to fine-tune the indicator's sensitivity to your trading style and the specific market you're analyzing.
Disclaimer:
This indicator is for informational and educational purposes only and should not be considered financial advice. Always conduct thorough research and consult with 1 a qualified professional before making any 2 trading decisions.

Victor the Predictor - Gold Advanced Analytics Suite by SK v 2.0Victor the Predictor - Gold Advanced Analytics Suite by SK v2.0
Overview:
Victor the Predictor is a powerful trading indicator designed for advanced market analysis, combining classic technical indicators with volatility-based metrics and machine learning-based predictions. This suite is specifically optimized for trading gold (XAUUSD) but can be used effectively in other markets as well.
Key Features:
✅ Swing Levels & Trend Channels: Automatically detects key support and resistance levels, along with trend channels, to help identify optimal entry and exit points.
✅ Technical Indicators: Includes RSI, MACD, and ATR for trend strength assessment and momentum-based trading decisions.
✅ Machine Learning Forecasting: Implements a predictive algorithm that analyzes historical price action, volatility, and volume to provide directional forecasts.
✅ Smart Volatility Filtering: Avoids false signals by analyzing ATR-based volatility spikes and filtering out unstable market conditions.
✅ Candle Coloring & Signal Markers: Highlights strong bullish and bearish signals based on confluence criteria, making trade opportunities visually clear.
✅ Customizable Settings: Offers full flexibility to adjust indicator parameters for different trading styles and risk preferences.
How It Works:
🔹 Support & Resistance Zones: The script calculates the highest high and lowest low within a given period to define swing levels. The mid-point between these levels serves as a potential pivot area.
🔹 Trend Analysis: The indicator overlays trend channels using EMA (50) and ATR-based deviation bands, helping traders gauge market direction and volatility expansion.
🔹 Momentum & Volume Analysis: RSI and MACD are used to confirm trade entries, while volume percentile ranks help assess market participation.
🔹 Machine Learning Predictions: A simplified ML-based approach aggregates various technical indicators into a weighted prediction score, which is normalized and projected over a short-term horizon.
🔹 Trade Signals:
BUY Signal: RSI crosses above 50, MACD is bullish, price is above EMA-14, and volatility conditions are favorable.
SELL Signal: RSI crosses below 50, MACD is bearish, price is below EMA-14, and volatility conditions are favorable.
Strong signals appear only when volatility filters confirm a stable environment.
Visualization & Alerts:
Colored Candles: Green for strong bullish signals, red for strong bearish signals.
Support & Resistance Zones: Automatically plotted key price levels.
Trend Channels: Highlight areas of expected price movement.
ML Forecast Line: A projected trend based on historical data analysis.
Buy/Sell Markers: Clear trade signals displayed directly on the chart.
Usage & Optimization:
Works best on gold (XAUUSD) but can be applied to forex, indices, and commodities.
Ideal for swing traders and day traders who use technical confluence.
Recommended timeframes: 15M, 1H, 4H, Daily.
Adjust RSI, MACD, ATR, and ML sensitivity to fine-tune signals according to market conditions.
📌 Important Note:
This indicator does not guarantee future performance and should be used alongside proper risk management strategies. Always backtest before using it in live trading.

MTF Signal XpertMTF Signal Xpert – Detailed Description
Overview:
MTF Signal Xpert is a proprietary, open‑source trading signal indicator that fuses multiple technical analysis methods into one cohesive strategy. Developed after rigorous backtesting and extensive research, this advanced tool is designed to deliver clear BUY and SELL signals by analyzing trend, momentum, and volatility across various timeframes. Its integrated approach not only enhances signal reliability but also incorporates dynamic risk management, helping traders protect their capital while navigating complex market conditions.
Detailed Explanation of How It Works:
Trend Detection via Moving Averages
Dual Moving Averages:
MTF Signal Xpert computes two moving averages—a fast MA and a slow MA—with the flexibility to choose from Simple (SMA), Exponential (EMA), or Hull (HMA) methods. This dual-MA system helps identify the prevailing market trend by contrasting short-term momentum with longer-term trends.
Crossover Logic:
A BUY signal is initiated when the fast MA crosses above the slow MA, coupled with the condition that the current price is above the lower Bollinger Band. This suggests that the market may be emerging from a lower price region. Conversely, a SELL signal is generated when the fast MA crosses below the slow MA and the price is below the upper Bollinger Band, indicating potential bearish pressure.
Recent Crossover Confirmation:
To ensure that signals reflect current market dynamics, the script tracks the number of bars since the moving average crossover event. Only crossovers that occur within a user-defined “candle confirmation” period are considered, which helps filter out outdated signals and improves overall signal accuracy.
Volatility and Price Extremes with Bollinger Bands
Calculation of Bands:
Bollinger Bands are calculated using a 20‑period simple moving average as the central basis, with the upper and lower bands derived from a standard deviation multiplier. This creates dynamic boundaries that adjust according to recent market volatility.
Signal Reinforcement:
For BUY signals, the condition that the price is above the lower Bollinger Band suggests an undervalued market condition, while for SELL signals, the price falling below the upper Bollinger Band reinforces the bearish bias. This volatility context adds depth to the moving average crossover signals.
Momentum Confirmation Using Multiple Oscillators
RSI (Relative Strength Index):
The RSI is computed over 14 periods to determine if the market is in an overbought or oversold state. Only readings within an optimal range (defined by user inputs) validate the signal, ensuring that entries are made during balanced conditions.
MACD (Moving Average Convergence Divergence):
The MACD line is compared with its signal line to assess momentum. A bullish scenario is confirmed when the MACD line is above the signal line, while a bearish scenario is indicated when it is below, thus adding another layer of confirmation.
Awesome Oscillator (AO):
The AO measures the difference between short-term and long-term simple moving averages of the median price. Positive AO values support BUY signals, while negative values back SELL signals, offering additional momentum insight.
ADX (Average Directional Index):
The ADX quantifies trend strength. MTF Signal Xpert only considers signals when the ADX value exceeds a specified threshold, ensuring that trades are taken in strongly trending markets.
Optional Stochastic Oscillator:
An optional stochastic oscillator filter can be enabled to further refine signals. It checks for overbought conditions (supporting SELL signals) or oversold conditions (supporting BUY signals), thus reducing ambiguity.
Multi-Timeframe Verification
Higher Timeframe Filter:
To align short-term signals with broader market trends, the script calculates an EMA on a higher timeframe as specified by the user. This multi-timeframe approach helps ensure that signals on the primary chart are consistent with the overall trend, thereby reducing false signals.
Dynamic Risk Management with ATR
ATR-Based Calculations:
The Average True Range (ATR) is used to measure current market volatility. This value is multiplied by a user-defined factor to dynamically determine stop loss (SL) and take profit (TP) levels, adapting to changing market conditions.
Visual SL/TP Markers:
The calculated SL and TP levels are plotted on the chart as distinct colored dots, enabling traders to quickly identify recommended exit points.
Optional Trailing Stop:
An optional trailing stop feature is available, which adjusts the stop loss as the trade moves favorably, helping to lock in profits while protecting against sudden reversals.
Risk/Reward Ratio Calculation:
MTF Signal Xpert computes a risk/reward ratio based on the dynamic SL and TP levels. This quantitative measure allows traders to assess whether the potential reward justifies the risk associated with a trade.
Condition Weighting and Signal Scoring
Binary Condition Checks:
Each technical condition—ranging from moving average crossovers, Bollinger Band positioning, and RSI range to MACD, AO, ADX, and volume filters—is assigned a binary score (1 if met, 0 if not).
Cumulative Scoring:
These individual scores are summed to generate cumulative bullish and bearish scores, quantifying the overall strength of the signal and providing traders with an objective measure of its viability.
Detailed Signal Explanation:
A comprehensive explanation string is generated, outlining which conditions contributed to the current BUY or SELL signal. This explanation is displayed on an on‑chart dashboard, offering transparency and clarity into the signal generation process.
On-Chart Visualizations and Debug Information
Chart Elements:
The indicator plots all key components—moving averages, Bollinger Bands, SL and TP markers—directly on the chart, providing a clear visual framework for understanding market conditions.
Combined Dashboard:
A dedicated dashboard displays key metrics such as RSI, ADX, and the bullish/bearish scores, alongside a detailed explanation of the current signal. This consolidated view allows traders to quickly grasp the underlying logic.
Debug Table (Optional):
For advanced users, an optional debug table is available. This table breaks down each individual condition, indicating which criteria were met or not met, thus aiding in further analysis and strategy refinement.
Mashup Justification and Originality
MTF Signal Xpert is more than just an aggregation of existing indicators—it is an original synthesis designed to address real-world trading complexities. Here’s how its components work together:
Integrated Trend, Volatility, and Momentum Analysis:
By combining moving averages, Bollinger Bands, and multiple oscillators (RSI, MACD, AO, ADX, and an optional stochastic), the indicator captures diverse market dynamics. Each component reinforces the others, reducing noise and filtering out false signals.
Multi-Timeframe Analysis:
The inclusion of a higher timeframe filter aligns short-term signals with longer-term trends, enhancing overall reliability and reducing the potential for contradictory signals.
Adaptive Risk Management:
Dynamic stop loss and take profit levels, determined using ATR, ensure that the risk management strategy adapts to current market conditions. The optional trailing stop further refines this approach, protecting profits as the market evolves.
Quantitative Signal Scoring:
The condition weighting system provides an objective measure of signal strength, giving traders clear insight into how each technical component contributes to the final decision.
How to Use MTF Signal Xpert:
Input Customization:
Adjust the moving average type and period settings, ATR multipliers, and oscillator thresholds to align with your trading style and the specific market conditions.
Enable or disable the optional stochastic oscillator and trailing stop based on your preference.
Interpreting the Signals:
When a BUY or SELL signal appears, refer to the on‑chart dashboard, which displays key metrics (e.g., RSI, ADX, bullish/bearish scores) along with a detailed breakdown of the conditions that triggered the signal.
Review the SL and TP markers on the chart to understand the associated risk/reward setup.
Risk Management:
Use the dynamically calculated stop loss and take profit levels as guidelines for setting your exit points.
Evaluate the provided risk/reward ratio to ensure that the potential reward justifies the risk before entering a trade.
Debugging and Verification:
Advanced users can enable the debug table to see a condition-by-condition breakdown of the signal generation process, helping refine the strategy and deepen understanding of market dynamics.
Disclaimer:
MTF Signal Xpert is intended for educational and analytical purposes only. Although it is based on robust technical analysis methods and has undergone extensive backtesting, past performance is not indicative of future results. Traders should employ proper risk management and adjust the settings to suit their financial circumstances and risk tolerance.
MTF Signal Xpert represents a comprehensive, original approach to trading signal generation. By blending trend detection, volatility assessment, momentum analysis, multi-timeframe alignment, and adaptive risk management into one integrated system, it provides traders with actionable signals and the transparency needed to understand the logic behind them.

Kubricks Super Colliding Indicator v2The Kubricks Super Colliding Indicator v2 is a comprehensive technical analysis tool designed for TradingView. It combines multiple indicators and conditions to help traders identify potential buy/sell signals and trend directions. The script is highly customizable, allowing users to toggle specific features on/off and adjust parameters to suit their trading style.
Key Features
Moving Averages:
Plots SMAs (Simple Moving Averages) and EMAs (Exponential Moving Averages) with customizable periods and colors.
Includes Golden Cross (bullish) and Death Cross (bearish) conditions based on SMA and EMA crossovers.
RSI (Relative Strength Index):
Identifies overbought and oversold conditions using customizable RSI levels.
Displays visual alerts (plotshapes) for overbought/oversold conditions.
MACD (Moving Average Convergence Divergence):
Detects bullish and bearish crossovers of the MACD line and signal line.
Displays visual alerts for MACD crossovers.
Customizable Alerts:
Alerts for Golden Cross, Death Cross, RSI overbought/oversold, MACD crossovers, and close above SMA.
Toggleable Indicators:
Allows users to enable/disable specific features (e.g., RSI, MACD, SMA cross signals) for a cleaner chart.
Visual Enhancements:
Highlights Golden Cross and Death Cross conditions with background colors.
Uses plotshapes to mark key signals (e.g., overbought/oversold, MACD crossovers, close above SMA).
How It Helps Traders
Trend Identification: The combination of SMAs and EMAs helps identify long-term and short-term trends.
Momentum Confirmation: RSI and MACD provide additional confirmation of momentum and potential reversals.
Customizability: Traders can tailor the script to their preferences, focusing on the indicators and conditions most relevant to their strategy.
Visual Alerts: Clear visual cues and alerts make it easier to spot trading opportunities in real-time.
Ideal For
Swing Traders: Identifying trend reversals and momentum shifts.
Position Traders: Confirming long-term trends with Golden/Death Crosses.
Day Traders: Using RSI and MACD for short-term entry/exit signals.
This script is a powerful, all-in-one tool for traders looking to combine multiple technical indicators into a single, easy-to-use interface. Let me know if you need further assistance!

ueuito Custom Moving Averages and VWMA TrendDescription in English:
is a customizable indicator that combines multiple technical analysis tools to identify market trends and buy/sell signals. It integrates moving averages (including VWMA), RSI, MACD, and various configurable levels, providing detailed visual analysis on the chart.
Key Features:
Customizable Moving Averages:
Supports SMA, EMA, WMA, VWMA, and RMA.
Allows for customizing the period and displaying up to two moving averages simultaneously.
VWMA with RSI Indication:
VWMA changes color based on RSI conditions:
Overbought color when RSI exceeds a configurable level.
Oversold color when RSI drops below a configurable level.
MACD and Crossovers:
Detects MACD crossovers with the signal line and highlights them on the chart.
Includes visual indicators to mark key moments of MACD rising or falling.
Overbought/Oversold Signals:
Adds visual markers when RSI exceeds user-defined levels (overbought or oversold).
MACD Level Indicators:
Displays specific values on the chart when MACD reaches predefined levels, with color adjustments based on trend direction.
Advanced Configurations:
Configurable parameters for vertical offset, label colors, and alert levels.
Provides flexibility to tailor the indicator’s appearance and behavior.
Still improving...
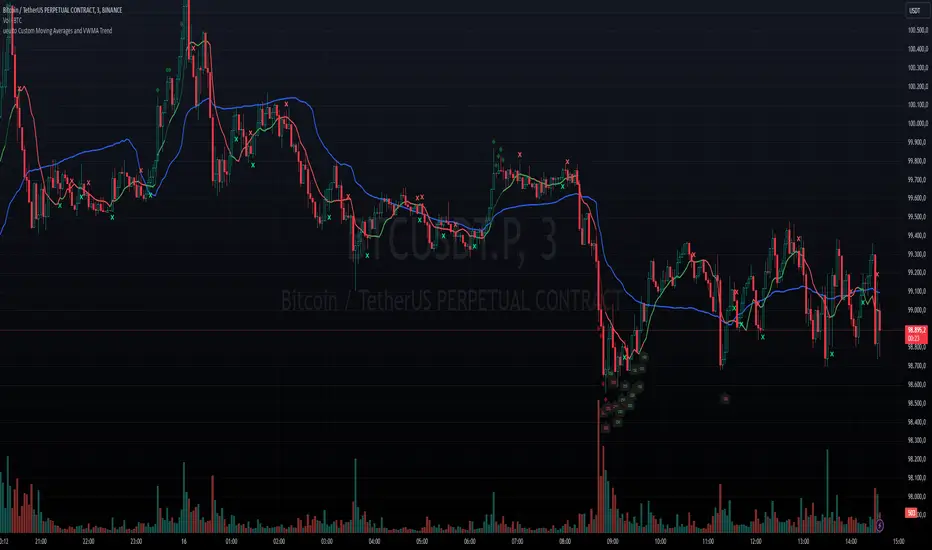
LiquidFusion SignalPro [CHE] LiquidFusion SignalPro – Indicator Overview
The LiquidFusion SignalPro is a powerful and sophisticated TradingView indicator designed to identify high-quality trade entries and exits. By combining seven unique sub-indicators, it provides comprehensive market analysis, ensuring traders can make informed decisions. This tool is suitable for all market conditions and supports customization to fit individual trading strategies.
Key Components (Sub-Indicators):
1. RPM (Relative Price Momentum):
- Measures cumulative price momentum over a specified period.
- Provides insights into price strength and directional bias.
- Input Customization:
- Source: Data for momentum calculation.
- Period: Length for momentum measurement.
- Resolution: Timeframe for data fetching.
2. BBO (Bull-Bear Oscillator):
- Calculates the strength of bullish or bearish momentum based on price movement and RSI conditions.
- Uses a super-smoothing technique for reliable signals.
- Customizable parameters include the oscillator's period and repainting options.
3. MACD (Moving Average Convergence Divergence):
- A classic momentum indicator for trend direction and strength.
- Provides buy/sell signals based on the crossover of the MACD line and signal line.
- Input Customization:
- Fast/Slow EMA Periods.
- Signal Line Period.
- Resolution and Source Data.
4. RSI (Relative Strength Index):
- Tracks overbought and oversold conditions.
- A key tool to validate trend continuation or reversals.
- Customizable period, resolution, and source.
5. CCI (Commodity Channel Index):
- Measures the deviation of price from its average.
- Useful for identifying cyclical trends.
- Input Customization includes period, resolution, and source.
6. Stochastic Oscillator:
- Indicates momentum by comparing closing prices to a range of highs and lows.
- Includes smoothing factors for %K and %D lines.
- Customizable parameters:
- %K Length and Smoothing.
- Resolution and Repainting Options.
7. Supertrend:
- A trailing stop-and-reverse system for trend-following strategies.
- Excellent for identifying strong trends and potential reversals.
- Inputs include the multiplier factor and period for ATR-like calculations.
Inputs Overview:
The indicator supports extensive customization for each sub-indicator, grouped under intuitive categories:
- Color Settings: Define bullish and bearish plot colors.
- RPM, BBO, MACD, RSI, CCI, Stochastic, and Supertrend Settings: Tailor each sub-indicator's behavior with adjustable parameters.
- UI Options: Toggle features such as bar coloring, indicator names, and plotted candles.
Trade Signals:
- Long Signal:
- All indicators align in a bullish state:
- RPM > 0, MACD > 0, RSI > 50, Stochastic > 50, CCI > 0, BBO > 0, Supertrend below price.
- Plot: Green triangle below the candle.
- Alert: Notifies the trader of a potential long entry.
- Short Signal:
- All indicators align in a bearish state:
- RPM < 0, MACD < 0, RSI < 50, Stochastic < 50, CCI < 0, BBO < 0, Supertrend above price.
- Plot: Red triangle above the candle.
- Alert: Notifies the trader of a potential short entry.
Features:
- Enhanced Visuals: Plots sub-indicator statuses using labels and color-coded shapes for clarity.
- Alerts: Integrated alert conditions for both long and short trades.
- Bar Coloring: Provides overall trend bias with green (bullish), red (bearish), or gray (neutral) bars.
- Customizable Table: Displays the indicator's status in the chart’s top-right corner.
Trading Benefits:
The LiquidFusion SignalPro excels in generating high-quality entries and exits by:
- Reducing noise through multiple indicator alignment.
- Supporting multiple timeframes and resolutions for flexibility.
- Offering customizable inputs for personalized trading strategies.
Use this tool to enhance your market analysis and improve your trading performance.
Disclaimer:
The content provided, including all code and materials, is strictly for educational and informational purposes only. It is not intended as, and should not be interpreted as, financial advice, a recommendation to buy or sell any financial instrument, or an offer of any financial product or service. All strategies, tools, and examples discussed are provided for illustrative purposes to demonstrate coding techniques and the functionality of Pine Script within a trading context.
Any results from strategies or tools provided are hypothetical, and past performance is not indicative of future results. Trading and investing involve high risk, including the potential loss of principal, and may not be suitable for all individuals. Before making any trading decisions, please consult with a qualified financial professional to understand the risks involved.
By using this script, you acknowledge and agree that any trading decisions are made solely at your discretion and risk.
This indicator is inspired by the Super 6x Indicators: RSI, MACD, Stochastic, Loxxer, CCI, and Velocity . A special thanks to Loxx for their relentless effort, creativity, and contributions to the TradingView community, which served as a foundation for this work.
Happy trading and best regards
Chervolino

XAUUSD Multi-Timeframe Trend AnalyzerOverview
The "XAUUSD Multi-Timeframe Trend Analyzer" is an advanced script designed to provide a comprehensive analysis of the XAUUSD (Gold/US Dollar) trend across multiple timeframes simultaneously. By combining several key technical indicators, this tool helps traders quickly assess the market direction and trend strength for M15, M30, H1, H4, and D1 timeframes.
Multi-Timeframe Analysis: Displays the trend direction and strength across M15, M30, H1, H4, and D1 timeframes, allowing for a complete overview in a single glance.
Comprehensive Indicator Blend: Utilizes six popular technical indicators to determine the trend—Moving Averages, RSI, MACD, Bollinger Bands, DMI, and Parabolic SAR.
Trend Strength Scoring: Provides a numerical trend strength score (from -6 to 6) based on the alignment of the indicators, with positive values indicating uptrends and negative values for downtrends.
Visual Table Display: Displays results in a color-coded table (green for uptrend, red for downtrend, yellow for neutral) with a strength score for each timeframe, helping traders quickly assess market conditions.
How It Works
This script calculates the overall trend and its strength for each selected timeframe by analyzing six widely-used technical indicators:
Moving Averages (MA): The script uses a Fast and a Slow Moving Average. When the Fast MA crosses above the Slow MA, it indicates an uptrend. When the Fast MA crosses below, it signals a downtrend.
Relative Strength Index (RSI): The RSI is used to assess momentum. An RSI value above 50 suggests bullish momentum, while a value below 50 suggests bearish momentum.
Moving Average Convergence Divergence (MACD): MACD measures momentum and trend direction. When the MACD line crosses above the signal line, it signals bullish momentum; when it crosses below, it signals bearish momentum.
Bollinger Bands: These measure price volatility. When the price is above the middle Bollinger Band, the script considers the trend to be bullish, and when it's below, bearish.
Directional Movement Index (DMI): The DMI compares positive directional movement (DI+) and negative directional movement (DI-). A stronger DI+ over DI- signals an uptrend and vice versa.
Parabolic SAR: This indicator is used for determining potential trend reversals and setting stop-loss levels. If the price is above the Parabolic SAR, it indicates an uptrend, and if below, a downtrend.
Trend Strength Calculation
The script calculates a trend strength score for each timeframe:
Each indicator adds or subtracts 1 to the score based on whether it aligns with an uptrend or a downtrend.
A score of 6 indicates a Strong Uptrend, with all indicators aligned bullishly.
A score of -6 indicates a Strong Downtrend, with all indicators aligned bearishly.
Intermediate scores (e.g., 2 or -2) indicate Weak Uptrend or Weak Downtrend, suggesting that not all indicators are in agreement.
A score between 1 and -1 indicates a Neutral trend, suggesting uncertainty in the market.
How to Use
Assess Trend Direction and Strength: The table provides an easy-to-read summary of the trend and its strength on different timeframes. Look for timeframes where the strength is high (either 6 for a strong uptrend or -6 for a strong downtrend) to confirm the market’s overall direction.
Use in Conjunction with Other Strategies: This indicator is designed to provide a comprehensive view of the market. Traders should combine it with other strategies, such as price action analysis or candlestick patterns, to further confirm their trades.
Trend Reversal or Continuation: A weak trend (e.g., a strength of 2 or -2) could signal a possible reversal or a trend that has lost momentum. Strong trends (with a strength of 6 or -6) indicate higher confidence in trend continuation.
Multiple Timeframe Confirmation: Look for alignment across multiple timeframes to confirm the strength and direction of the trend before entering trades. For example, if M15, M30, and H1 are all showing a strong uptrend, it suggests a higher probability of the trend continuing.
Customization Options
- Adjustable Indicators: Users can modify the length and parameters of the Moving Averages, RSI, MACD, Bollinger Bands, DMI, and Parabolic SAR to suit their trading style.
- Flexible Timeframes: You can toggle between different timeframes (M15, M30, H1, H4, D1) to focus on the intervals most relevant to your strategy.
Ideal For
- Traders looking for a detailed, multi-timeframe trend analysis tool for XAUUSD.
- Traders who rely on trend-following strategies and need confirmation across multiple timeframes.
- Those who prefer a multi-indicator approach to avoid false signals and improve the accuracy of their trades.
Disclaimer
This indicator is for informational and educational purposes only. It is recommended to combine this with proper risk management strategies and your own analysis. Past performance does not guarantee future results. Always perform your own due diligence before making trading decisions.

Mars Signals - SSL Trend AnalyzerIntroduction
The "Mars Signals - Precision Trend Analyzer with SSL Baseline & Price Action Zones" is a comprehensive technical analysis tool designed for traders seeking to enhance their market analysis and trading strategies. This indicator integrates multiple advanced trading concepts, including dynamic moving averages, trend detection algorithms, momentum indicators, volume analysis, higher timeframe confirmation, candlestick pattern recognition, and precise price action zones. By combining these elements, the indicator aims to provide clear and actionable buy and sell signals, helping traders to make informed decisions in various market conditions.
Core Components and Functionality
1.Dynamic Baseline Calculation
Moving Average Types: The indicator allows users to select from a variety of moving average types for the baseline calculation, including Simple Moving Average (SMA), Exponential Moving Average (EMA), Hull Moving Average (HMA), Weighted Moving Average (WMA), Double EMA (DEMA), Triple EMA (TEMA), Least Squares Moving Average (LSMA), Triangular Moving Average (TMA), Kijun (from Ichimoku Kinko Hyo), and McGinley's Dynamic.
Baseline Length: Users can customize the length of the moving average, providing flexibility to adjust the sensitivity of the baseline to market movements.
Signal Line Generation: The indicator computes a dynamic signal line based on the relationship between the close price and the moving averages of the high and low prices. This signal line adapts to market volatility and trend changes.
2.SSL Baseline Integration
SSL Baseline: In addition to the primary baseline, the indicator incorporates an SSL (Semaphore Signal Level) Baseline, which further refines trend detection by considering the highs and lows over a specified period.
Dual Confirmation: The combination of the primary baseline and the SSL baseline enhances the reliability of the trend signals by requiring agreement between both baselines before generating a signal.
3.Momentum and Trend Filters
Relative Strength Index (RSI): The indicator uses the RSI to assess the momentum of price movements, filtering out signals that occur during overbought or oversold conditions.
Moving Average Convergence Divergence (MACD): The MACD is employed to identify the direction and strength of the trend, adding another layer of confirmation to the signals.
Average Directional Index (ADX): The ADX measures the strength of the trend, ensuring that signals are generated only when the market shows significant directional movement.
4.Volume Analysis
Volume Filter: An optional volume filter compares the current volume to its moving average, allowing traders to focus on signals that occur during periods of higher market activity.
5.Higher Timeframe Confirmation
Multi-Timeframe Analysis: The indicator can incorporate data from a higher timeframe, comparing the current price to the higher timeframe's baseline and signal line. This feature helps traders align their trades with the broader market trend.
6.Candlestick Pattern Recognition
Bullish Patterns: The indicator detects bullish patterns such as Bullish Engulfing, Piercing Line, Hammer, and Doji.
Bearish Patterns: It also identifies bearish patterns like Bearish Engulfing, Dark Cloud Cover, Shooting Star, and Doji.
Pattern Prioritization: The patterns are prioritized to highlight the most significant formations, which can serve as additional confirmation for trade entries and exits.
7.Price Action Zones
Support and Resistance Levels: The indicator automatically identifies pivot highs and lows to establish dynamic support and resistance levels.
Zone Visualization: It draws shaded rectangles on the chart to represent these zones, providing a clear visual aid for potential reversal or breakout areas.
ATR-Based Zone Width: The zones' thickness is dynamically calculated using the Average True Range (ATR), adjusting to the current market volatility.
Background Coloring: The chart background changes color when the price is above the maximum resistance or below the minimum support, alerting traders to significant price movements.
Interpreting the Signals
1.Buy Signals
Conditions:
Price crosses above the signal line.
RSI is below 70 (not overbought).
MACD line is above the signal line (indicating bullish momentum).
ADX is above the user-defined threshold (default is 20), confirming a strong trend.
(Optional) Volume is above its moving average if the volume filter is enabled.
(Optional) Price is above the higher timeframe baseline and signal line if the higher timeframe filter is enabled.
(Optional) A bullish candlestick pattern is detected if the candlestick pattern filter is enabled.
Visual Indicators:
An upward-pointing label with the text "BUY" appears below the price bar.
The baseline and SSL baseline lines turn to colors indicating bullish conditions.
2.Sell Signals
Conditions:
Price crosses below the signal line.
RSI is above 30 (not oversold).
MACD line is below the signal line (indicating bearish momentum).
ADX is above the user-defined threshold, confirming a strong trend.
(Optional) Volume is above its moving average if the volume filter is enabled.
(Optional) Price is below the higher timeframe baseline and signal line if the higher timeframe filter is enabled.
(Optional) A bearish candlestick pattern is detected if the candlestick pattern filter is enabled.
Visual Indicators:
A downward-pointing label with the text "SELL" appears above the price bar.
The baseline and SSL baseline lines turn to colors indicating bearish conditions.
3.Support and Resistance Zones
Interpretation:
Resistance Zones: Represent areas where the price may face selling pressure. A break above these zones can signal a strong bullish move.
Support Zones: Represent areas where the price may find buying interest. A break below these zones can signal a strong bearish move.
Background Color:
The background turns red when the price is above the maximum resistance, indicating potential overextension.
The background turns green when the price is below the minimum support, indicating potential undervaluation.
Effective Usage Strategies
1.Customization
Adjusting Baseline and SSL Settings: Traders should experiment with different moving average types and lengths to match their trading style and the specific characteristics of the asset being analyzed.
Filtering Parameters: Modify RSI, MACD, and ADX settings to fine-tune the sensitivity of the signals.
Volume and Higher Timeframe Filters: Enable these filters to add robustness to the signals, especially in volatile markets or when trading higher timeframes.
2.Combining with Other Analysis
Fundamental Analysis: Use the indicator in conjunction with fundamental insights to validate technical signals.
Risk Management: Always apply proper risk management techniques, such as setting stop-loss and take-profit levels based on the support and resistance zones provided by the indicator.
3.Backtesting
Historical Analysis: Utilize the indicator's settings to backtest trading strategies on historical data, helping to identify the most effective configurations before applying them in live trading.
4.Monitoring Market Conditions
Volatility Awareness: Pay attention to the ATR and ADX readings to understand market volatility and trend strength, adjusting strategies accordingly.
Event Considerations: Be cautious around major economic announcements or events that may impact market behavior beyond technical indications.
Indicator Inputs and Customization Options
Baseline Type and Length: Select from multiple moving average types and specify the period length.
ADX Settings: Adjust the length, smoothing, and threshold for trend strength confirmation.
Volume Filter: Enable or disable the volume confirmation filter.
Higher Timeframe Filter: Choose to incorporate higher timeframe analysis and specify the desired timeframe.
Candlestick Patterns: Enable or disable the detection of candlestick patterns for additional signal confirmation.
SSL Baseline Type and Length: Customize the SSL baseline settings separately from the primary baseline.
Price Action Zones Settings:
Zone Thickness: Adjust the visual thickness of the support and resistance zones.
Lookback Period: Define how far back the indicator looks for pivot points.
ATR Multiplier for Zone Width: Set the multiplier for ATR to determine the dynamic width of the zones.
Maximum Number of Zones: Limit the number of support and resistance zones displayed.
Pivot Bars: Customize the number of bars to the left and right used for identifying pivot highs and lows.
Conclusion
The "Mars Signals - Precision Trend Analyzer with SSL Baseline & Price Action Zones" is a versatile and powerful tool that amalgamates essential technical analysis techniques into a single, user-friendly indicator. By providing clear visual signals and incorporating multiple layers of confirmation, it assists traders in identifying high-probability trading opportunities. Whether you are a day trader, swing trader, or long-term investor, this indicator can be tailored to suit your trading style and enhance your decision-making process.
To maximize the benefits of this indicator:
Understand Each Component: Familiarize yourself with how each part of the indicator contributes to the overall signal generation.
Customize Thoughtfully: Adjust the settings based on the asset class, market conditions, and your risk tolerance.
Practice Diligently: Use demo accounts or paper trading to practice and refine your strategy before deploying it in live markets.
Stay Informed: Continuously educate yourself on technical analysis and market dynamics to make the most informed decisions.
Disclaimer
Trading financial markets involves risk, and past performance is not indicative of future results. This indicator is a tool to aid in analysis and should not be the sole basis for any trading decision. Always conduct your own research and consider consulting with a licensed financial advisor.

Uptrick : HMA Adaptive Trend and Volatility BandsThis proprietary trading indicator, named "Uptrick: HMA Adaptive Trend and Volatility Bands," offers a sophisticated blend of trend detection and volatility measurement for financial markets. Designed to overlay directly on the price chart, it leverages a variety of technical analysis tools to provide clear visual signals and comprehensive market insights.
Key Features:
Hull Moving Average (HMA) with Volatility Bands:
HMA Calculation: Utilizes the Hull Moving Average (HMA) for smooth trend identification, applied to the average price of high and low (hl2).
Adaptive Volatility Bands: Incorporates bands around the HMA based on a responsive standard deviation adjusted by an Exponential Moving Average (EMA). These bands dynamically expand and contract with market volatility.
Parameters:
Length: Configurable period for the HMA and standard deviation (default 14).
Multiplier: Determines the width of the bands (default 2.0).
MACD (Moving Average Convergence Divergence):
MACD Calculation: Includes fast and slow EMA periods with a signal line to detect trend direction and strength.
Histogram: Difference between MACD line and signal line to visualize momentum.
Parameters:
Fast Length: Short-term EMA period (default 6).
Slow Length: Long-term EMA period (default 13).
Signal Length: Signal line EMA period (default 5).
Relative Strength Index (RSI):
RSI Calculation: Measures the speed and change of price movements to identify overbought or oversold conditions.
Parameter:
RSI Length: Period for RSI calculation (default 10).
Average True Range (ATR):
ATR Calculation: Evaluates market volatility by considering the true range over a specified period.
Parameter:
ATR Length: Period for ATR calculation (default 7).
Volume and Liquidity Analysis:
Volume: Directly incorporated into the indicator to gauge market activity.
Liquidity: Assessed using the HMA of volume to determine the ease of trade execution.
Parameter:
Liquidity Length: Period for HMA of volume calculation (default 14).
Trend Identification:
Uptrend Conditions: A combination of positive MACD histogram, RSI above 50, ATR above its HMA, and volume exceeding liquidity.
Downtrend Conditions: Negative MACD histogram, RSI below 50, ATR above its HMA, and volume exceeding liquidity.
Visual Cues: Color-coded background (green for uptrend, red for downtrend) with corresponding labels on the price chart to indicate trend shifts.
Additional Moving Averages and Bollinger Bands:
SMA (Simple Moving Average): Includes 50 and 200-period SMAs for long-term trend analysis.
EMA (Exponential Moving Average): Includes a 20-period EMA for short-term trend analysis.
Bollinger Bands: Standard deviation bands around a 20-period SMA to measure market volatility and identify potential breakout points.
Information Table:
Real-Time Data Display: An optional table that provides current values for key metrics such as price, volume, liquidity, ATR, RSI, MACD histogram, SMAs, EMA, Buy+Sell Pressure, ATH, Global liquidity, Distance from ATH and Bollinger Bands, offering traders a comprehensive snapshot of market conditions.
Visualization:
Upper and Lower Bands: Clearly plotted with distinct colors (blue for upper, red for lower) to highlight volatility boundaries.
Trend Labels: Automatic annotations on the chart to signal uptrend and downtrend conditions.
Background Highlighting: Subtle shading to visually emphasize prevailing trend conditions.
This indicator is designed for traders seeking an advanced tool to detect trends, measure volatility, and make informed trading decisions based on comprehensive technical analysis. By integrating multiple technical indicators and providing clear visual signals, it aims to enhance trading accuracy and market insight.
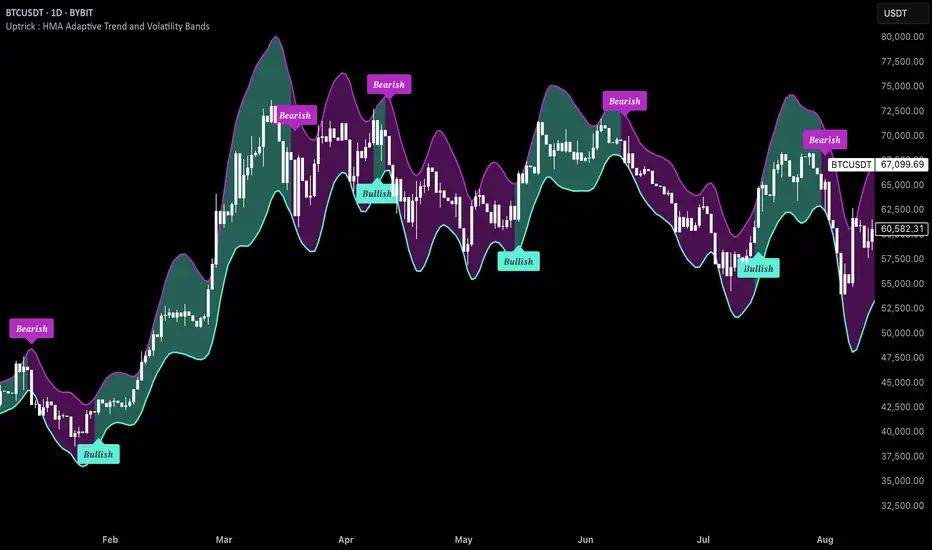
CulturaTrading IndicadorThe CULTURATRADING INDICATOR refines trading signals by integrating advanced analysis techniques across RSI, MACD, and ADX indicators. Here's a deep dive into its functionalities:
RSI Analysis:
Buying Signal Identification: The RSI component is calibrated not just to flag potential reversal points but to identify strong momentum. An RSI exceeding 60 is not merely an overbought signal; it indicates a robust buying momentum when it turns blue, aligning with CULTURATRADING STRATEGY's criteria for a potential long position.
Level 55 Significance: This level acts as a transitional threshold. When the RSI retreats below this point, it suggests a weakening momentum, prompting a reassessment of open positions.
Oversold Condition & Action: An RSI dipping below 40 signals an oversold condition, turning red, and aligning with a potential for a next long signal. staying alert when RSI stay over 40 level again and over on RSI Moving Average Following the idea CULTURATRADING STRATEGY.
Moving Average on RSI (MA RSI):
The inclusion of a Moving Average on the RSI serves as a trend filter. When the RSI is above the MA RSI, it underscores the strength of the current trend; conversely, if the RSI falls below the MA RSI, it calls for close all RSI long trade.
Volatility Histogram:
Color Coding & Market Response: The histogram changes colors based on market volatility and trend strength. Blue indicates a bullish trend continuation, where traders might consider entering long or holding positions. Rose suggests a market shift where traders should be vigilant, potentially taking profits from long or opening shorts positions. Grey denotes low volatility, signaling a period of market indecision where entering new trades may carry higher risk. staying out
Stop-Loss Placement: The histogram assists in identifying optimal stop-loss levels, providing visual cues for setting them just beyond the recent volatility extremes to protect against market whipsaws.
ADX Trend Strength Layer:
This layer offers a visual representation of the trend's strength. A rising ADX above the 25 level with a slope on the MACD line indicates a strong trend and defining directionality to trade (long if it close blue or short if its close rose), reinforcing the confidence in following the trend.
Usage & Importance:
While the CULTURATRADING STRATEGY provides a robust framework for trade execution, the CULTURATRADING INDICATOR is crucial for visualizing and confirming the signals it generates. It simplifies the complex interplay of various technical signals into a coherent visual format, aiding traders in making informed decisions.
The combination of RSI, MA RSI, and the volatility histogram offers a tri-layered approach to market analysis, enabling traders to discern between strong trends, pullbacks, and consolidations.
By integrating these elements, the CULTURATRADING INDICATOR serves as an indispensable tool for traders utilizing the CULTURATRADING STRATEGY, providing clarity and enhancing decision-making efficacy.
Disclaimer:
This indicator is designed for educational purposes to provide a visual aid in market analysis. Traders are advised to use it as part of a comprehensive risk-managed strategy. It is not intended as financial advice.
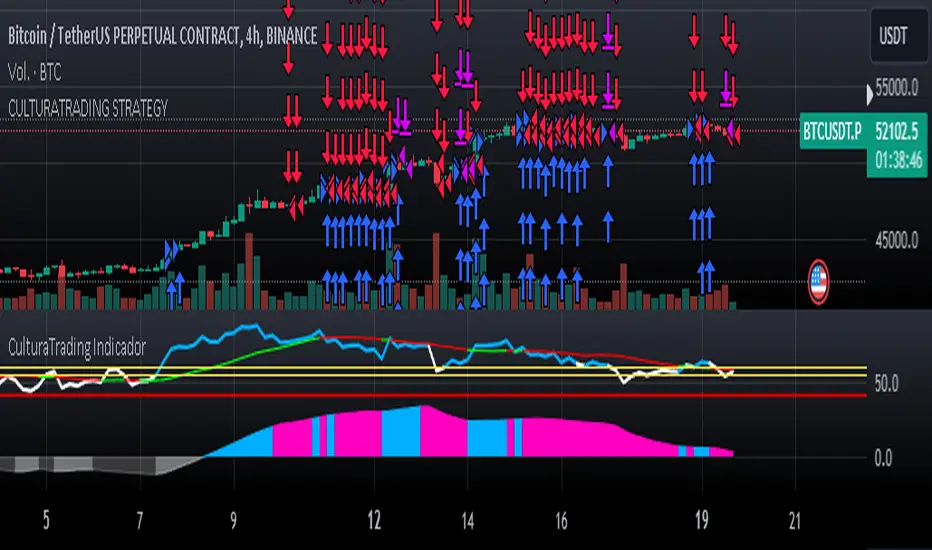
Choose Symbol, Mode with Hull,Stochatic Mom,EMA,MACD,RSI,TableThis Pine Script code is a comprehensive indicator for the TradingView platform, offering a variety of technical analysis tools. Below is an English introduction to its features and purposes:
Introduction:
This indicator is designed for traders on TradingView and provides a multi-functional analysis toolset. It includes different charting modes (Heikin-Ashi, Linear, and Normal), a Hull Moving Average (Hull), Stochastic Momentum, RSI (Relative Strength Index), MACD (Moving Average Convergence Divergence), EMA (Exponential Moving Average), Bollinger Bands, and a summary table displaying key metrics.
Key Features:
Charting Modes:
Users can choose between "Heikin-Ashi," "Linear," or "Normal" modes to visualize price data in different ways.
Hull Moving Average:
The script incorporates the Hull Moving Average for trend analysis, highlighting potential buy and sell signals.
Stochastic Momentum:
Stochastic Momentum, with customizable parameters (K, D, and Smooth), is included to identify overbought and oversold conditions.
RSI (Relative Strength Index):
RSI is calculated and displayed, aiding in identifying potential trend reversals or exhaustion points.
MACD (Moving Average Convergence Divergence):
The MACD indicator is included, along with a histogram, to highlight changes in momentum and potential crossovers.
RSI Momentum:
RSI Momentum is calculated, providing additional insights into momentum changes.
Exponential Moving Averages (EMA):
The script calculates and displays three EMAs (Exponential Moving Averages) with customizable periods.
Bollinger Bands:
Bollinger Bands are incorporated, offering insights into volatility and potential price reversals.
Summary Table:
A table is displayed on the chart summarizing key metrics, including Stochastic MoM, RSI, MACD, RSI EMA, Hull percentage change, and EMA values.
Customization:
Users have the option to customize various parameters, including chart modes, lengths of moving averages, Stochastic parameters, and more.
Usage:
The indicator aims to provide a comprehensive view of price action and potential trend changes. Traders can use it for technical analysis and decision-making.
Important Note:
This script is provided for educational purposes and does not constitute financial advice. Traders and investors should conduct their research and analysis before making any trading decisions.

Technical Analysis Notes👉 Hello trader.
- In the process of monitoring the list of trading pairs such as stocks, cryptocurrencies... I often mark signals such as: RSI divergence, MACD, Stochatic, RSI trendline, Trendline..."by hand" , like recording on a drawing board, or excell, notepad... Therefore, taking notes is very limited. In addition, each time frame gives different, inconsistent signals and it is difficult to analyze the trend of a trading pair. somehow.
- After a period of careful research, I created the "Technical Analysis notes" indicator to solve the problems mentioned above, and after using it, I personally found it very effective to mark it. Trading signals as well as trend analysis across time frames from small to large.
- For example: On weekends, I often use automatic scanning indicators (about 200 codes) RSI divergence, RSI trendline, Trendlines, MACD-histogram .. within a week, then mark trading pairs when there are signals. Signals such as RSI cutting its trend line, price breaking through the trend line, Histogram MACD divergence... in the weekly frame, from there look to the D1, H4 frames to see the next signals in those frames to find the direction of intersection. Move in the same direction as the weekly frame signal to trade in the same trend. From that analysis, I limit my ability to go against the trend, and wait patiently for the signals that have been noted before.
- On this board you can monitor 10 transaction codes (in real time)
- On this table I have given 4 different time frames (can be customized in settings)
- I add Kumo Cloud (ichimoku) signals on 4 time frames so that people can easily recognize the trend when the price is above the cloud (green circle), in the cloud (white circle), below the cloud (green circle). red circle)
- I add fast typing mode, shortcut typing depending on each person's description including 16 fast typing modes (for example: "ru:RSI br up" in my understanding means the RSI line has broken above the trend line direction)
- From the above example "ru:RSI br up" the sign ' : ' is the separator that must be present to interpret the word 'ru' as being typed quickly, and 'RSI br up' is the part that explains the content of that word typed quickly.
- In those 16 quick typing boxes (divided into 4 rows), the first 3 rows are colored with custom boxes for each person. The last remaining row is not filled.
- The content of note boxes can be hidden in the settings using the check box.
- In particular, the private notes column cannot be hidden, because it is the column for recording, synthesizing, analyzing, identifying main trends, or waiting points to place orders... (This box is the most important in my opinion. ..)
- Has a super smart warning mode (customizable) when Kumo cloud signals are in the same color on 4 time frames for the most certain trend (green - bullish, red - bearish)
- In the warning section, you can adjust from 4 time frames to 3 time frames, 2 time frames, 1 time frame.
- Alert mode lists exact code names when one or more codes qualify. (eg BTC, ADA, BNB...)
--------------------------------------------------------------------------------------------------------------------
👉 Vietnamess
- Trong quá trình theo dõi danh sách các cặp giao dịch như cổ phiếu, tiền điện tử...tôi thường đánh dấu các tín hiệu như : phân kì RSI, MACD, Stochatic, trendline RSI, Trendline ..."bằng tay", như ghi trên bảng vẽ, hoặc excell, notepad...Vì vậy ghi chép rất hạn chế ngoài ra mỗi khung thời gian cho các tín hiệu khác nhau, không đồng nhất và rất khó để phân tích xu hướng của một cặp giao dịch nào đó.
- Sau một thời gian nghiên cứu kĩ lưỡng tôi có lập lên được chỉ báo "ghi chép Phân tích kĩ thuật " nhằm giải quyết các vấn đề nêu như trên, và sau quá trình dùng, cá nhân tôi thấy rất hiệu quả khi đánh dấu các tín hiệu giao dịch cũng như phân tích xu hướng qua các khung thời gian từ nhỏ đến lớn.
- Ví dụ: Cuối tuần tôi thường dùng chỉ báo quét tự động(khoảng 200 mã) RSI phân kì, RSI trendline, Trendlines , MACD-histogram .. trong khung 1 tuần, sau đó đánh dấu những cặp giao dịch khi có những tín hiệu như RSI cắt đường xu hướng của nó, giá đột phá đường xu hướng, phân kì Histogram MACD.. trong khung tuần, từ đó tìm đến những khung D1,H4 xem các tín hiệu tiếp theo trong các khung đó để tìm hướng giao dịch cùng hướng với tín hiệu khung tuần để giao dịch cùng xu hướng. Từ những phân tích đó tôi hạn chế được đi ngược xu hướng, và kiên nhẫn chờ đợi khi có tín hiệu được đã ghi chú từ trước.
- Trên bảng này có thể theo õi được 10 mã giao dịch(theo thời gian thực)
- Trên bảng này tôi có đưa ra 4 khung thời gian khác nhau(có thể tùy chỉnh trong thiết lập)
- Tôi đưa thêm tín hiệu Mây Kumo( ichimoku) trên 4 khung thời gian để mọi người từ đó dễ dàng nhận biết xu hướng khi giá trên mây(dấu tròn xanh lá) , trong mây(dấu tròn trắng) , dưới mây(dấu tròn đỏ)
- Tôi đưa thêm chế độ gõ nhanh, gõ tắt tùy theo diễn tả của mỗi người gồm 16 chế độ gõ nhanh (ví dụ: "ru:RSI br up" theo ý hiểu của tôi là đường RSI đã phá vỡ lên trên đường xu hướng)
- Từ ví dụ trên "ru:RSI br up" dấu ' : ' là ngăn cách phải có để diễn giải từ 'ru' là gõ nhanh, còn 'RSI br up' là phần diễn giải nội dung của từ gõ nhanh đó
- Trong 16 ô gõ nhanh đó(được chia làm 4 hàng) có 3 hàng đầu được tô màu ô tùy chỉnh cầu mỗi người. hàng cuối cùng còn lại không được tô.
- Nội dung các ô ghi chú có thể được ẩn hiện trong mục cài đặt bằng ô dấu tích.
- Đặc biệt cột ghi chú riêng tư không ẩn được, vì đó là cột ghi chép, tổng hợp , phân tích , nhận định xu hướng chính, hay điểm chờ để đặt lệnh...(ô này theo tôi là quan trọng nhất...)
- Có chế độ cảnh báo siêu thông minh(có thể tùy chỉnh) khi tín hiệu mây Kumo cùng trên 4 khung thời gian cùng màu cho xu hướng chắc chắn nhất(xanh- tăng giá, đỏ- giảm giá)
- Trong mục cảnh báo có thể điều chỉnh từ 4 khung thời gian xuống còn 3 khung thời gian, 2 khung thời gian, 1 khung thời gian.
- Chế độ cảnh báo được liệt kê tên mã chính xác khi một hay nhiều mã đủ điều kiện .(ví dụ BTC , ADA , BNB...)