Trailing Stop-Loss Indicator (FinnoVent)The Dynamic 9 EMA Trailing Stop-Loss Indicator is a specialized tool designed for the TradingView community to enhance risk management in trading. This script dynamically adjusts a trailing stop-loss level based on the position of the price relative to a 9-period Exponential Moving Average (EMA), offering traders a systematic approach to protect potential profits and limit downside risk.
Functionality:
Adaptive Trailing Stop: The indicator calculates a trailing stop-loss that adjusts with the 9 EMA, providing a responsive method to secure gains or prevent extensive losses.
EMA Trend Indicator: The 9-period EMA serves as a momentum indicator, with the script adjusting the trailing stop-loss accordingly — above the EMA for short positions and below for long positions.
Entry Signal Visualization: Entry signals are visualized on the chart, indicating potential long and short positions based on price crossovers with the EMA.
Application:
This indicator is ideal for traders who utilize technical analysis to make informed decisions. By automatically adjusting the stop-loss level to the evolving market conditions, it is particularly useful for:
Day traders looking to capitalize on short-term price movements.
Swing traders aiming to secure positions during more extended market waves.
Any trading strategy that benefits from dynamic stop-loss management.
Usage:
To use the indicator, simply add it to your TradingView chart, and it will automatically plot the trailing stop levels. The green and red lines represent the trailing stops for long and short positions, respectively, providing clear visual cues for potential exit points.
Compliance with TradingView House Rules:
This script is provided for educational purposes and does not constitute investment advice. It is a unique creation that has been developed to contribute to the TradingView community by offering a tool that helps traders manage their trades more effectively.
在脚本中搜索"Trailing stop"

Trailing StopMost of the trailing stops on TradingView are made of using the lowest lows and the highest highs. Not many are based around what I called the volatile trailing stop.
This is where the trailing stop will move around according to a set percentage difference from the previous closing value. This allows you to say "If the current bar moves x percent, then stop". The script I've made here is a simple version of that with a few options for smoothing and setting the percent change.
Disclaimer: This is not financial advice, please do your own research before making any decisions.

TRAILING STOP LOSS TO LONG AND SHORT##THIS SCRIPT IS ON GITHUB
This TradingView strategy it is designed to integrate with other strategies with indicators.
It performs a trailing stop loss from entry and exit conditions.
In this strategy you can add conditions for long and short positions.
The strategy will ride up your stop loss when price moviment 1%.
The strategy will close your operation when the market price crossed the stop loss.
Also is possible to select the period that strategy will execute the backtest.
The strategy has the following parameters:
+ **INITIAL STOP LOSS** - Where can isert the value to first stop.
+ **POSITION TYPE** - Where can to select trade position.
+ **BACKTEST PERIOD** - To select range.
## DISCLAIMER
1. I am not licensed financial advisors or broker dealers. I do not tell you when or what to buy or sell. I developed this software which enables you execute manual or automated trades multiple trades using TradingView. The software allows you to set the criteria you want for entering and exiting trades.
2. Do not trade with money you cannot afford to lose.
3. I do not guarantee consistent profits or that anyone can make money with no effort. And I am not selling the holy grail.
4. Every system can have winning and losing streaks.
5. Money management plays a large role in the results of your trading. For example: lot size, account size, broker leverage, and broker margin call rules all have an effect on results. Also, your Take Profit and Stop Loss settings for individual pair trades and for overall account equity have a major impact on results. If you are new to trading and do not understand these items, then I recommend you seek education materials to further your knowledge.
**YOU NEED TO FIND AND USE THE TRADING SYSTEM THAT WORKS BEST FOR YOU AND YOUR TRADING TOLERANCE.**
**I HAVE PROVIDED NOTHING MORE THAN A TOOL WITH OPTIONS FOR YOU TO TRADE WITH THIS PROGRAM ON TRADINGVIEW.**
## NOTE
I accept suggestions to improve the script.
If you encounter any problems I will be happy to share with me.
+ Authors: @exit490
+ Revision: v1.0.0
+ Date: 03-Aug-2019
+ Pinescript version: 4
## LICENSE
Copyright 2019 Mauricio Pimenta / exit490
Trailing Stop Loss script may be freely distributed under the MIT license .

Trailing Stop Loss [TradingFinder] 4 Machine Learning Methods🔵 Introduction
The trailing stop indicator dynamically adjusts stop-loss (SL) levels to lock in profits as price moves favorably. It uses pivot levels and ATR to set optimal SL points, balancing risk and reward.
Trade confirmation filters, a key feature, ensure entries align with market conditions, reducing false signals. In 2023 a study showed filtered entries improve win rates by 15% in forex. This enhances trade precision.
SL settings, ranging from very tight to very wide, adapt to volatility via ATR calculations. These settings anchor SL to previous pivot levels, ensuring alignment with market structure. This caters to diverse trading styles, from scalping to swing trading.
The indicator colors the profit zone between the entry point (EP) and SL, using light green for buy trades and light red for sell trades. This visual cue highlights profit potential. It’s ideal for traders seeking dynamic risk management.
A table displays real-time trade details, including EP, SL, and profit/loss (PNL). Backtests show trailing stops cut losses by 20% in trending markets. This transparency aids decision-making.
🔵 How to Use
🟣 SL Levels
The trailing stop indicator sets SL based on pivot levels and ATR, offering four options: very tight, tight, wide, or very wide. Very tight SLs suit scalpers, while wide SLs fit swing traders. Select the base level to match your strategy.
If price hits the SL, the trade closes, and the indicator evaluates the next trade using the selected filter. This ensures disciplined trade management. The cycle restarts with a new confirmed entry.
Very tight SLs, set near recent pivots, trigger exits early to minimize risk but limit profits in volatile markets. Wide SLs, shown as farther lines, allow more price movement but increase exposure to losses. Adjust based on ATR and conditions, noting SL breaches open new positions.
🟣 Visualization
The indicator’s visual cues, like colored profit zones, simplify monitoring, with light green showing the profit area from EP to trailed SL. Dashed lines mark entry points, while solid lines track the trailed SL, triggering new positions when breached.
When price moves into profit, the area between EP and SL is colored—light green for longs, light red for shorts. This highlights the profit zone visually. The SL trails price, locking in gains as the trade progresses.
🟣 Filters
Upon trade entry, the indicator requires confirmation via filters like SMA 2x or ADX to validate momentum. Filters reduce false entries, though no guarantee exists for improved outcomes. Monitor price action post-entry for trade validity.
Filters like Momentum or ADX assess trend strength before entry. For example, ADX above 25 confirms strong trends. Choose “none” for unfiltered entries.
🟣 Bullish Alert
For a bullish trade, the indicator opens a long position with a green SL Line (after optional filters), trailing the SL below price. Set alerts to On in the settings for notifications, or Off to monitor manually.
🟣 Bearish Alert
In a bearish trade, the indicator opens a short position with a red SL Line post-confirmation, trailing the SL above price. With alerts On in the settings, it notifies the potential reversal.
🟣 Panel
A table displays all trades’ details, including Win Rates, PNL, and trade status. This real-time data aids in tracking performance. Check the table to assess trade outcomes instantly.
Review the table regularly to evaluate trade performance and adjust settings. Consistent monitoring ensures alignment with market dynamics. This maximizes the indicator’s effectiveness.
🔵 Settings
Length (Default: 10) : Sets the pivot period for calculating SL levels, balancing sensitivity and reliability.
Base Level : Options (“Very tight,” “Tight,” “Wide,” “Very wide”) adjust SL distance via ATR.
Show EP Checkbox : Toggles visibility of the entry point on the chart.
Show PNL : Displays profit/loss data for active and closed trades.
Filter : Options (“none,” “SMA 2x,” “Momentum,” “ADX”) validate trade entries.
🔵 Conclusion
The trailing stop indicator, a dynamic risk management tool, adjusts SLs using pivot levels and ATR. Its confirmation filters reduce false entries, boosting precision. Backtests show 20% loss reduction in trending markets.
Customizable SL settings and visual profit zones enhance usability across trading styles. The real-time table provides clear trade insights, streamlining analysis. It’s ideal for forex, stocks, or crypto.
While filters like ADX improve entry accuracy, no setup guarantees success in all conditions. Contextual analysis, like trend strength, is key. This indicator empowers disciplined, data-driven trading.

Trailing Stop AlertsThis script is designed as an ATR-based trailing stop tool to assist in managing open positions.
Once you're involved in a profitable trade, if you add this script to your chart you'll be prompted to select a bar to begin trailing from.
You can then adjust the candle lookback distance for swing high/lows (7 by default), the ATR multiplier (1.0 by default), and the direction to trail (Long/Short).
You can also adjust the ATR period in the settings menu if you want to (14 period by default).
Once the script is added to your chart, it will begin drawing your trailing stop and you can then set up alerts.
Alert Options:
Any alert() function call : Will trigger an alert for both conditions (trailing stop updated, trailing stop hit)
Alert Conditions : Trailing Stop Update will trigger whenever the stop is updated, Trailing Stop Hit will trigger whenever the stop is hit.
Note: the alerts will only fire once per bar close and the trailing stop will not update on realtime bars.

Trailing Stop Loss SuperTrendThe Trailing Stop Loss SuperTrend indicator is a popular technical analysis tool used by traders to identify trends and determine optimal entry and exit points in financial markets. This indicator combines elements of the SuperTrend indicator and trailing stop loss orders to provide valuable insights into market trends and potential reversals. By incorporating Average True Range (ATR) calculations, it adapts to market volatility, making it suitable for various trading strategies. Let's explore the key use cases and benefits of the Trailing Stop Loss SuperTrend indicator:
Trend Identification:
The primary purpose of the Trailing Stop Loss SuperTrend indicator is to identify market trends. It plots two lines on the chart: an upper band (referred to as the "up" line) and a lower band (referred to as the "dn" line). The direction of these bands helps traders determine the prevailing trend. When the price is above the upper band, it suggests a bullish trend, and when it is below the lower band, it indicates a bearish trend.
Entry and Exit Signals:
The Trailing Stop Loss SuperTrend indicator generates entry and exit signals based on trend changes. When the trend changes from bearish to bullish, a buy signal is triggered, indicating a potential entry point. Conversely, when the trend changes from bullish to bearish, a sell signal is generated, suggesting a possible exit or short-selling opportunity. These signals can be used in conjunction with other trading strategies or indicators to enhance trading decisions.
Trailing Stop Loss Orders:
One of the distinguishing features of the Trailing Stop Loss SuperTrend indicator is its ability to incorporate trailing stop loss orders. Traders can use the indicator's upper and lower bands as trailing stop levels to protect profits and manage risk. For example, in a bullish trend, the stop loss level can be set at the lower band, and as the price rises, the stop loss level trails along with it, locking in profits and reducing potential losses.
Volatility Adaptation:
By incorporating the ATR (Average True Range) calculation, the Trailing Stop Loss SuperTrend indicator adjusts its sensitivity to market volatility. A higher ATR multiplier widens the distance between the price and the bands, accommodating higher volatility, while a lower multiplier tightens the bands during periods of lower volatility. This adaptability makes the indicator versatile and suitable for various market conditions.
Alerts and Notifications:
The Trailing Stop Loss SuperTrend indicator provides the ability to set alerts for specific events, such as trend changes, buy signals, and sell signals. Traders can receive real-time notifications via email, SMS, or on-platform alerts, ensuring they stay informed about potential trading opportunities and important market developments.
Conclusion:
The Trailing Stop Loss SuperTrend indicator is a valuable tool for traders seeking to identify trends, generate entry and exit signals, and effectively manage risk. Its ability to adapt to market volatility and incorporate trailing stop loss orders enhances trading strategies and decision-making. By combining the SuperTrend concept with trailing stop loss functionality, this indicator provides traders with a comprehensive approach to trend analysis and risk management. Whether used in isolation or in conjunction with other indicators, the Trailing Stop Loss SuperTrend indicator offers a powerful tool for navigating the dynamic world of financial markets.

MG - Pivot trailing stopTrailing stop with alerts which automatically updates when a new pivot forms to maximize the ability to ride trends and get out in a timely fashion.
Contains long and short stop trigger alerts.

Trailing Stop SnippetThis is an example snippet that should allow for adding a trailing stop and trailing stop activation to almost any script.
You can use it by setting a trailing stop alone. This will provide you standard trailing stop functionality allowing you to lock in profits and increase your stop-loss as the price moves in your direction.
You can also set the trailing stop activation to trigger the original trailing stop at a certain level. "Once price rises 5%, set a trailing stop at break even". This would be set as 5 and 5 in the settings.

Trailing Stop Loss MTFMultiple Time Frame Version of Trailing Stop Loss Indicator
TRAILING STOP LOSS INDICATOR is a helpful tool for traders to help one of the greatest problems that they face: where to sell?
by using trailing stop loss you can easily decide and see possible downward movements and understand if you are in a safe zone.
Using Trailing Stop Loss is just simple:
Go short/ Sell when price crosses down the indicator,
Stay on long position if prices are above the indicator.
The indicator is calculated from previous Lows and doesn't the value won't change until prices makes higher lows.
TURKISH EXPLANATION:
İz Süren Stop Loss İndikatörü
Adım 1- bu günün düşük fiyatından geriye doğru, daha düşük fiyatlı bir günle karşılaşıncaya kadar yatay bir çizgi çizin
bu sizin birinci countback’ iniz olacak.
Adım 2- bu yeni düşük günün düşük fiyatından geriye doğru tekrar bir başka düşük güne gelene kadar yatay bir çizgi
çekin. Bu sizin ikinci countback’ iniz olacak.
Adım 3- bu ikinci düşük günün düşüğünden ileri bu günkü tarihe kadar yatay bir çizgi çekin bu sizin talimat
verdiğinizde stop-loss noktanız oluyor.
Kural 1- asla aşağıya doğru stop koymayın. Eğer yeni stop-loss noktanız öncekinden daha düşükse onu atıyorsunuz.
Bu kural asla bozulmamalı.
Kural 2- countback çizginiz üzerindeki aynı düşük fiyata denk gelen günleri yok sayın. İkinci contback çizginizi çekmek
için ilkinden daha düşük bir nokta bulmalısınız. Eğer aynı düşük fiyata sahip bir çubuğa denk gelirseniz daha düşüğünü
buluncaya kadar devam edin. Gerçekten hepsi bu kadar. Bu kuralları uygulayarak stop-loss noktamızı her yeni günün
datası eklendikçe uzatabiliriz.
drive.google.com


Auto Trailing stoploss By InvestYourAsset💥The Auto Trailing Stop-Loss indicator is a technical indicator that uses the ATR (Average True Range) to calculate a trailing stop-loss for both long and short positions.
💥The signals according to the indicator allows traders to exit from the position before its too late! The indicator can be used to determine when to enter and exit trades.
💥To use the indicator, you simply need to set the input parameters to suit your trading style and risk tolerance. The default values for the parameters are:
p: The ATR period (14)
q: The stop period (20)
x: The multiplier used to calculate the initial high and initial low (1.5)
Calculations:
📈Calculates the ATR using the specified period you can modify ATR period according to your trading style.
📈Calculates the initial high and low stop levels based on the highest high and lowest low over the user defined ATR period.
📈Calculates short and long stoploss levels using the initial high and low stops.
💥Once you have set the input parameters according to your trading style whether you are a day trader or a swing trader, the indicator will plot the short stoploss, long stoploss, and stoploss hit signals on your chart.
💥You can use the indicator to enter and exit trades in a various ways.
For example,
🚀 you could enter a long trade when the price crosses above both red and green lines plotted on the chart. (or when price crosses over both short stoploss and long stoploss.) You could also use the indicator to secure your profits by moving your stop-loss up as the price moves in your favor.
Here is an example of how you could use the indicator to enter and exit trades:
🚀Enter a long trade when the price crosses above the red line or short stoploss.
✅keep Moving your stop-loss upward with the long stoploss or green line.
✅Exit the trade when the price crosses below the long stoploss or green line.
💥You can also use the indicator to protect your existing trades. For example, if you are already in a long trade, you could move your stop-loss up to the short stop when the price moves up 10%. This will help you to protect your profits in case the price starts to move against you.
💥💥some additional tips for using the Auto Trailing Stop-Loss indicator:
✅Use the indicator in conjunction with other technical indicators or your own trading strategy to generate entry and exit signals.
✅Backtest your trading strategy before using it live to make sure that it is profitable.
✅Use the indicator to protect your profits by moving your stop-loss up as the price moves in your favor.
✅ Always follow risk management rules and manage your position sizing according to your risk appetite.
✅ Be aware of the overall trend direction. If the trend is up, you should be looking for bullish reversals or continuations. If the trend is down, you should be looking for bearish reversals or continuations.
This script essentially provides a visual representation of a trading strategy that automatically adjusts stop-loss levels based on market volatility (ATR). It also includes signals for entering long or short positions and visually highlights these signals on the chart.
📣📣Follow us for timely updates regarding future indicators and give it a like if you appreciate the work.📣📣

Trail Blaze - (Multi Function Trailing Stop Loss) - [mutantdog]Shorter version:
As the title states, this is a 'Trailing Stop' type indicator, albeit one with a whole bunch of additional functionality, making it far more versatile and customisable than a standard trailing stop.
The main set of features includes:
Three independent trailing types each with their own +/- multipliers:
- Standard % change
- ATR (aka Supertrend)
- IQR (inter-quartile range)
These can be used in isolation or summed together. A subsequent pair of direction specific multipliers are also included.
Two separate custom source inputs are available, both feature the standard options alongside a selection of 'weighted inputs' and the option to use another indicator (selected via 'AUX'):
- 'Centre' determines the value about which the trailing sum will be added to define the stop level.
- 'Trigger' determines the value used for crossing of stops, initiating trend changes and triggering alerts.
A selection of optional filters and moving averages are available for both.
Furthermore there are various useful visualisation options available, including the underlying bands that govern the stop levels. Preset alerts for trend reversals are also included.
This is not really an 'out-of-the-box' indicator. Depending upon the market and timeframe some adjustments will be necessary for it to function in a useful manner, these can be as simple or complex as the feature-set allows. Basic settings are easy to dial in however and the default state is intended as a good starting point. Alternatively with some experimentation, a plethora of unique and creative configurations are possible, making this a great tool for tweaking. Below is a more detailed overview followed by a bunch of simple example settings.
------------------------
Lengthy Version :
DESIGN & CONCEPT
Before we start breaking this down, a little background. This started off as an attempt to improve upon the ever-popular Supertrend indicator. Of course there are many excellent user created variants available utilising some interesting methods to overcome the drawbacks of the basic version. To that end, rather than copying the work of others, the direction here shifted towards a hybrid trailing stop loss with a bunch of additional user customisation options. At some point, a completely different project involving IQR got morphed into this one. After sitting through months of sideways chop (where this proved to be of limited use), at the time of publication the market has began to form some near term trend direction and it appears to be performing well in many different timeframes.
And so with that out of the way...
INPUTS
The standard Supertrend (and most other variants) includes a single source input, as default set to 'hl2' (candle mid-range). This is the centre around which the atr bands are added/subtracted to govern the stop levels. This is not however the value which is used to trigger the trend reversal, that is usually hard-coded to 'close'. For this version both source values are adjustable: labelled 'centre' and 'trigger' respectively.
Each has custom input selectors including the usual options, a selection of 'weighted inputs' and the option to use another indicator (selected from the Aux input). The 'weighted inputs' are those introduced in Weight Gain 4000, for more details please refer to that listing. These should be treated as experimental, however may prove useful in certain configurations. In this case 'hl-oc2' can be considered an estimate of the candle median and may be a good alternative to the default 'centre' setting of 'hl2', in contrast 'cc-ohlc4' can tend to favour the extremes in the trend direction so could be useful as a faster 'trigger' than the default 'close'.
To cap them off both come with a selection of moving average filters (SMA, EMA, WMA, RMA, HMA, VWMA and a simple VWEMA - note: not elastic) aswell as median and mid-range. 'Centre' can also be set to the output of 'trigger' post-filter which can be useful if working with fast/slow crosses as the basis.
DYNAMICS
This is the main section, comprised of three separate factors: 'TSL', 'ATR' and 'IQR'. The first two should be fairly obvious, 'TSL' (trailing stop loss) is simply a percentage of the 'centre' value while 'ATR' (average true range) is the standard RMA-based version as used in Supertrend, Volatility Stop etc.
The third factor is less common however: 'IQR' (inter-quartile range). In case you are unfamiliar the principle here is, for a given dataset, the greatest 25% and smallest 25% of samples are removed. The remainder is then treated as a set and the range is calculated by highest - lowest. This is a commonly used method in statistical analysis, by removing the extremes it is less prone to influence by outliers and gives a good representation of the main dispersion around the median. In practise i have found it can be a good alternative to ATR, translating better across multiple time-frames due to it representing a fraction of the total range rather than an average of per-candle range like ATR. Used in combination with the others it can also add a factor more representative of longer-term/higher-timeframe trend. By discarding outliers it also benefits from not being impacted by brief pumps/volatility, instead responding only to more sustained changes in trend, such as rallies and parabolic moves. In order to give an accurate result the IQR is calculated using a dataset of high, low and hlcc4 values for all bars within the lookback length. Once calculated this value is then halved which, strictly speaking, makes it a semi-interquartile range.
All three of these components can be used individually or summed together to create a hybrid dynamics factor. Furthermore each multiplier can be set to both positive and negative values allowing for some interesting and creative possibilities. An optional smoothing filter can be applied to the sum, this is a basic SWMA-4 which is can reduce the impact of sudden changes but does incur a noticeable lag. Finally, a basic limiter condition has been hard-coded here to prevent the sum total from ever going below zero.
Capping off this section is a pair of direction multipliers. These simply take the prior dynamics sum and allow for further multiplication applied only to one side (uptrend/lo-stop and downtrend/hi-stop). To see why this is useful consider that markets often behave differently in each direction, we've all seen prices steadily climb over several weeks and then abruptly dump in the process of a day or two, shorter time frames are no stranger to this either. A lack of downside liquidity, a panicked market, aggressive shorts. All these things contribute to significant differences in downward price action. This function allows for tighter stops in one direction compared to the other to reflect this imbalance.
VISUALISATIONS
With all of these options and possibilities, some visual aids are useful. Beneath the dynamics' section are several visual options including both sources post-filter and the actual 'bands' created by the dynamics. These are what govern the stop levels and seeing them in full can help to better understand what our various configurations actually do. We can even hide the stop levels altogether and just use the bands, making this a kind of expanded Keltner Channel. Here we can also find colour and opacity settings for everything we've discussed.
EXAMPLES
The obvious first example here is the standard %-change trailing stop loss which, from my experience, tends to be the best suited for lower time frames. Filtering should probably minimal here. In both charts here we use the default config for source inputs, the top is a standard bi-directional setup with 1.5% tsl while the bottom uses a 2.5% tsl with the histop multiplier reduced to 0 resulting in an uptrend only stoploss.
Shown here in grey is the standard Supertrend which uses 'hl2' as centre and 'close' as trigger, ATR(10) multiplied by 3. On top we have the default filtered source config with ATR(8) multiplied by 2 which gives a different yet functionally similar result, below is the same source config instead using IQR(12) multiplied by 2. Notice here the more 'stepped' response from IQR following the central rally, holding back for a while before closing in on price and ultimately initiating reversal much sooner. Unlike ATR, the length parameter for IQR is absolute and can more significantly affect its responsiveness.
Next we focus on the visualisation options, on top we have the default source config with ATR(8) multiplied by 2 and IQR(12) multiplied by 1. Here we have activated the switch to show 'bands', from this we can see the actual summed dynamics and how it influences the stop levels. Below that we have an altogether different config utilising the included filters which are now visible. In this example we have created a basic 8/21 EMA cross and set a 1% TSL, notice the brief fakeout in the middle which ordinarily might indicate a buy signal. Here the TSL functions as an additional requirement which in this case is not met and thus no buy signal is given.
Finally we have a couple of more 'experimental' examples. On top we have Lazybear's 'Variable Moving Average' in white which has been assigned via 'aux' as the centre with no additional filtering, the default config for trigger is used here and a basic TSL of 1.5% added. It's a simple example but it shows how this can be applied to other indicators. At the bottom we return to the default source config, combining a TSL of 8% with IQR(24) multiplied by -2. Note here the negative IQR with greater length which causes the stop to close in on price following significant deviations while otherwise remaining fairly wide. Combining positive and negative multiples of each factor can yield mixed results, some more useful than others depending upon suitable market conditions.
Since this has been quite lengthy, i shall leave it there. Suffice to say that there are plenty more ways to use this besides these examples. Please feel free to share any of your own ideas in the comments below. Enjoy.

Chande Volatility-Based Trailing Stops This indicator is developed from a description outlined in the Chande - Kroll book, "The New Technical Trader". It is designed to help control risk by plotting two lines that function as long and short trailing stops.
How does it work?
"These stops are derived from recent highest high or lowest low. They adjust based on volatility. However, to avoid giving up a sizable chunk of profit before the stop is hit, it is modified in such a way that the stop can only advance with price, not retreat. This will lock in a greater portion of potential profits..."
Settings:
The default settings are those described in the book. They are described as being best for intermediate term trades. Use the multiplier to tighten or loosen the stop. A smaller multiplier will result in tighter stops. It is recommended to adjust this value for your preferred timeframe. You can toggle the trailing stop lines on or off as well as cross over marker.
ATR Trailing Stop by tactical trade 22 Oct 2024Description:
The ATR Dual Trailing Stop indicator is a versatile and powerful tool designed to help traders visualize dynamic support and resistance levels based on the Average True Range (ATR). This indicator plots two separate ATR-based trailing stops with customizable settings, providing a comprehensive view of potential market reversals and trend strength.
Key features:
Two ATR Trailing Stops: The first stop uses customizable ATR settings (default: 10-period ATR with a 3x multiplier), while the second stop uses an alternate configuration (default: 21-period ATR with a 7x multiplier).
Multi-Timeframe ATR Calculation: Regardless of the chart's time frame, the ATR is calculated based on a user-selected time frame (e.g., daily), allowing for consistent stop-loss levels even in lower time frames like 5-minute or 15-minute charts.
Visual Cues: The indicator clearly plots two trailing stop lines in different colors, making it easy to track the market’s volatility-based support and resistance areas.
No Buy/Sell Signals: This is purely a trailing stop indicator with no embedded buy/sell signals, giving traders the flexibility to use it with their preferred entry/exit strategies.
This indicator is especially useful in highly volatile markets where precise trailing stop levels are essential for managing risk and maximizing profit potential. The dual ATR configuration helps traders adapt to changing market conditions by providing two levels of stop placement: a shorter-term and a longer-term trailing stop.

The Engulfing Liquidity Signal with Adjustable Trailing StopEngulfing Liquidity Signal with Adjustable Trailing Stop
This strategy is designed to enter long trades based on the Engulfing Liquidity Signal combined with a Trailing Stop. The strategy uses custom volume analysis and price action to detect potential market opportunities. The Trailing Stop is adjustable, allowing traders to customize the distance at which the stop will trail the price.
Key Features:
Engulfing Liquidity Signal: The strategy enters a trade when the market shows signs of strong liquidity and price action, typically when there is a strong reversal signal (bullish engulfing) accompanied by higher volume.
Trailing Stop: A dynamic exit strategy that locks in profits by trailing the stop level behind the highest price achieved since the trade entry. This prevents the position from being closed prematurely while still protecting profits if the market reverses.
Customizable Trailing Stop: Users can adjust the trailing stop percentage via the settings. This allows for greater flexibility in how closely the stop will trail the price.
No Fixed Take Profit: The strategy uses only the trailing stop, ensuring that profits are maximized based on price action without a fixed profit target.
How the Strategy Works:
Buy Signal (LongC):
The strategy triggers a buy signal when a bullish engulfing pattern occurs, and the liquidity conditions align (i.e., the volume is increasing and price action shows signs of a potential reversal).
The strategy enters a long position when the signal conditions are met.
Trailing Stop Logic:
Once the trade is initiated, a trailing stop is applied. The stop level follows the highest price achieved since entry, trailing the price based on a user-defined percentage.
The stop level adjusts upward as the price increases, locking in profits. If the price reverses and hits the trailing stop, the trade is closed.
The trailing stop is dynamic, meaning it moves only in the direction of profit, but it will not move lower once it has been set.
Sell Signal (ShortC):
The position will also be closed if a sell signal (ShortC) is generated. This ensures that the strategy exits the trade when a potential reversal is detected in the market.
No Fixed Take Profit:
The strategy does not use a fixed take profit level. Instead, the profit is managed entirely by the trailing stop, which ensures that positions remain open as long as the market is moving in favor of the trade, allowing the position to capture the maximum possible profit.
Settings:
Trailing Stop Percentage: The user can adjust the trailing stop distance by setting a percentage value between 10% and 100%. This controls how tightly or loosely the trailing stop will follow the price.
Benefits:
Maximized Profits: By using a trailing stop, the strategy aims to capture as much profit as possible without prematurely exiting trades.
Customizable: The adjustable trailing stop allows traders to tailor the strategy to their risk tolerance and market conditions.
Simple & Effective: The strategy is straightforward, relying on price action and volume signals, making it easy to understand and implement.
Ideal Use Case:
This strategy is suitable for traders who prefer to let their profits run and manage risk with a trailing stop. It is particularly useful in trending markets where the price continues to move in one direction for an extended period. By using a trailing stop, the strategy allows you to stay in the market and capture large moves while protecting profits.
This strategy provides an excellent combination of automated trade management with a Trailing Stop and Engulfing Liquidity Signal, making it a solid choice for traders seeking to automate their trades with customizable risk management.

PTS - Bollinger Bands with Trailing StopPTS - Bollinger Bands with Trailing Stop Strategy
Overview
The "PTS - Bollinger Bands with Trailing Stop" strategy is designed to capitalize on strong bullish market movements by combining the Bollinger Bands indicator with a dynamic trailing stop based on the Average True Range (ATR). This strategy aims to enter long positions during upward breakouts and protect profits through an adaptive exit mechanism.
Key Features
1. Bollinger Bands Indicator
Basis Moving Average Type: Choose from SMA, EMA, SMMA, WMA, or VWMA for the Bollinger Bands' basis line. Length: Adjustable period for calculating the moving average and standard deviation (default is 20). Standard Deviation Multiplier (StdDev): Determines the width of the bands (default is 2.0). Source: Select the price data used for calculations (default is the closing price).
2. Entry Conditions
The strategy enters a long position when the closing price crosses above the upper Bollinger Band , indicating strong upward momentum.
3. Exit Conditions
Trailing Stop Loss: Implemented using ATR to adjust dynamically with market volatility. ATR Length: Period for calculating ATR (default is 14). ATR Multiplier for Trailing Stop: Determines how closely the trailing stop follows the price (default is 2.0). Close Below Lower Bollinger Band: The strategy exits the long position if the closing price crosses below the lower Bollinger Band .
4. Risk Management
Commission and Slippage: Commission is set at 0.1%; slippage is set to 3. Position Sizing: Uses 100% of equity per trade (adjustable).
5. Date Range Filter
Specify the time period during which the strategy is active. Start Date: January 1, 2018. End Date: December 31, 2069.
Customizable Inputs
BB Length: Adjust the period for Bollinger Bands calculation. BB StdDev: Modify the standard deviation multiplier. Basis MA Type: Select the moving average type. Source: Choose the price data source. Offset: Shift the Bollinger Bands on the chart. ATR Length: Set the period for ATR calculation. ATR Multiplier for Trailing Stop: Adjust the trailing stop sensitivity.
Thought for 1m 7s
Description for the "PTS - Bollinger Bands with Trailing Stop" Strategy
PTS - Bollinger Bands with Trailing Stop Strategy
Overview
The "PTS - Bollinger Bands with Trailing Stop" strategy is designed to capitalize on strong bullish market movements by combining the Bollinger Bands indicator with a dynamic trailing stop based on the Average True Range (ATR). This strategy aims to enter long positions during upward breakouts and protect profits through an adaptive exit mechanism.
Key Features
1. Bollinger Bands Indicator
Basis Moving Average Type: Choose from SMA, EMA, SMMA, WMA, or VWMA for the Bollinger Bands' basis line. Length: Adjustable period for calculating the moving average and standard deviation (default is 20). Standard Deviation Multiplier (StdDev): Determines the width of the bands (default is 2.0). Source: Select the price data used for calculations (default is the closing price).
2. Entry Conditions
The strategy enters a long position when the closing price crosses above the upper Bollinger Band , indicating strong upward momentum.
3. Exit Conditions
Trailing Stop Loss: Implemented using ATR to adjust dynamically with market volatility. ATR Length: Period for calculating ATR (default is 14). ATR Multiplier for Trailing Stop: Determines how closely the trailing stop follows the price (default is 2.0). Close Below Lower Bollinger Band: The strategy exits the long position if the closing price crosses below the lower Bollinger Band .
4. Risk Management
Commission and Slippage: Commission is set at 0.1%; slippage is set to 3. Position Sizing: Uses 100% of equity per trade (adjustable).
5. Date Range Filter
Specify the time period during which the strategy is active. Start Date: January 1, 2018. End Date: December 31, 2069.
Customizable Inputs
BB Length: Adjust the period for Bollinger Bands calculation. BB StdDev: Modify the standard deviation multiplier. Basis MA Type: Select the moving average type. Source: Choose the price data source. Offset: Shift the Bollinger Bands on the chart. ATR Length: Set the period for ATR calculation. ATR Multiplier for Trailing Stop: Adjust the trailing stop sensitivity.
How the Strategy Works
1. Initialization
Calculates Bollinger Bands and ATR based on selected parameters.
2. Entry Logic
Opens a long position when the closing price exceeds the upper Bollinger Band.
3. Exit Logic
Uses a trailing stop loss based on ATR. Exits if the closing price drops below the lower Bollinger Band.
4. Date Filtering
Executes trades only within the specified date range.
Advantages
Adaptive Risk Management: Trailing stop adjusts to market volatility. Simplicity: Clear entry and exit signals. Customizable Parameters: Tailor the strategy to different assets or conditions.
Considerations
Aggressive Position Sizing: Using 100% equity per trade is high-risk. Market Conditions: Best in trending markets; may produce false signals in sideways markets. Backtesting: Always test on historical data before live trading.
Disclaimer
This strategy is intended for educational and informational purposes only. Trading involves significant risk, and past performance is not indicative of future results. Assess your financial situation and consult a financial advisor if necessary.
Usage Instructions
1. Apply the Strategy: Add it to your TradingView chart. 2. Configure Inputs: Adjust parameters to suit your style and asset. 3. Analyze Backtest Results: Use the Strategy Tester. 4. Optimize Parameters: Experiment with input values. 5. Risk Management: Evaluate position sizing and incorporate risk controls.
Final Notes
The "PTS - Bollinger Bands with Trailing Stop" strategy provides a framework to leverage momentum breakouts while managing risk through adaptive trailing stops. Customize and test thoroughly to align with your trading objectives.

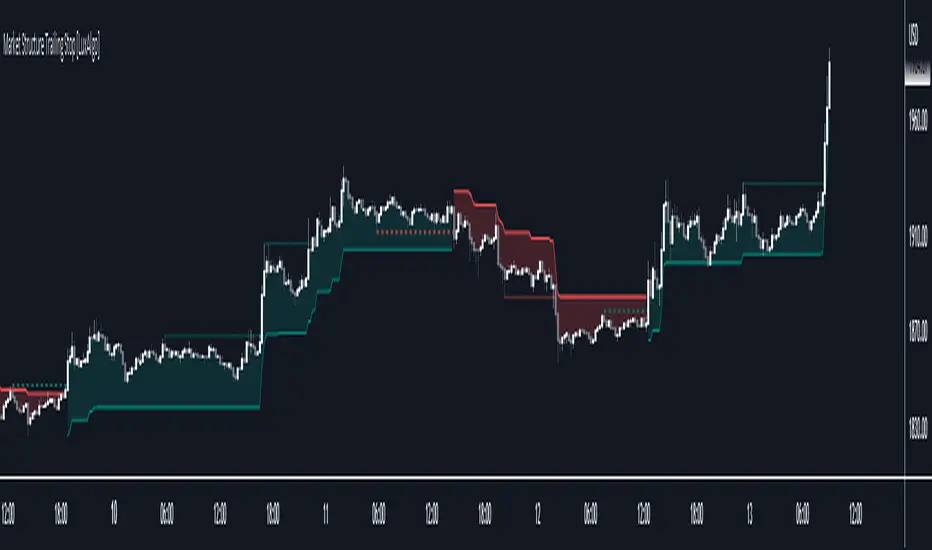
Market Structure Trailing Stop [LuxAlgo]This script returns trailing stops on the occurrence of market structure (CHoCH/BOS labeling). Trailing stops are adjusted based on trailing maximums/minimums with the option for users to be able to control how quickly a trailing stop can converge toward the price.
🔶 SETTINGS
Pivot Lookback: Pivot length used for the detection of swing points.
Increment Factor %: Controls how fast trailing stops converge toward the price, with lower values returning slower converging trailing stops.
Reset Stop On: Determines if trailing stops are reset on CHoCH structure or all (CHoCH + BOS).
Show Structure: Determines if market structure is displayed.
🔶 USAGE
Trailing stops allow traders to protect them against downside risk while also guaranteeing a potential profit in case the market goes in the expected direction of the trade.
Users making use of market structure as a primary entry condition can benefit from having trailing stops based on these to either provide an additional exit condition or to provide points of support/resistance with the price.
Trailing stops can avoid being hit more frequently by using a lower Increment Factor % setting.
Finally, users can reset the trailing stop when any market structure is detected (or only on CHoCHs). Allowing trailing stops to reset on the detection of any market structure allows the indicator to return trailing stops closer to the price. CHoCH labels are highlighted as dashed lines while BOS labels are highlighted as dotted lines.
🔶 DETAILS
When a new structure (or only CHoCH if specified by the user) is detected, trailing stops will initially be set based on the maximum/minimum made on the previous trend. This will also set the trailing maximum/minimum to the current price value.
If an uptrend is detected (most recent market structure is bullish) then the trailing stop will increase if the trailing maximum increase, the increment is calculated as:
trailing stop = trailing stop + Increment Factor % of (trailing maximum - previous trailing maximum)
If a downtrend is detected (most recent market structure is bearish) then the trailing stop will decrease if the trailing minimum decrease, the decrement is calculated as:
trailing stop = trailing stop + Increment Factor % of (trailing minimum - previous trailing minimum)
Adaptive ML Trailing Stop [BOSWaves]Adaptive ML Trailing Stop – Regime-Aware Risk Control with KAMA Adaptation and Pattern-Based Intelligence
Overview
Adaptive ML Trailing Stop is a regime-sensitive trailing stop and risk control system that adjusts stop placement dynamically as market behavior shifts, using efficiency-based smoothing and pattern-informed biasing.
Instead of operating with fixed ATR offsets or rigid trailing rules, stop distance, responsiveness, and directional treatment are continuously recalculated using market efficiency, volatility conditions, and historical pattern resemblance.
This creates a live trailing structure that responds immediately to regime change - contracting during orderly directional movement, relaxing during rotational conditions, and applying probabilistic refinement when pattern confidence is present.
Price is therefore assessed relative to adaptive, condition-aware trailing boundaries rather than static stop levels.
Conceptual Framework
Adaptive ML Trailing Stop is founded on the idea that effective risk control depends on regime context rather than price location alone.
Conventional trailing mechanisms apply constant volatility multipliers, which often results in trend suppression or delayed exits. This framework replaces static logic with adaptive behavior shaped by efficiency state and observed historical outcomes.
Three core principles guide the design:
Stop distance should adjust in proportion to market efficiency.
Smoothing behavior must respond to regime changes.
Trailing logic benefits from probabilistic context instead of fixed rules.
This shifts trailing stops from rigid exit tools into adaptive, regime-responsive risk boundaries.
Theoretical Foundation
The indicator combines adaptive averaging techniques, volatility-based distance modeling, and similarity-weighted pattern analysis.
Kaufman’s Adaptive Moving Average (KAMA) is used to quantify directional efficiency, allowing smoothing intensity and stop behavior to scale with trend quality. Average True Range (ATR) defines the volatility reference, while a K-Nearest Neighbors (KNN) process evaluates historical price patterns to introduce directional weighting when appropriate.
Three internal systems operate in tandem:
KAMA Efficiency Engine : Evaluates directional efficiency to distinguish structured trends from range conditions and modulate smoothing and stop behavior.
Adaptive ATR Stop Engine : Expands or contracts ATR-derived stop distance based on efficiency, tightening during strong trends and widening in low-efficiency environments.
KNN Pattern Influence Layer : Applies distance-weighted historical pattern outcomes to subtly influence stop placement on both sides.
This design allows stop behavior to evolve with market context rather than reacting mechanically to price changes.
How It Works
Adaptive ML Trailing Stop evaluates price through a sequence of adaptive processes:
Efficiency-Based Regime Identification : KAMA efficiency determines whether conditions favor trend continuation or rotational movement, influencing stop sensitivity.
Volatility-Responsive Scaling : ATR-based stop distance adjusts automatically as efficiency rises or falls.
Pattern-Weighted Adjustment : KNN compares recent price sequences to historical analogs, applying confidence-based bias to stop positioning.
Adaptive Stop Smoothing : Long and short stop levels are smoothed using KAMA logic to maintain structural stability while remaining responsive.
Directional Trailing Enforcement : Stops advance only in the direction of the prevailing regime, preserving invalidation structure.
Gradient Distance Visualization : Gradient fills reflect the relative distance between price and the active stop.
Controlled Interaction Markers : Diamond markers highlight meaningful stop interactions, filtered through cooldown logic to reduce clustering.
Together, these elements form a continuously adapting trailing stop system rather than a fixed exit mechanism.
Interpretation
Adaptive ML Trailing Stop should be interpreted as a dynamic risk envelope:
Long Stop (Green) : Acts as the downside invalidation level during bullish regimes, tightening as efficiency improves.
Short Stop (Red) : Serves as the upside invalidation level during bearish regimes, adjusting width based on efficiency and volatility.
Trend State Changes : Regime flips occur only after confirmed stop breaches, filtering temporary price spikes.
Gradient Depth : Deeper gradient penetration indicates increased extension from the stop rather than imminent reversal.
Pattern Influence : KNN weighting affects stop behavior only when historical agreement is strong and remains neutral otherwise.
Distance, efficiency, and context outweigh isolated price interactions.
Signal Logic & Visual Cues
Adaptive ML Trailing Stop presents two primary visual signals:
Trend Transition Circles : Display when price crosses the opposing trailing stop, confirming a regime change rather than anticipating one.
Stop Interaction Diamonds : Indicate controlled contact with the active stop, subject to cooldown filtering to avoid excessive signals.
Alert generation is limited to confirmed trend transitions to maintain clarity.
Strategy Integration
Adaptive ML Trailing Stop fits within trend-following and risk-managed trading approaches:
Dynamic Risk Framing : Use adaptive stops as evolving invalidation levels instead of fixed exits.
Directional Alignment : Base execution on confirmed regime state rather than speculative reversals.
Efficiency-Based Tolerance : Allow greater price fluctuation during inefficient movement while enforcing tighter control during clean trends.
Pattern-Guided Refinement : Let KNN influence adjust sensitivity without overriding core structure.
Multi-Timeframe Context : Apply higher-timeframe efficiency states to inform lower-timeframe stop responsiveness.
Technical Implementation Details
Core Engine : KAMA-based efficiency measurement with adaptive smoothing
Volatility Model : ATR-derived stop distance scaled by regime
Machine Learning Layer : Distance-weighted KNN with confidence modulation
Visualization : Directional trailing stops with layered gradient fills
Signal Logic : Regime-based transitions and controlled interaction markers
Performance Profile : Optimized for real-time chart execution
Optimal Application Parameters
Timeframe Guidance:
1 - 5 min : Tight adaptive trailing for short-term momentum control
15 - 60 min : Structured intraday trend supervision
4H - Daily : Higher-timeframe regime monitoring
Suggested Baseline Configuration:
KAMA Length : 20
Fast/Slow Periods : 15 / 50
ATR Period : 21
Base ATR Multiplier : 2.5
Adaptive Strength : 1.0
KNN Neighbors : 7
KNN Influence : 0.2
These suggested parameters should be used as a baseline; their effectiveness depends on the asset volatility, liquidity, and preferred entry frequency, so fine-tuning is expected for optimal performance.
Parameter Calibration Notes
Use the following adjustments to refine behavior without altering the core logic:
Excessive chop or overreaction : Increase KAMA Length, Slow Period, and ATR Period to reinforce regime filtering.
Stops feel overly permissive : Reduce the Base ATR Multiplier to tighten invalidation boundaries.
Frequent false regime shifts : Increase KNN Neighbors to demand stronger historical agreement.
Delayed adaptation : Decrease KAMA Length and Fast Period to improve responsiveness during regime change.
Adjustments should be incremental and evaluated over multiple market cycles rather than isolated sessions.
Performance Characteristics
High Effectiveness:
Markets exhibiting sustained directional efficiency
Instruments with recurring structural behavior
Trend-oriented, risk-managed strategies
Reduced Effectiveness:
Highly erratic or event-driven price action
Illiquid markets with unreliable volatility readings
Integration Guidelines
Confluence : Combine with BOSWaves structure or trend indicators
Discipline : Follow adaptive stop behavior rather than forcing exits
Risk Framing : Treat stops as adaptive boundaries, not forecasts
Regime Awareness : Always interpret stop behavior within efficiency context
Disclaimer
Adaptive ML Trailing Stop is a professional-grade adaptive risk and regime management tool. It does not forecast price movement and does not guarantee profitability. Results depend on market conditions, parameter selection, and disciplined execution. BOSWaves recommends deploying this indicator within a broader analytical framework that incorporates structure, volatility, and contextual risk management.

Market Structure Trailing Stop MTF [Inspired by LuxAlgo]# Market Structure Trailing Stop MTF
**OPEN-SOURCE SCRIPT**
*208k+ views on original · Modified for MTF Support*
This indicator is a direct adaptation of the renowned **Market Structure Trailing Stop** by **LuxAlgo** (original script: [Market Structure Trailing Stop ]()). The core logic remains untouched, providing dynamic trailing stops based on market structure breaks (CHoCH/BOS). The **only modification** is the addition of **Multi-Timeframe (MTF) support**, allowing users to apply the trailing stops and structures from **higher timeframes (HTF)** directly on their current chart. This enhances usability for traders analyzing cross-timeframe confluence without switching charts.
**Special thanks to LuxAlgo** for releasing this powerful open-source tool under CC BY-NC-SA 4.0. Your contributions to the TradingView community have inspired countless traders—grateful for the solid foundation!
## 🔶 How the Script Works: A Deep Dive
At its heart, this indicator detects **market structure shifts** (bullish or bearish breaks of swing highs/lows) and uses them to generate **adaptive trailing stops**. These stops trail the price while protecting profits and acting as dynamic support/resistance levels. The MTF enhancement pulls this logic from user-specified higher timeframes, overlaying HTF structures and stops on the lower timeframe chart for seamless multi-timeframe analysis.
### Core Logic (Unchanged from LuxAlgo's Original)
1. **Pivot Detection**:
- Uses `ta.pivothigh()` and `ta.pivotlow()` with a user-defined lookback (`length`) to identify swing highs (PH) and lows (PL).
- Coordinates (price `y` and bar index/time `x`) are stored in persistent variables (`var`) for tracking recent pivots.
2. **Market Structure Detection**:
- **Bullish Structure (BOS/CHoCH)**: Triggers when `close > recent PH` (break above swing high).
- If `resetOn = 'CHoCH'`, resets only on major shifts (Change of Character); otherwise, on all breaks.
- Sets trend state `os = 1` (bullish) and highlights the break with a horizontal line (dashed for CHoCH, dotted for BOS).
- Initializes trailing stop at the local minimum (lowest low since the pivot) using a backward loop: `btm = math.min(low , btm)`.
- **Bearish Structure**: Triggers when `close < recent PL`, mirroring the bullish logic (`os = -1`, local maximum for stop).
- Structure state `ms` tracks the break type (1 for bull, -1 for bear, 0 neutral), resetting based on user settings.
3. **Trailing Stop Calculation**:
- Tracks **trailing max/min**:
- On new bull structure: Reset `max = close`.
- On new bear: Reset `min = close`.
- Otherwise: `max = math.max(close, max)` / `min = math.min(close, min)`.
- **Stop Adjustment** (the "trailing" magic):
- On fresh structure: `ts = btm` (bull) or `top` (bear).
- In ongoing trend: Increment/decrement by a percentage of the max/min change:
- Bull: `ts += (max - max ) * (incr / 100)`
- Bear: `ts += (min - min ) * (incr / 100)`
- This creates a **ratcheting effect**: Stops move favorably with the trend but never against it, converging toward price at a controlled rate.
- **Visuals**:
- Plots `ts` line colored by trend (teal for bull, red for bear).
- Fills area between `close` and `ts` (orange on retracements).
- Draws structure lines from pivot to break point.
4. **Edge Cases**:
- Variables like `ph_cross`/`pl_cross` prevent multiple triggers on the same pivot.
- Neutral state (`ms = 0`) preserves prior `max/min` until a new structure.
### MTF Enhancement (Our Addition)
- **request.security() Integration**:
- Wraps the entire core function `f()` in a security call for each timeframe (`tf1`, `tf2`).
- Returns HTF values (e.g., `ts1`, `os1`, structure times/prices) to the chart's context.
- Uses `lookahead=barmerge.lookahead_off` for accurate historical repainting-free data.
- Structures are drawn using `xloc.bar_time` to align HTF lines precisely on the LTF chart.
- **Multi-Output Handling**:
- Separate plots/fills/lines for each TF (e.g., `plot_ts1`, `plot_ts2`).
- Colors and toggles per TF to distinguish HTF1 (e.g., teal/red) from HTF2 (e.g., blue/maroon).
- **Benefits**: Spot HTF bias on LTF entries, e.g., enter longs only if both TF1 (1H) and TF2 (4H) show bullish `os=1`.
This keeps the script lightweight—**no repainting, max 500 lines**, and fully compatible with LuxAlgo's original behavior when TFs are set to the chart's timeframe.
## 🔶 SETTINGS
### Core Parameters
- **Pivot Lookback** (`length = 14`): Bars left/right for pivot detection. Higher = smoother structures, fewer signals; lower = more noise.
- **Increment Factor %** (`incr = 100`): Speed of stop convergence (0-∞). 100% = full ratchet (mirrors max/min exactly); <100% = slower trail, reduces whipsaws.
- **Reset Stop On** (`'CHoCH'`): `'CHoCH'` = Reset only on major reversals (dashed lines); `'All'` = Reset on every BOS/CHoCH (tighter stops).
### MTF Support
- **Timeframe 1** (`tf1 = ""`): HTF for first set (e.g., "1H"). Empty = current chart.
- **Timeframe 2** (`tf2 = ""`): Second HTF (e.g., "4H"). Enables dual confluence.
### Display Toggles
- **Show Structures** (`true`): Draws horizontal lines for breaks (per TF colors).
- **Show Trailing Stop TF1/TF2** (`true`): Plots the stop line.
- **Show Fill TF1/TF2** (`true`): Area fill between close and stop.
### Candle Coloring (Optional)
- **Color Candles** (`false`): Enables custom `plotcandle` for body/wick/border.
- **Candle Color Based On TF** (`"None"`): `"TF1"`, `"TF2"`, or none. Colors bull trend green, bear red.
- **Candle Colors**: Separate inputs for bull/bear body, wick, border (e.g., solid green body, transparent wick).
### Alerts
- **Enable MS Break Alerts** (`false`): Notifies on structure breaks (bull/bear per TF) **only on bar close** (`barstate.isconfirmed` + `alert.freq_once_per_bar_close`).
- **Enable Stop Hit Alerts** (`false`): Triggers on stop breaches (long/short per TF), using `ta.crossunder/crossover`.
### Colors
- **TF1 Colors**: Bullish (teal), Bearish (red), Retracement (orange).
- **TF2 Colors**: Bullish (blue), Bearish (maroon), Retracement (orange).
- **Area Transparency** (`80`): Fill opacity (0-100).
## 🔶 USAGE
Trailing stops shine in **trend-following strategies**:
- **Entries**: Use structure breaks as signals (e.g., long on bullish BOS from HTF1).
- **Exits**: Trail stops for profit-locking; alert on hits for automation.
- **Confluence**: Overlay HTF1 (e.g., 1H) for bias, HTF2 (e.g., Daily) for major levels—enter LTF only on alignment.
- **Risk Management**: Lower `incr` avoids early stops in chop; reset on `'All'` for aggressive trailing.
! (i.imgur.com)
*HTF1 shows bullish structure (teal line), trailing stop ratchets up—long entry confirmed on LTF pullback.*
! (i.imgur.com)
*TF1 (blue) bearish, TF2 (red) neutral—avoid shorts until alignment.*
! (i.imgur.com)
*Colored based on TF1 trend: Green bodies on bull `os=1`.*
Pro Tip: Test on demo—pair with LuxAlgo's other tools like Smart Money Concepts for full structure ecosystem.
## 🔶 DETAILS: Mathematical Breakdown
On bullish break:
- Local min: `btm = ta.lowest(n - ph_x)` (optimized loop equivalent).
- Stop init: `ts = btm`.
- Update: `Δmax = max - max `, `ts_new = ts + Δmax * (incr/100)`.
Bearish mirrors with `Δmin` (negative, so decrements `ts`).
In MTF: HTF `time` aligns lines via `line.new(htf_time, level, current_time, level, xloc.bar_time)`.
No logs/math libs needed—pure Pine v5 efficiency.
## Disclaimer
This is for educational purposes. Not financial advice. Backtest thoroughly. Original by LuxAlgo—modify at your risk. See TradingView's (www.tradingview.com). Licensed under CC BY-NC-SA 4.0 (attribution to LuxAlgo required).

3 EMA + RSI with Trail Stop [Free990] (LOW TF)This trading strategy combines three Exponential Moving Averages (EMAs) to identify trend direction, uses RSI to signal exit conditions, and applies both a fixed percentage stop-loss and a trailing stop for risk management. It aims to capture momentum when the faster EMAs cross the slower EMA, then uses RSI thresholds, time-based exits, and stops to close trades.
Short Explanation of the Logic
Trend Detection: When the 10 EMA crosses above the 20 EMA and both are above the 100 EMA (and the current price bar closes higher), it triggers a long entry signal. The reverse happens for a short (the 10 EMA crosses below the 20 EMA and both are below the 100 EMA).
RSI Exit: RSI crossing above a set threshold closes long trades; crossing below another threshold closes short trades.
Time-Based Exit: If a trade is in profit after a set number of bars, the strategy closes it.
Stop-Loss & Trailing Stop: A fixed stop-loss based on a percentage from the entry price guards against large drawdowns. A trailing stop dynamically tightens as the trade moves in favor, locking in potential gains.
Detailed Explanation of the Strategy Logic
Exponential Moving Average (EMA) Setup
Short EMA (out_a, length=10)
Medium EMA (out_b, length=20)
Long EMA (out_c, length=100)
The code calculates three separate EMAs to gauge short-term, medium-term, and longer-term trend behavior. By comparing their relative positions, the strategy infers whether the market is bullish (EMAs stacked positively) or bearish (EMAs stacked negatively).
Entry Conditions
Long Entry (entryLong): Occurs when:
The short EMA (10) crosses above the medium EMA (20).
Both EMAs (short and medium) are above the long EMA (100).
The current bar closes higher than it opened (close > open).
This suggests that momentum is shifting to the upside (short-term EMAs crossing up and price action turning bullish). If there’s an existing short position, it’s closed first before opening a new long.
Short Entry (entryShort): Occurs when:
The short EMA (10) crosses below the medium EMA (20).
Both EMAs (short and medium) are below the long EMA (100).
The current bar closes lower than it opened (close < open).
This indicates a potential shift to the downside. If there’s an existing long position, that gets closed first before opening a new short.
Exit Signals
RSI-Based Exits:
For long trades: When RSI exceeds a specified threshold (e.g., 70 by default), it triggers a long exit. RSI > short_rsi generally means overbought conditions, so the strategy exits to lock in profits or avoid a pullback.
For short trades: When RSI dips below a specified threshold (e.g., 30 by default), it triggers a short exit. RSI < long_rsi indicates oversold conditions, so the strategy closes the short to avoid a bounce.
Time-Based Exit:
If the trade has been open for xBars bars (configurable, e.g., 24 bars) and the trade is in profit (current price above entry for a long, or current price below entry for a short), the strategy closes the position. This helps lock in gains if the move takes too long or momentum stalls.
Stop-Loss Management
Fixed Stop-Loss (% Based): Each trade has a fixed stop-loss calculated as a percentage from the average entry price.
For long positions, the stop-loss is set below the entry price by a user-defined percentage (fixStopLossPerc).
For short positions, the stop-loss is set above the entry price by the same percentage.
This mechanism prevents catastrophic losses if the market moves strongly against the position.
Trailing Stop:
The strategy also sets a trail stop using trail_points (the distance in price points) and trail_offset (how quickly the stop “catches up” to price).
As the market moves in favor of the trade, the trailing stop gradually tightens, allowing profits to run while still capping potential drawdowns if the price reverses.
Order Execution Flow
When the conditions for a new position (long or short) are triggered, the strategy first checks if there’s an opposite position open. If there is, it closes that position before opening the new one (prevents going “both long and short” simultaneously).
RSI-based and time-based exits are checked on each bar. If triggered, the position is closed.
If the position remains open, the fixed stop-loss and trailing stop remain in effect until the position is exited.
Why This Combination Works
Multiple EMA Cross: Combining 10, 20, and 100 EMAs balances short-term momentum detection with a longer-term trend filter. This reduces false signals that can occur if you only look at a single crossover without considering the broader trend.
RSI Exits: RSI provides a momentum oscillator view—helpful for detecting overbought/oversold conditions, acting as an extra confirmation to exit.
Time-Based Exit: Prevents “lingering trades.” If the position is in profit but failing to advance further, it takes profit rather than risking a trend reversal.
Fixed & Trailing Stop-Loss: The fixed stop-loss is your safety net to cap worst-case losses. The trailing stop allows the strategy to lock in gains by following the trade as it moves favorably, thus maximizing profit potential while keeping risk in check.
Overall, this approach tries to capture momentum from EMA crossovers, protect profits with trailing stops, and limit risk through both a fixed percentage stop-loss and exit signals from RSI/time-based logic.

Adaptive ATR Trailing Stops█ Introduction
This script is based on the average true range (ATR) and has been improved with the HHV or LLV. The script supports the trader to have his stoploss trailed. In this case, the stoploss is dynamic and can be adjusted with each candleclose.
█ What Does This Indicator Do?
The ATR SL Trailing Indicator helps you dynamically adjust your stop-loss levels based on market movements. It uses market volatility to calculate trailing stop-loss levels, ensuring you can secure profits or minimize losses. The indicator creates two lines:
A green/red line for long positions (when you’re betting on prices going up).
A green/red line for short positions (when you’re betting on prices going down).
█ Key Concepts: How Does the Indicator Work?
The Average True Range (ATR) measures market volatility, showing how much the price moves over a specific period.
A high ATR indicates a volatile market (large price swings), while a low ATR indicates a quiet market (smaller price changes).
Why is ATR important? ATR helps dynamically adjust the distance between your stop-loss and the current price. In volatile markets, the stop-loss is placed further away to avoid being triggered by short-term fluctuations. In quieter markets, the stop-loss is set closer to the price.
The HHV is the highest price over a specific period. For long positions, the indicator uses the highest price minus an ATR-based value to determine the stop-loss level.
Why is HHV important? HHV ensures the stop-loss for long positions only moves up when the price reaches new highs. Once the price starts falling, the stop-loss remains unchanged to lock in profits or minimize losses.
The LLV is the lowest price over a specific period. For short positions, the indicator uses the lowest price plus an ATR-based value to determine the stop-loss level.
Why is LLV important? LLV ensures the stop-loss for short positions only moves down when the price reaches new lows. Once the price starts rising, the stop-loss remains unchanged to lock in profits or minimize losses.
█ How Does the Indicator Work?
For Long Positions:
The indicator sets the stop-loss below the current price, based on:
Market volatility (ATR).
The highest price over a specific period (HHV).
The line turns green when the current price is above the stop-loss.
The line turns red when the price drops below the stop-loss, signaling you may need to exit the trade.
For Short Positions:
The indicator sets the stop-loss above the current price, based on:
*Market volatility (ATR).
*The lowest price over a specific period (LLV).
*The line turns green when the current price is below the stop-loss.
*The line turns red when the price moves above the stop-loss, signaling you may need to exit the trade.
█ Advantages of the ATR SL Trailing Indicator
*Dynamic and adaptive: Automatically adjusts stop-loss levels based on market volatility.
*Visual clarity: Green and red lines clearly indicate whether your position is safe or at risk.
*Effective risk management: Helps you lock in profits and minimize losses without the need for constant manual adjustments.
█ When Should You Use This Indicator?
*If you practice trend-based trading and want your stop-losses to automatically adapt to market movements.
*In volatile markets, to avoid being stopped out by short-term fluctuations.
*When you want to implement efficient risk management without manually adjusting your positions.
█ Inputs
The user can set the indicator for both longs and shorts. This is particularly important because the calculation is different. The HHV is used for longs and the LLV for shorts. The user can therefore set the period/length for the ATR on the one hand and the HHV/LLV on the other. He also has a multiplier, which can also be customized. The multiplier multiplies the price change of each individual candle.
█ Color Change
If the SL is trailed and the price breaks a line, the color changes. In this case, it would have executed the SL on an open trade.
