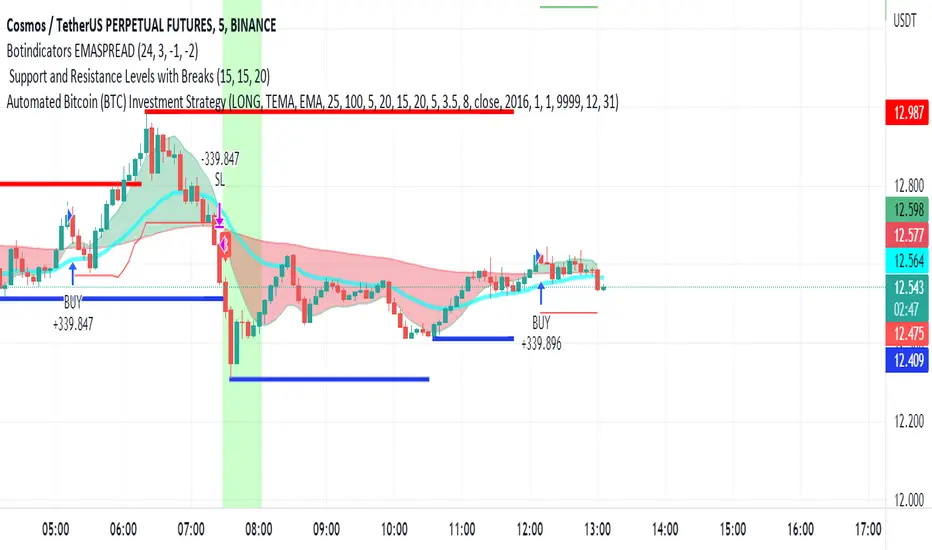
BTC Good SignalThis strategy uses the intersection between the triple exponential moving average and the least square moving average. We also control for the profit that you will gain during the upward trend by implementing the trailing stop based on the ATR indicator. This is the strategy for the spot market only and can be primarily used for long-term investors.
在脚本中搜索"Trailing stop"
Stock Tech Bot One ViewTechnical indicators are not limited. Hence, here is another indicator with the combination of OBV, RSI, and MACD along with support, and resistance that follows the price while honoring the moving average of 200, 90 & 50.
The default lookback period of this indicator is 21 though it is changeable as per the user's desire.
The highest high and lowest low for the last 21 days lookback period proven to be the perfect Support & Resistance as the price of particular stock values are decided by market psychology. The support and resistance lines are very important to understand the market psychology which is very well proven with price action patterns and the lines are drawn based on,
Lower Extreme = 0.1 (Changeable)
Maximum Range = 21 days highest high - 21 days lowest low.
Support Line = 21 days lowest low + (Maximum Range * Lower Extreme)
Resistance Line = 21 days highest high - (Maximum Range * Lower Extreme)
RSI - Relative strength indicator is very famous to find the market momentum within the range of 0 - 100. Though the lookback period is changeable, the 14 days lookback period is the perfect match as the momentum of market movement for the last 3 weeks will always assist to identify the market regime. Here the momentum is just to highlight the indication (green up arrow under the candle for long and red down arrow above the candle for short) of market movement though it is not very important to consider if the price of the stock respect the support & resistance lines along with volume indicator (* = violet color).
OBV - Momentum:
The on-balance volume is always going indicator on any kind of tickers, which helps to identify the buying interest. Now, applying momentum on OBV with the positive movement for at least two consecutive days gives perfect confirmation for entry. A combination of the price along with this momentum(OBV) in the chart will help us to know the whipsaw in the price.
The Symbol "*" on top of each bar shows the market interest in that particular stock. If your ticker is fundamentally strong then you can see this "*" even when the market falls.
MACD:
One of the favorites and simple indicators widely used, where the thump of the rule is not to change the length even if it is allowed. It's OK to believe blindly in certain indicator and consider it while trading. That's why the indicator changes the bar color by following the MACD histogram.
Volume:
It may be the OBV works based on the open price and close price along with volume movement, it is wise to have the volume that is plotted along with price movement that should help you to decide whether the market is greedy or fearful.
The symbol "-" on top of each bar tells you a lot and don't ignore it.
Moving Average:
Moving average is a very good trend indicator as everyone considers seeing along with the price in the chart which is not omitted while we gauge the price movement alone with volume in this indicator. The 200, 90 & 50 MA's are everyone's favorite, and the same is plotted on the chart.
As explained above, the combination of all four indicators with price movement will give us very good confidence to take entry.
Candlestick Pattern:
You should admire the techniques of the candlestick pattern as you navigate the chart from right to left. Though there are a lot of patterns that exist, it is easy to enable and disable to view the signal as the label.
Further, last but not least, the exit always depends on individual conviction and how often the individual watch the price movement, if your conviction is strong then follow the down arrow red indication. If not, then exit with a trailing stop that indicates the bar with orange color.
Happy investing
Note: It is just a combination of multiple indicators and patterns to get one holistic view. So, the credit goes to all wise developers who publically published.

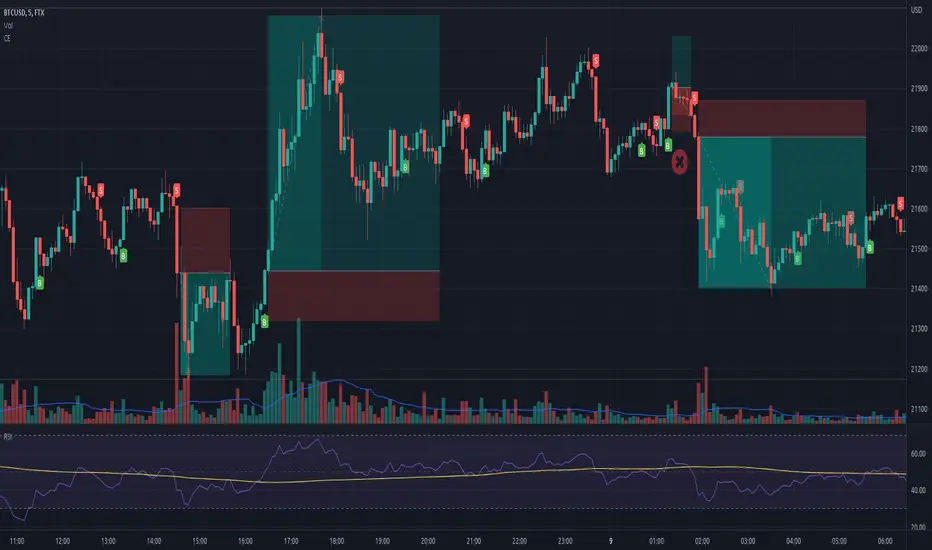
Chandelier Exit - Heikin AshiThis is a redesign of the Chandelier Exit indicator. It removes stupid transitions between Chandelier Exit' states and highlights initial points for both lines.
This indicator was originally developed by Charles Le Beau and popularized by Dr . Alexander Elder in his book "Come Into My Trading Room: A Complete Guide to Trading" (2002).
In short, this is a trailing stop-loss based on the Average True Range (ATR).
If "Heikin Ashi for calculation" is checked, then ATR and buy/sell signals are calculated based on heikin ashi candles.
You don't need to change bar style to heikin ashi.
Thanks to everget for the initial version.
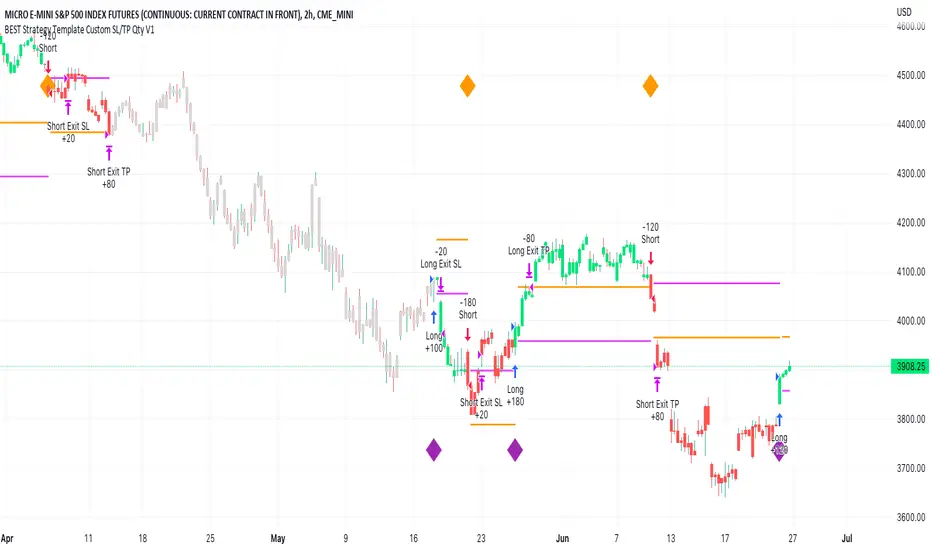
BEST Strategy Template w/ Custom SL/TP Size - EducationalHello traders
I'm getting this question at least once per week: "how to define a custom exit quantity for my stop loss and a different one for my take profit"
Instead of answering every day the same question in my DMs, I've decided to publish an educational strategy template script using this
Features
- Select to use or not the SL and/or TP
- Define how many pips/USD the SL/TP should be set at from the entry
- Define what quantity percentage you want to close at SL and/or at TP (lines 301 to 320 in the code)
- Classical custom trailing stop where the SL is moved to breakeven once the TP is hit
- Get real-time backtesting stats based on the options you've selected
Update
You might not know it yet but from last week (or maybe the week before), the qty/qty_percent from the strategy.exit function refers now to the initial position size (and not the remaining position size like before)
For example:
strategy.exit("EX1", qty_percent = 50, stop = constant)
strategy.exit("EX2", qty_percent = 20, stop = constant)
What happened before
After "EX1" reaches SL levels, "EX2" exits 20% from the % of the remaining position size.
If the initial position size = 100 contracts
EX1 exits 50 contracts
EX2 exits 20% of 50 contracts = 10 contracts
What's happening now
After "EX1" reaches SL levels, "EX2" exits 20% from the % of the original position size.
If the initial position size = 100 contracts
EX1 exits 50 contracts
EX2 exits 20 (20% of 100 contracts) contracts
I think this is an improvement and I really enjoy this new behavior.
See you in a few days with another post :)
ALL THE BEST
Dave
Customizable OCC Non Repainting Scalper Bot v7.0bThis strategy is intended to be used on an automated trading platform and should be run on a one minute chart for fastest confirmations and signal relay to crypto automation platform. The strategy has been modded to only go long at this time to focus on profitability for one direction. The open long and close long text fields allow you to use your own webhook message for this purpose.
I have spent quite a bit of time and I figured I would put it out to the community to share the work and also get some feedback.
Ok, so let me say that I have done absolutely everything I can to make the strategy not repaint while still maintaining it's profitability. It has been a challenge so I am publishing this to the community to help test this.
What I have observed: the strategy will not repaint in real time. That is, if you have the chart open and keep it open, the signals are the same as the ones that are sent out by the strategy. In certain cases, when I reload the chart- the signals might be off from what was sent. In some ways, that is repainting, but it is repainting based on losing the real time data and recalculating from a different set of bars- since I am running it on a one minute chart then the start becomes different when you refresh.
To address repainting while keeping the strategy calculating as quickly as possibly I have altered the logic in the following ways:
I have made an assumption which might not work for everyone- at the first tick of the next bar, you can almost safefly assume in crypto that if you are looking at the previous bar for information, the open of the current bar was the close of the previous bar. This for the most part holds true in crypto with good liquidity. If you are trading a pair that jumps around due to low volume- this might not be the strategy to use. I might publish a different version with a different logic.
I have altered the security repaint to use isbarconfirmed, so at the very end of the bar (as soon as the bar is confirmed), we recalculate to the higher time frames. So as soon as the data is available, it is at that point that we can then safely calculate higher time frames. This is unique and experimental, but seems to do well at creating good signals for entry.
I have employed my own intervals by utilizing the resolution as an integer (used by the previous authors)- but in this case, I use the interval to take a snapshot of the higher time frame. With open close cross, the different moving averages can cause the repainting as they change to show the exact point of the cross. The interval feature I created minimizes this by utilizing the previous bar info until the interval is closed and then we recalculate the variants. You can use the interval offset feature to denote which minute is the one that starts and ends the interval. So for instance, Trading View uses minue 1 and minute 31 for 30 minute intervals. If you offset your 30 minute interval would start on minute 16 and do its calculations based on the last 30 minutes,
As with most of my scripts, I have started using filters and a "show data" feature that will give you the ability to see the values of indicators that you cannot plot in the overlay. This allows you to figure out how to filter losing trades or market conditions.
I have also added a trailing stop and created a fixed stop loss as seems to perform better than the original occ strategy. The original one seemed to repaint enough that it would close too quickly and not give the posiition enough time to become profitable. In certain cases where there was a large move, it would perform well, but for the most part the trades would not close profitably even though the backtest said that it did - probably due to the delay in execution and pinescript not having a confirmation on what the actual position price was.
This is still in beta mode, so please forward test first and use at your own risk.
If you spot repaint issues, please send me a message and try to explain the situation.

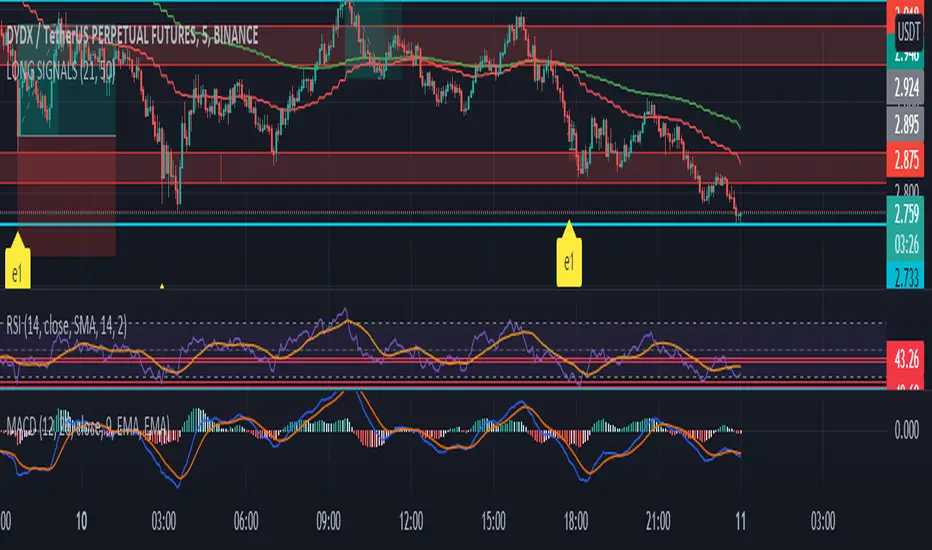
Cipher B divergencies for Crypto (Finandy support)Hello Traders!
In times of high volatility, it is important to follow a market-neutral strategy to protect your hard-earned assets. The simple script employs common buy/sell and/or divergencies signals from the VuManChu Cipher B indicator with fixed stop losses and takes profits. The signals are filtered by a local trend of a coin of interest and the global trend of Bitcoin. These trends-filtered signals demonstrated better performance on most of the back- and forward- tests for USDT cryptocurrency futures. The strategy is based on my real experience, it's a diamond I want to share with you.
In terms of visualization if the background is red and the price is below the yellow line then only a short position can be opened. Conversely, if the price is above the yellow line AND the background is green only a long position can be opened.
Inputs from VuManChu you can find on the top. Frankly, I do not know how they can help you to improve the performance of the strategy. My inputs of the script you can find in "Trend Settings" and "TP/SL Settings" at the bottom.
The checkbox "Only divergencies" lets to broadcast only more reliable buy/sell signals for a cost of rare deals.
The checkbox "Cancel all positions if price crosses local sma?" makes additional trailing stop loss. Usually, this function increases the win rate by "smoothing" the risk/reward ratio, as a usual stop loss does.
You can tune SL/TP based on backtesting.
To connect the script to Finandy just edit "name" and "secret" to connect your webhook (see the bottom of the script).
The rule of thumb for the strategy is "only divergencies" - ON, high reward/risk (TP/SL) ratio, 5 min timeframe on chart help with performance.
Finally, I am looking forward to feedback from you. If you have some cool features for my script in your mind, do not hesitate to leave them in the comments.
Good luck!

Parabolic SAR with the ADX overlayThe following indicator and chart pattern is based on a twist from Welles Wilder's parabolic stop and reverse . This is a trend following system which is essentially a dynamic trailing stop loss for longs and shorts. The system is often criticized for it's poor performance in choppy rangebound markets so people often combine it with other signals that attempt to identify a "trend" the ADX is a popular indicator with three indicators, the DI+ "Positive Directional Indicator" the DI- "Negative Directional Indicator" and then a combination of the two, the ADX "Average Directional Indicator". Generally speaking, if the DI+ is above the DI- and the ADX is greater than 25 then we are in a positive trending market. If the DI+ is less than the DI- and the ADX is greater than 25 then we are in a negative trending market. If the ADX is less than 25 then there is no trend in place and we are in a range bound "choppy market".
So, I created this chart to show when the ADX is > 25 (or you can enter your own number) and the DI+ is > DI- then the background will be green. Vice versa, when the ADX is >25 and the DI+ is < DI- then we are in a negative trending market and the background color will be red. If the ADX is < 25 (or whatever you choose) then we are in a choppy 'range-bound" market.
Regarding the ParSAR. Pay attention to the "+" marks. they indicate whether we are bullish or bearish. When we cross through a + then we revert to the opposite. "Stop And Reverse". They are a simple calculation of a starting percentage, an incremental increase in that percentage, and a max percentage increase. If you want your system to trade less, decrease the "maximum" If you want it to trade more, increase the maximum.
Tinker around with these and you might find a healthy strategy you can trade on.
If you add Take Profit Targets and Stop Loss Targets, this is an even more productive strategy. Try it out on BINANCE:ETHUSDT with a 2hr time horizon and 0.02, 0.023, 0.2.

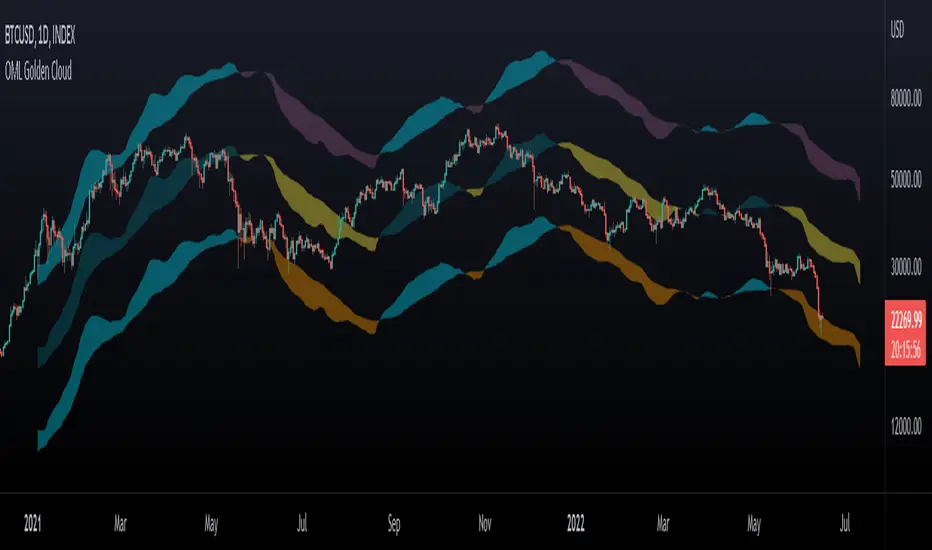
OhManLan Golden CloudThis indicator is a modification of the popular Ichimoku indicator, build high/low channels using the Golden Ratio, Volume-weighted average price allows smoother components.
high/low channels moves based on Fibo Levels (Golden Ratio: 1.618).
- Settings -
The indicator can be adjusted to your needs.
- How to use -
OhManLan Golden can be used a Support/Resistance , Stop loss, Trailing stop and Price target.
Volume-weighted average price allows smoother components.
Can be used with other indicators such as Moving Average Convergence Divergence (MACD).
Parabolic SAR of KAMA [Loxx]Parabolic SAR of KAMA attempts to reduce noise and volatility from regular Parabolic SAR in order to derive more accurate trends. In addition, and to further reduce noise and enhance trend identification, PSAR of KAMA includes two calculations of efficiency ratio: 1) price change adjusted for the daily volatility; or, 2) Jurik Fractal Dimension Adaptive (explained below)
What is PSAR?
The parabolic SAR indicator, developed by J. Wells Wilder, is used by traders to determine trend direction and potential reversals in price. The indicator uses a trailing stop and reverse method called "SAR," or stop and reverse, to identify suitable exit and entry points. Traders also refer to the indicator as to the parabolic stop and reverse, parabolic SAR, or PSAR.
What is KAMA?
Developed by Perry Kaufman, Kaufman's Adaptive Moving Average (KAMA) is a moving average designed to account for market noise or volatility. KAMA will closely follow prices when the price swings are relatively small and the noise is low. KAMA will adjust when the price swings widen and follow prices from a greater distance. This trend-following indicator can be used to identify the overall trend, time turning points and filter price movements.
What is the efficiency ratio?
In statistical terms, the Efficiency Ratio tells us the fractal efficiency of price changes. ER fluctuates between 1 and 0, but these extremes are the exception, not the norm. ER would be 1 if prices moved up 10 consecutive periods or down 10 consecutive periods. ER would be zero if price is unchanged over the 10 periods.
What is Jurik Fractal Dimension?
There is a weak and a strong way to measure the random quality of a time series.
The weak way is to use the random walk index (RWI). You can download it from the Omega web site. It makes the assumption that the market is moving randomly with an average distance D per move and proposes an amount the market should have changed over N bars of time. If the market has traveled less, then the action is considered random, otherwise it's considered trending.
The problem with this method is that taking the average distance is valid for a Normal (Gaussian) distribution of price activity. However, price action is rarely Normal, with large price jumps occuring much more frequently than a Normal distribution would expect. Consequently, big jumps throw the RWI way off, producing invalid results.
The strong way is to not make any assumption regarding the distribution of price changes and, instead, measure the fractal dimension of the time series. Fractal Dimension requires a lot of data to be accurate. If you are trading 30 minute bars, use a multi-chart where this indicator is running on 5 minute bars and you are trading on 30 minute bars.
Conclusion from the combined efforts explained above:
-PSAR is a tool that identifies trends
-To reduce noise and identify trends during periods of low volatility, we calculate a PSAR on KAMA
-To enhance noise and reduction and trend identification, we attempt to derive an efficiency ratio that is less reliant on a Normal (Gaussian) distribution of price
Included:
-Customization of all variables
-Select from two different ER calculation styles
-Multiple timeframe enabled

Pinbar trailing stop strategyThe strategy finds the nearest pinbar pattern and opens a position (long or short). You choose your take profit and stop loss multiplier.
Take Profit - X times the pinbar size from it's highest point.
Stop loss - X times the pinbar size from it's lowest point.
You can find more detailed screenshots and the source-code on my github page: samgozman/pinbar-strategy-tradingview

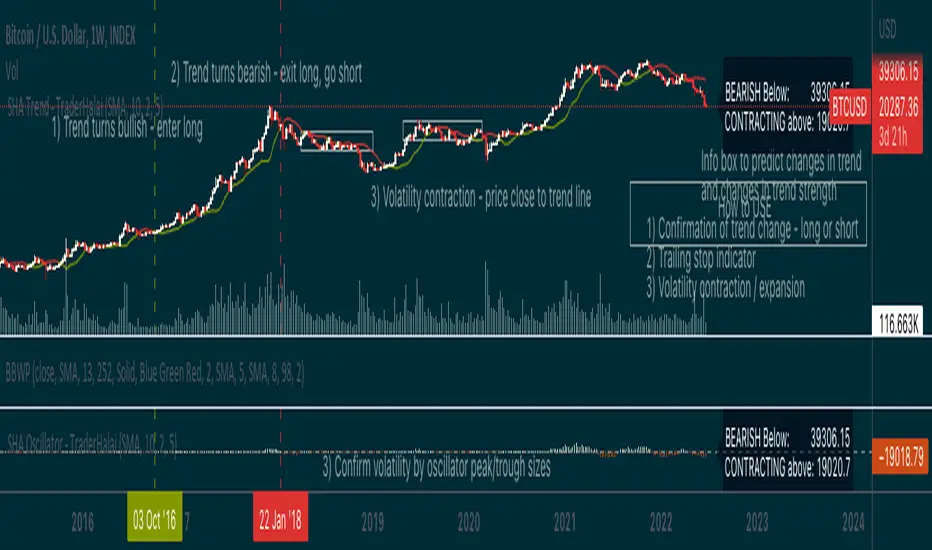
Smoothed Heikin Ashi Trend on Chart - TraderHalaiThis indicator is a predictive tool using Heikinashi to calculate shifts in trade direction.
It works by reverse-engineering the regular candle stick closing price required, to flip the Heiken Ashi candle from Red to Green and vice-versa.
Below, is an earlier indicator that I released and created. This plots this price as an oscillator, which allows traders to get a predictive indicator of a trend change.
This indicator extends upon this functionality by adding a smoothing function to the reverse-engineered regular candle stick closing price, to reduce the choppiness of signals. It also plots the indicator on the chart to allow for easier visual confirmation.
How to use
1) As a directional bias - Bullish or bearish
2) Volatility expansion/contraction - further distance from line means volatility expansion - am planning to release an oscillator version also
3) Trailing stop loss - once you are in a trade
Other Features
Select a moving average period and smoothing calculation method (e.g. SMA / EMA)
Non-repaint mode for backtesting and use/integration with higher timeframes
Final note - Open Source
I am releasing this as open-source for the benefit of the community and to allow further development, scrutiny and criticism. Please feel free to use this indicator as you see fit. If you do use this indicator to create another script, feel free to drop me a note, as I would be highly interested in your idea.
Thanks, and Enjoy!
Steven Primo's bollinger bands strategyHi, this strategy is taken from a video made by Steven Primo. You can look it up on YouTube if you want to know about it.
It is a mean-reversion strategy based on the Bollinger Bands, in which we wait for 5 consecutive closes above the upper band, and for a short-term top. Once it happens, we place an entry order on this top, with a stop at the nearest bottom before the movement started, and use the difference from the stop and entry point to determine the target. For shorting, it's the same process, but for the downside. From my testing, only long orders were profitable, but you can configure whichever you want.
It works well for directional markets with a low level of noise, as you can see with the BTCUSD chart. One of its caveats is the short number of occurrences, and the long stop loss and target. You can enable a trailing stop, but from my testings, it just made the results worse.
I made some modifications, like removing the MA requirement, since the entry point was above it almost all the time, and I forced the BB to use a log version of the prices, so that discrepancies are eliminated. You'll also notice that you can't select an extension that is lower than 100, and that is intentional, since you're not supposed to enter a trade in which you can lose more than what you can earn.
I chose not to implement any kind of risk management, but I might do that in the future. You can leave your suggestions in the comments.

PB Trend ScalperA moving average strategy using a long period RMA and a short period EMA. It has a trailing stop loss based on the previous higher high or lower low. It also has a no trade band surrounding the RMA whose thickness can be changed.
Check out the settings to see what elements values can be changed.
The strategy is set to use the whole balance on each trade currently.
Leverage can be adjusted as well as take profit target as %.
The default values are set up for the 1 hour on BTCUSD.
These can be tweaked to suit any timeframe or market.

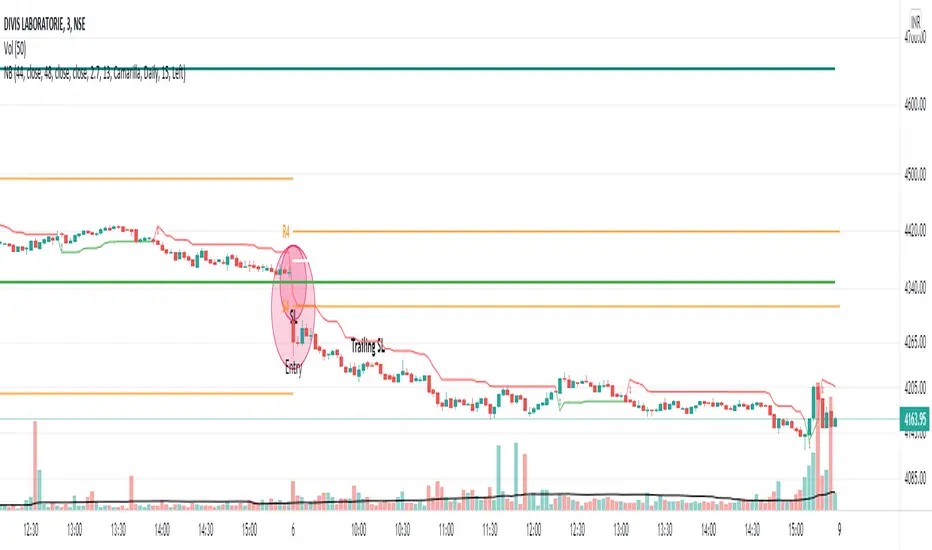
NoBrain BreakoutUse 3min. Time frame.
Buy Stock Selection:-
When Close Price Cross Monthly Standard Pivot R1 & Monthly Standard Pivot R1 is Greater than Previous Day High( PDH ) Or Close.
Price must be Above 44 MA ,48 EMA & Vwap
***Buy When 3min Candle closed Above Camarilla R4 or Monthly Standard Pivot R1 whichever is High.
Sell Stock Selection:-
When Close Price Cross Monthly Standard Pivot S1 & Monthly Standard Pivot S1 is Less than Previous Day Low( PDL ) Or Close.
Price must be Below 44 MA ,48 EMA & Vwap
***Sell When 3min Candle closed Below Camarilla S4 or Monthly Standard Pivot S1 whichever is Low.
Trading time for
1st wave 9.30am to 10.45am.
2nd wave 12.45pm to 2.45pm.
(Based on NSE/ BSE India)
Indicators:-
1) Pivot Points Standard - Time Frame monthly.only select R1
2) Pivot Points Camarilla- Only select R4.
3) SMA 44
4) EMA 48
5) Vwap
6) For Trailing Stop Loss use SuperTrend- Length-13 Factor-2.7 or Length-15 Factor-3 (3min Timeframe)
DEBUG SIGNALTest version of the bot.
Egnore the sell signals.
Enter on buy signals and have stop loss of ( 2-3 %) and set your take profit to (+1%) and do trail stop for rest of the trade
CCI + EMA with RSI Cross StrategyThis strategy uses the CCI + 2 RSIs + 2 EMAs to generate trade signals. Trades are only taken during the normal trading session and all open trades are closed 15 min before the close of the current session. A trailing stop loss is used and is customizable.
Not trading advice, use at your own risk.
