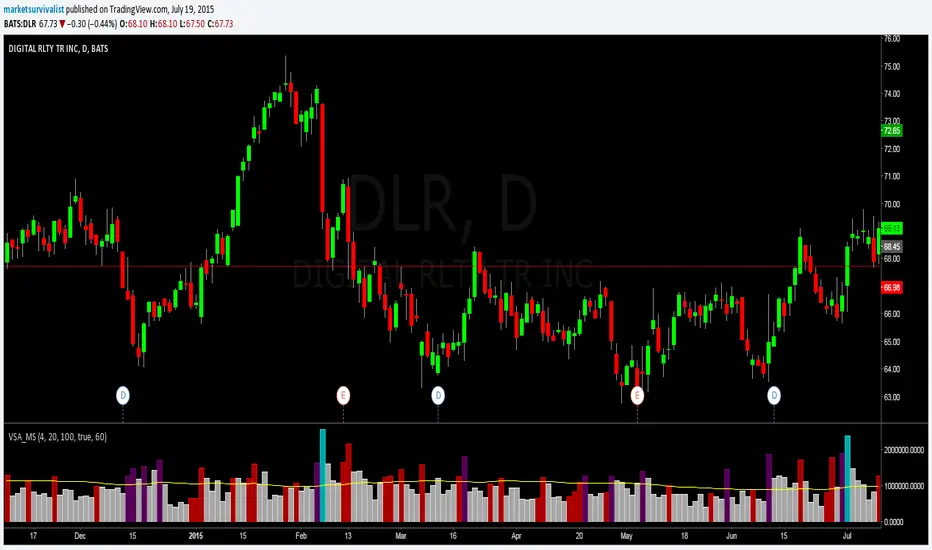
Volume Spike Analysis [marketsurvivalist]This indicator is based on the ideas about Volume Spike Analysis written about by Vincent Kott in his book Volume Spike Analysis. Formulas are presented in the book for another platform, but I wrote the script based on the charts he provided.
The indicator basically takes out the noise and colors bars based on factors of time and volume for day. There are three different time periods you can set: Short, Medium, Long. Each period can be set with a different color. The period value looks for highest volume bar within that period. If today's volume bar is the hightest value, it colors the volume bar based on the formatted color. It does not matter if the price bar is up or down. The defaults are 4 days, 20 days, 100 days. There is also a volume moving average available to show or hide based on you trading style.
The purpose is to easily see changes in volume. Typically, you would like to see volume rising as a new trend begins. This will show up quickly as you will see a cluster of rising red and / or purple bars.
在脚本中搜索"VOLUME BAR"
Volume with High-Volume Highlight + ThresholdThis indicator highlights true high-volume candles without guessing.
It compares the current bar’s volume to the average volume over the last X candles and highlights bars that exceed your chosen threshold (ex: 1.5× the average).
Features
Automatic high-volume detection
Customizable volume multiplier
Bull/bear color coding
Average volume line
Threshold line (shows exactly where “high volume” begins)
Optional on-chart label showing the required volume level
Alert for any high-volume bar
What It’s Used For
Identifying breakout strength
Confirming bounce setups at key levels
Spotting real buyers/sellers stepping in
Avoiding fake moves with weak volume
Simple Rule
If volume is greater than (Average × Multiplier) → the bar is highlighted.

Enhanced VolumeEnhanced Volume allows you to show multiple highlights on your volume:
HVE - Highest Volume Ever
HV1 - Highest Volume in 1 Year
Volume Average Moving Average
Projected Volume - Shows the projected volume based on the time of the bar left
2x and 3x volume bars. Shows to bars of where the volume needs to hit to be 2 or 3x above average
Color coding of low volume bars and high volume bars
Up/Down Volume
% Change

EVS BTC V1Overview
The "EVS BTC V1" is a momentum-based trading strategy designed for Bitcoin (BTC) or similar volatile assets on TradingView. It combines Exponential Moving Averages (EMAs) for trend direction, volume confirmation to filter for strong moves, and an optional Relative Strength Index (RSI) filter to avoid overextended entries. The strategy uses a trailing stop for exits to lock in profits dynamically. It's set up for backtesting with an initial capital of $10,000, risking 10% of equity per trade, and accounting for 0.1% commissions.This is a crossover strategy: it goes long on bullish EMA crossovers with high volume (and RSI not overbought) and short on bearish crossunders (with high volume and RSI not oversold). It's overlayed on the main price chart for easy visualization.Key Parameters (User-Adjustable)Fast EMA Period: 9 (default) – Shorter-term trend line.
Slow EMA Period: 21 (default) – Longer-term trend line.
Volume Multiplier: 1.5 (default) – Requires volume to be 1.5x the 20-period average for signal validation.
Use RSI Filter?: Enabled (default) – Optional toggle to apply RSI conditions.
RSI Period: 14 (default), with overbought threshold at 70 and oversold at 30.
Trailing Stop Profit: 50 points (default) – Activates trailing once this profit level is hit.
Trailing Stop Offset: 20 points (default) – Distance from the high/low to trail the stop-loss.
Indicators UsedEMAs: 9-period (fast, blue line) and 21-period (slow, red line) on close prices.
Volume Filter: Compares current volume to a 20-period SMA; signals only trigger if volume exceeds the average by the multiplier (highlighted in yellow bars).
RSI: 14-period on close; plotted in purple on a sub-panel if enabled, with dashed horizontal lines at 70 (overbought) and 30 (oversold).
Entry RulesEntries are triggered only when all conditions align on a bar close:Direction
Conditions
Long (Buy)
- Fast EMA crosses over Slow EMA (bullish trend shift).
- Volume is "high" (> 1.5x 20-period avg).
- RSI < 70 (not overbought; skipped if filter disabled).
Short (Sell)
- Fast EMA crosses under Slow EMA (bearish trend shift).
- Volume is "high" (> 1.5x 20-period avg).
- RSI > 30 (not oversold; skipped if filter disabled).
On entry: Places a market order using 10% of current equity.
Alerts: Fires a one-time alert per bar (e.g., "Long Signal: EMA Crossover + High Volume!").
Exit RulesNo fixed take-profit or stop-loss on entry.
Uses a trailing stop for both long and short positions:Trails the stop-loss 20 points below the highest high (for longs) or 20 points above the lowest low (for shorts), but only activates after 50 points of unrealized profit.
This allows winners to run while protecting gains dynamically.
Positions close automatically on opposite signals or trailing stop hits (no pyramiding; only one position per direction at a time).
VisualizationMain Chart: Blue fast EMA and red slow EMA lines. Green background tint on long signals, red on short signals.
Volume Sub-Panel: Gray columns for normal volume, yellow for high-volume bars; zero line for reference.
RSI Sub-Panel (if enabled): Purple RSI line with overbought/oversold dashed lines.
Strengths and ConsiderationsStrengths: Simple, trend-following with volume to avoid weak signals; RSI adds mean-reversion protection; trailing stops suit trending markets like BTC.
Risks: Whipsaws in sideways markets (EMA crossovers can false-signal); volume filter may miss low-volume breakouts; trailing parameters (50/20 points) assume a specific price scale (e.g., BTC/USD in dollars—adjust for other pairs).
Best For: Higher timeframes (e.g., 1H or 4H) on volatile crypto pairs. Backtest on historical data to tune parameters.

Artharjan High Volume Zones v2Artharjan High Volume Zones (AHVZ)
The Artharjan High Volume Zones (AHVZ) indicator is designed to identify, highlight, and track price zones formed during exceptionally high-volume bars. These levels often act as critical support and resistance zones, revealing where institutions or large players have shown significant interest.
By combining both short-term (ST) and long-term (LT) high-volume zones, the tool enables traders to align intraday activity with broader market structures.
Core Purpose
Markets often leave behind footprints in the form of high-volume bars. The AHVZ indicator captures these footprints and projects their influence forward, allowing traders to spot zones of liquidity, accumulation, or distribution where future price reactions are likely.
Key Features
🔹 Short-Term High Volume Zones (ST-ZoI)
Identifies the highest-volume bar within a short-term lookback period (default: 22 bars).
Draws and maintains:
Upper & Lower Bounds of the high-volume candle.
Midpoint Line (M-P) as the zone’s equilibrium.
Buffer Zones above and below for intraday flexibility (percentage-based).
Highlights these zones visually for quick intraday decision-making.
🔹 Long-Term High Volume Zones (LT-ZoI)
Scans for the highest-volume bar in a long-term lookback period (default: 252 bars).
Similar plotting structure as ST-ZoI: Upper, Lower, Midpoint, and Buffers.
Useful for identifying institutional footprints and multi-week/month accumulation zones.
🔹 Dynamic Buffering
Daily/Weekly/Monthly charts: Adds a fixed percentage buffer above and below high-volume zones.
Intraday charts: Uses price-range based buffers, scaling zones more adaptively to volatility.
🔹 Visual Customization
Independent color settings for ST and LT zones, mid-range lines, and buffers.
Adjustable plot thickness for clarity across different chart styles.
How It Helps
Intraday Traders
Use ST zones to pinpoint short-term supply/demand clusters.
Trade rejections or breakouts near these high-volume footprints.
Swing/Positional Traders
Align entries with LT zones to stay on the side of institutional flows.
Spot areas where price may stall, reverse, or consolidate.
General Market Structure Analysis
Understand where volume-backed conviction exists in the chart.
Avoid trading into hidden walls of liquidity by recognizing prior high-volume zones.
Closing Note
The Artharjan High Volume Zones indicator acts as a volume map of the market, giving traders a deeper sense of where meaningful battles between buyers and sellers took place. By combining short-term noise filtering with long-term structural awareness, it empowers traders to make more informed, disciplined decisions.
With Thanks,
Rrahul Desai @Artharjan

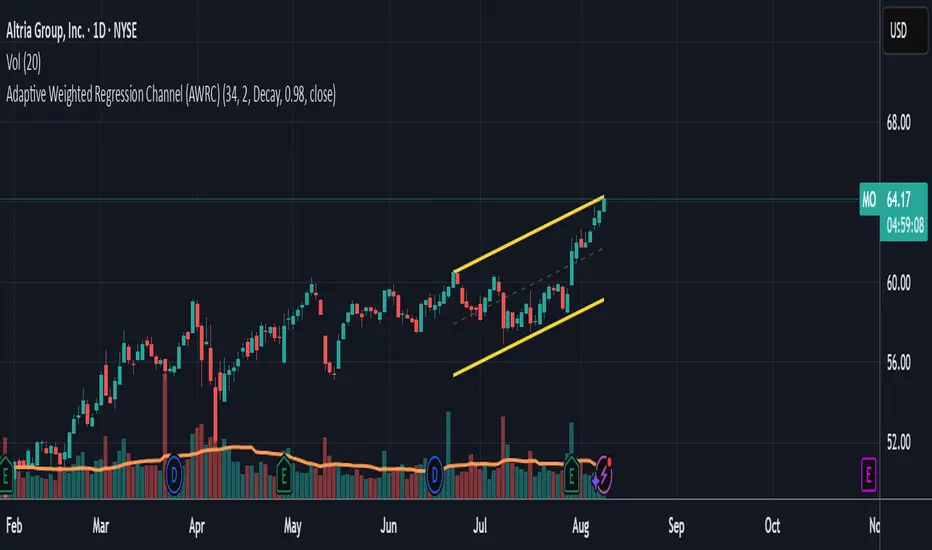
Adaptive Weighted Regression Channel (AWRC)Short Description:
The Adaptive Weighted Regression Channel (AWRC) is an advanced technical analysis tool that plots a dynamic regression channel based on the recent price action. The centerline is a linear regression (trendline) fitted to the selected price source over a rolling window. The channel boundaries are placed above and below the regression line by a user-selected multiple of the weighted standard deviation.
What makes AWRC unique is its ability to optionally weight each bar’s importance in the regression using Volume, ATR (Average True Range), or Recency Decay, offering a channel that can adapt to market volatility, participation, or trend acceleration.
Parameter Explanations:
length: Number of bars for the regression window (how many recent candles are included). Higher values = smoother, less sensitive channel.
StdDev Multiplier (mult): Controls the channel width. 2.0 is classic; higher = wider channels, lower = tighter.
Enable Weighting?: Turn ON to activate weighting of each bar. If OFF, all bars are equally weighted (classic regression channel).
Weight Type: Select what to use for weights (only active if Enable Weighting is ON):
"Volume": Higher volume bars have more influence on the regression.
"ATR": Bars with higher volatility (as measured by ATR) have more influence.
"Decay": More recent bars are given more weight (controlled by Decay parameter).
Decay: If Weight Type is "Decay", this controls the rate of recency decay. (e.g. 0.98 = slow decay; 0.90 = fast decay; values close to 1 mean a longer memory.)
Source for the calculation (src): Selects which price is regressed. Default is hl2 (average of high and low); you can choose close, open, etc.
Recommended Parameters:
For general use: length = 34, mult = 2.0, Enable Weighting = OFF, src = hl2
For volume-aware channel: Enable Weighting = ON, Weight Type = "Volume"
For volatility sensitivity: Enable Weighting = ON, Weight Type = "ATR"
For extra focus on recent price: Enable Weighting = ON, Weight Type = "Decay", Decay = 0.95 or 0.98
For swing trading: length = 21–55, mult = 1.5–2.5
For intraday/scalping: length = 10–20, mult = 1.0–1.5
Usage Tips:
The regression line shows the "best fit" trend for the selected window.
The channel captures the typical range; price breaking outside the channel can signal strength, exhaustion, or breakout.
Volume and ATR weighting help the channel adapt to market participation or volatility spikes.
Decay weighting locks onto the most recent trend direction quickly.
Adjust parameters to fit your timeframe and market volatility.
Use AWRC to spot trending moves, reversals, or overextensions.
Try different weighting and channel settings to match your trading style!
Volume with High/Low ColoringThe "Volume with High/Low Coloring" indicator is designed to help traders visually differentiate between high, low, and normal volume bars relative to recent historical averages. By applying dynamic color coding and customizable thresholds, this indicator enhances volume analysis and improves your ability to spot key moments of accumulation, distribution, or market inactivity.
High Volume: A bar is marked as high volume when it exceeds the average by a customizable multiplier (default is 1.5×) .
Low Volume: A bar is considered low volume when it falls below the average by another multiplier (default is 0.5×) .
Normal Volume: All bars that fall between the high and low thresholds.
Each category is displayed in a different user-selectable color, providing instant visual feedback for volume dynamics.
Customizable Colors:
High Volume: Light Green (default: semi-transparent green)
Low Volume: Light Blue (default: semi-transparent blue)
Normal Volume: Yellow (default: semi-transparent yellow)
Average Volume Line: Gray (optional reference line)
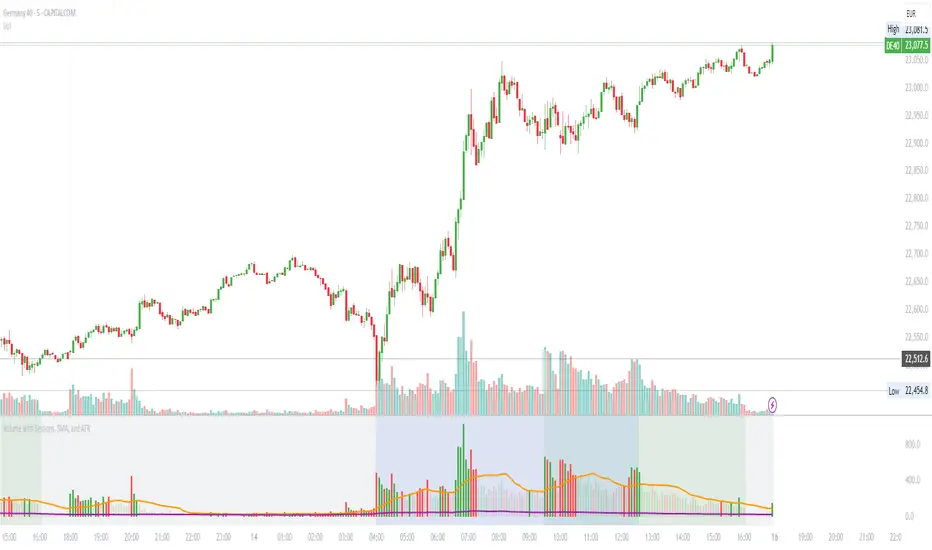
Volume with Sessions, SMA, and ATR Pine Script creates a custom volume indicator with several features, including:
SMA of Volume: It calculates the simple moving average (SMA) of the volume, which helps identify trends and determine if the current volume is above or below the average.
ATR (Average True Range): It calculates the ATR, which measures market volatility over a defined period.
Bullish/Bearish Volume Coloring: The script colors the volume bars depending on whether the price is moving up (bullish) or down (bearish), and whether the volume is above or below the SMA of volume.
Session Highlighting: It defines two major trading sessions:
NYSE (New York Stock Exchange) session from 9:30 AM to 4:00 PM Eastern Time.
LSE (London Stock Exchange) session from 8:00 AM to 4:30 PM GMT. These sessions are highlighted with background colors for easy identification.
Plotting: The volume is plotted as a histogram with varying colors depending on price movement and volume relative to its SMA. The ATR is also plotted as a purple line, and the SMA of volume is displayed as an orange line.
Background Colors: Background colors are applied during the NYSE and LSE sessions to visually differentiate between these trading periods.
Here's a breakdown of each section:
Key Inputs:
smaLength and atrLength: User-defined values for the lengths of the SMA and ATR calculations.
Main Calculations:
smaVolume: The SMA of the volume over the user-defined length (smaLength).
atrValue: The Average True Range over the user-defined length (atrLength).
Color Logic for Volume Bars:
If the current close is higher than the previous close, the volume is considered bullish, and the bar is colored green. If the volume is above the SMA, it’s a darker green; otherwise, it’s a lighter shade.
If the current close is lower than the previous close, the volume is considered bearish, and the bar is colored red. If the volume is above the SMA, it’s a darker red; otherwise, it’s a lighter red.
Plotting:
The script plots the volume as a histogram with dynamic coloring.
The SMA of the volume is plotted as a line.
ATR is plotted as a purple line for reference.
Background Color Highlighting:
The background is colored green during the NYSE session and blue during the LSE session.
Volume with EMA and Coloring RulesSummary
This indicator plots the market’s volume as a histogram in a separate panel (not overlaid on the main price chart). An EMA (Exponential Moving Average) is then calculated based on the volume. The color of each volume bar switches dynamically:
• Blue when the bar’s volume is higher than the EMA
• White when the bar’s volume is lower than or equal to the EMA
This simple visual cue allows you to quickly see if the market’s current volume is above or below its average trend.
How to Use
1. Add to Chart
Apply the indicator to your TradingView chart, and it will open in a separate panel beneath the price.
2. Adjust EMA Length
Modify the “EMA Length” to control how quickly the average volume adapts to changes.
3. Interpretation
• Blue bars may indicate stronger-than-usual participation.
• White bars indicate volume is relatively lower compared to its recent average.
This indicator provides an at-a-glance way to see if trading activity is intensifying or easing, which can be paired with other technical or fundamental tools to help confirm market shifts or potential opportunities.

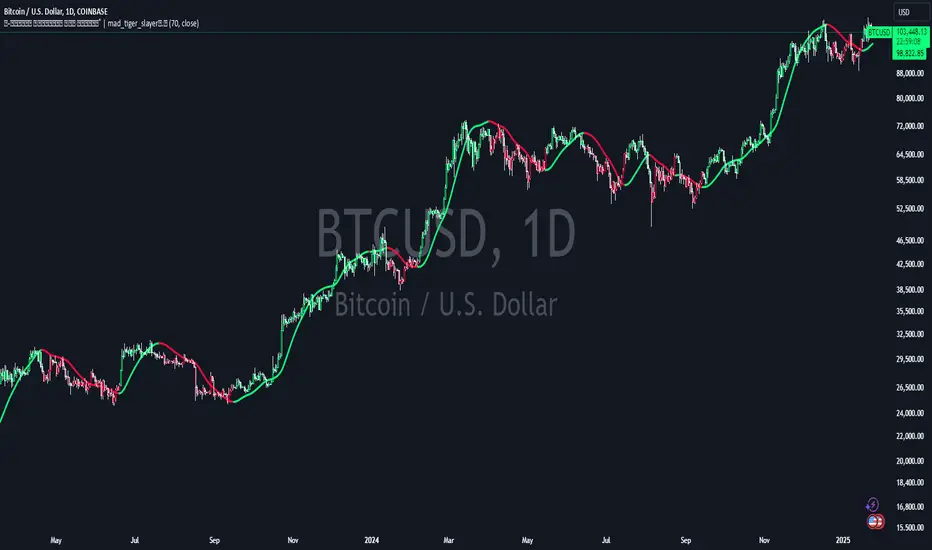
Volume Weighted HMA Index | mad_tiger_slayerTitle: 🍉 Volume Weighted HMA Index | mad_tiger_slayer 🐯
Description:
The Volume Weighted HMA Index is a cutting-edge indicator designed to enhance the accuracy and responsiveness of trading signals by combining the power of volume with the Hull Moving Average (HMA). This indicator adjusts the HMA based on volume-weighted price changes, providing faster and more reliable entry and exit signals while reducing the likelihood of false signals.
Intended and Best Uses:
Used for Strategy Creation:
Extremely Quick Entries and Exits
Intended for Higher timeframe however can be used for scalping paired with additional scripts.
Can be paired to create profitable strategies
TREND FOLLOWING NOT MEAN REVERTING!!!!
[Key Features:
Volume Integration: Dynamically adjusts the HMA using volume data to prioritize higher-volume bars, ensuring that market activity plays a crucial role in signal generation.
Enhanced Signal Clarity: The indicator calculates precise long and short signals by detecting volume-weighted HMA crossovers.
Bar Coloring: Visually differentiate bullish and bearish conditions with customizable bar colors, making trends easier to identify.
Custom Signal Plotting: Optional long and short signal markers for a clear visual representation of potential trade opportunities.
Highly Configurable: Adjust parameters such as volume length and calculation source to tailor the indicator to your trading preferences and strategy.
How It Works:
Volume Weighting: The indicator calculates the HMA using a volume-weighted price change, amplifying the influence of high-volume periods on the moving average.
Trend Identification: Crossovers of the volume-weighted HMA with zero determine trend direction, where:
A bullish crossover signals a long condition.
A bearish crossunder signals a short condition.
Visual Feedback: Bar colors and optional signal markers provide real-time insights into trend direction and trading signals.
Use Cases:
Trend Following: Quickly identify emerging trends with volume-accelerated HMA calculations.
Trade Confirmation: Use the indicator to confirm the strength and validity of your trade setups.
Custom Signal Integration: Combine this indicator with your existing strategies to refine entries and exits.
Notes:
Ensure that your trading instrument provides volume data for accurate calculations. If no volume is available, the script will notify you.
This script works best when combined with other indicators or trading frameworks for a comprehensive market view.
Inspired by the community and designed for traders looking to stay ahead of the curve, the Volume Weighted HMA Index is a versatile tool for traders of all levels.
Options Series - Index Analysis [MasterPiece]
Powerful Insights 🚀:
This script utilizes multiple technical indicators to provide a comprehensive view of stock trends, which increases the reliability of trading signals.
This script also designed to perform index and stock analysis by comparing price movements to moving averages (MA20) and volume-weighted average price (VWAP).
By analyzing a set of top-weighted stocks within an index, the script offers a macro-level view while also delivering stock-specific insights. This dual focus enhances its utility for traders who need to understand both individual stock movements and broader market dynamics.
⭐ Originality: The script presents a unique fusion of multiple indicators with a data-driven approach to analyzing top-weighted stocks in major indices like Nifty and BankNifty. The integration of widely-used technical analysis tools, such as exponential and simple moving averages (EMA, SMA), volume-weighted average price (VWAP), and volume-body size comparisons, offers a holistic framework for traders. By focusing on the top five stocks in the indices, it leverages weightage-based performance analysis, adding a strategic dimension to index trading. This approach not only evaluates individual stock performance but also synthesizes broader market trends.
⭐ Usefulness: This script serves traders who seek a multi-dimensional method for analyzing both index and stock performance. Its key features include:
Bullish and Bearish Signals: The relationship between price, moving averages (MA20), and VWAP identifies directional trends, generating buy/sell signals for both individual stocks and the overall index.
Volume and Candle Body Analysis: By comparing candle body size with volume, the script provides deeper insights into trend strength and market conviction. This allows traders to gauge whether price movements are supported by sufficient trading volume.
Customization: Users have the flexibility to input specific index and stock symbols, making the script adaptable for different markets and instruments beyond just Nifty and BankNifty.
Signal Overlay: The ability to overlay bar color and volume signals directly on the price chart ensures better trend visualization, offering clear and immediate visual cues for potential trading setups.
⭐ Justification for Mashup: The combination of multiple indicators is logical and complementary. Each component serves a distinct purpose that enhances the overall system:
Trend Identification: Moving averages and VWAP provide insights into short and long-term trends, giving traders a reliable baseline for price direction.
Conviction: The inclusion of volume and candle body size comparisons gives additional weight to price action, allowing traders to confirm whether a trend is backed by meaningful market activity.
⭐ Color Customization for Enhanced Visualization:
The script defines custom colors for various conditions and candles, improving clarity for bullish and bearish trends.
Green for Bullish: Dark green for regular bullish candles, and fluorescent green for stronger bullish signals.
Red for Bearish: Dark red for regular bearish candles, and fluorescent red for stronger bearish signals.
Neutral Conditions: Fluorescent yellow is used for neutral conditions.
⭐ Index and Top Stocks Analysis:
This section analyzes top-weighted stocks for indices ( NSE:NIFTY and NSE:BANKNIFTY ), with NSE:BANKNIFTY being used as the default.
Top Stocks for NSE:NIFTY : HDFCBANK, ICICIBANK, RELIANCE, INFY, ITC.
Top Stocks for NSE:BANKNIFTY : HDFCBANK, ICICIBANK, KOTAKBANK, AXISBANK, SBIN.
Customizable Input: Users can modify the index and stock symbols via input.symbol.
⭐ Signal Generation Based on MA20 and VWAP:
The conditions for bullish or bearish signals are based on the relationship between the stock's close price, MA20, and VWAP.
Bullish Signal: Close price greater than both MA20 and VWAP.
Bearish Signal: Close price less than both MA20 and VWAP.
⭐ Volume Bar Signal for Market Activity:
The script analyzes candle body size and volume to detect significant market movements.
Body Size and Volume Comparison: It checks if the current candle’s body size or volume is greater than the moving average of body size or volume over the past 74 bars.
Green Candle (GC) and Red Candle (RC): Boolean conditions to track whether the close price is higher or lower than the open price.
⭐ Average Signals for Strong Trends:
The script calculates average bullish or bearish signals based on the majority of candles being green or red and significant body size or volume.
Bullish Average Signal: At least 4 out of 6 stocks exhibit bullish conditions (green candles, large bodies, or high volume).
Bearish Average Signal: Similar logic for bearish signals with red candles.
⭐ Overlay of Volume Bar Signals:
The plotshape function overlays the bullish and bearish volume bar signals on the chart, using color and shape to indicate trend changes.
🚀 Conclusion:
This Pine Script code provides a robust framework for index analysis based on top 5 weighted stocks, using two primary indicators—MA20 (20-period Moving Average) and VWAP (Volume Weighted Average Price).
Market Bias Identification: The script identifies bullish and bearish conditions for each stock based on whether the close price is above or below MA20 and VWAP.
Volume and Body Size Comparison: It checks if the current candle’s body size or volume exceeds the average to determine significant market moves.
Visualization with Color & Signals: It overlays color signals for bullish (fluorescent green) and bearish (fluorescent red) markets and provides triangle markers for strong volume-based signals.
Top Stock Analysis: The script provides analysis of top five weighted stocks in the selected index, enhancing precision for broader index analysis.

Auto-magnifier / quantifytools- Overview
Auto-magnifier shows a lower timeframe view of candles and volume bars inside any main timeframe candle by zooming into it. Candles and volume bars as they develop are shown chronologically from left to right. By default, magnifier is triggered when less than 3 candles are visible on the chart.
By default, 20 lower timeframe candles are displayed by splitting main timeframe into 20 parts. The amount of candles displayed is a target rate, meaning the script will use a lower timeframe that has the closest match to 20 candles and therefore will vary a bit. Users can override automatic timeframe calculation and opt in to display any specific lower timeframe or adjust amount of candles shown (e.g. 20 -> 30 candles) per each main timeframe candle.
Example
Main timeframe set to 30 minute, candles displayed set to 20 -> Magnifying using 2 minute candles (30 minute/20 candles = 1.5 min, rounded to 2 min)
Main timeframe set to 30 minute, override set to 5 minutes -> Displaying 5 minute candles
Size of volume bars is calculated using relative volume (volume relative to volume SMA20), lowest bar representing relative volume values of under or equal to 1x the moving average and from there onwards progressively growing.
- Limitations and considerations
Amount of candles shown might flow over from the background on smaller screen sizes, in which case you would want to decrease the amount shown. Opposite is true for bigger screens, this value can be increased as more candles fit.
This indicator involves a lot of tricks with text elements to make it work automatically by zooming in. Size of wicks, bodies and volume bars are calculated by adding more text elements on big candles and less text elements on smaller candles. This means the displayed candles won't be a 100% match, but a rather a fair representation of the view, e.g. candle is green = lower timeframe candle is green, candle has a big wick = lower timeframe candle has a big wick (but not a 100% match).
Example
Magnified lower timeframe chart vs. Actual lower timeframe chart
Most mismatch will be found on the price levels where lower timeframe candles are shown, which is sacrificed for the sake of getting a better readability on the overall shape of lower timeframe price action. Users can alternatively optimize calculations for more accuracy, giving a better representation of the price levels where candles truly originated. This typically comes with the cost of worse readability however.
Example
Optimized for readability vs. Optimized for accuracy
- Visuals
All visual elements are fully customizable.

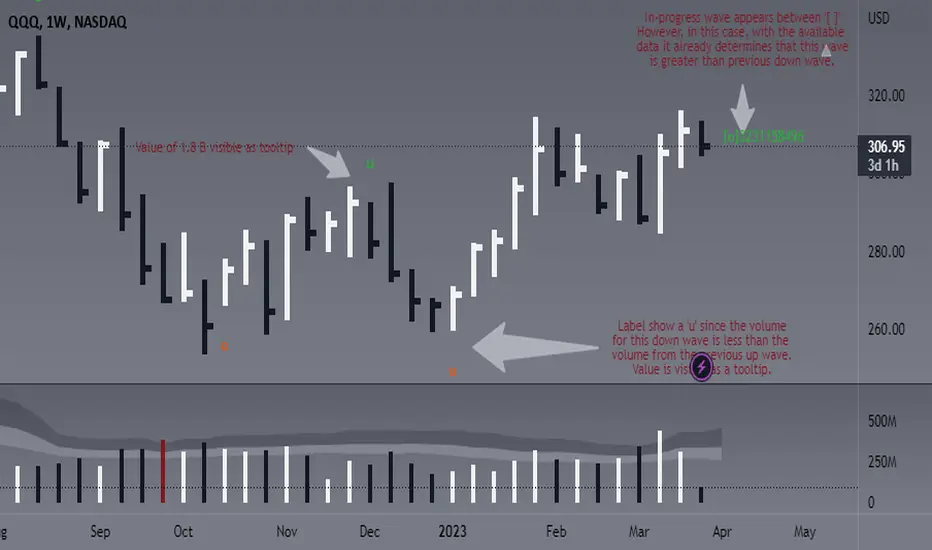
Weis Wave Volume - Simple labels and comparisonThis script is designed to identify and display the Weis Wave Volume on a chart. The Weis Wave Volume is a volume-based indicator that helps traders analyze market waves, identify trend reversals, and assess the strength of a trend. The script calculates wave volume based on user-defined input parameters, detects price waves, and displays the results as labels on the chart.
This version in particular is based on ideas from @the_MarketWhisperer and some other pieces of the script from @LucF.
The overall functionality of the script is to identify price waves and their corresponding volume. It does this by determining the trend direction and detecting trend reversals based on user-defined inputs such as the Trend reversal length and Price source for trend detection. The script also calculates and displays the cumulative volume of the current wave, the number of bars in the wave, the average volume in the wave, and consecutive increasing average volume bars in the same wave:
- An 'o' is printed to show that the volume of the current wave was 'O'ver/ above the count of the volume from preceding wave (regardless of it being up or down).
- An 'u' is printed to show that the volume of the current wave was 'U'nder/ below the count of the volume from preceding wave (regardless of it being up or down).
- Current wave will be between ' ' signaling that the wave is not confirmed yet.
- Actual values for the wave are available as tooltips. You decide how many bars to show the labels for, but for now and since I am a fan of clean charts, this is set to 50.
The user can adjust various inputs that affect the output of the script, such as Trend reversal length, Price source for trend detection, Labels for X last bars. Adjusting these inputs allows the trader to customize the script's behavior to better suit their trading style or specific market conditions. For example, by increasing the Trend reversal length, the script will require more consecutive bars in the opposite direction to confirm a trend reversal, potentially filtering out shorter-term price fluctuations. Similarly, adjusting the Price source for trend detection allows the user to base trend calculations on different price values, such as the high, low, or close of each bar.
In addition to the customizable inputs, the user can enable or disable the display of pivot markers and choose the colors for the up and down volume labels. This helps the trader to easily visualize and analyze the wave volume information on the chart.
In summary, this script offers traders a powerful tool for visualizing and analyzing the Weis Wave Volume on a chart. By identifying price waves, detecting trend reversals, and providing insights into the strength of a trend based on volume, the script can be a valuable addition to a trader's technical analysis toolbox. Please note this is not meant to provide any buy or sell signals, it should be rather used to complement your existing analysis.
Have fun and trade wisely ;)
Educational Destiny Modified Volume 1It uses Current Contract Nifty Future volume (NIFTY1!) and Current Contract Banknifty Future volume (BANKNIFTY1!) to show you volume with modifications on Nifty & Banknifty Spot charts.
As Nifty spot & Banknifty spot Charts doesnot have a volume.
This indicator may assist those traders who trade in options.
looking at the chart of Nifty spot & Banknifty spot
but want to see some volume to get some idea.
Little bit of Maths & Calculation is used in this
indicator to show you volume with modifications.
If you will use it on Nifty Chart it will show
modified volume of Current Nifty Future.
If you will use it on Banknifty Chart it will show
modified volume of Current Banknifty Future.
If you will use it on Stock it will show that
particular stock volume with modification.
"REDUCE SIGNALS" is basically to disappear few volume bars which are below a specific calculated volume. (Remove bars with less volume)
"FURTHER REDUCE SIGNALS" will disappear few more volume bars as compare to "REDUCE SIGNALS". (Keep only bars with high volume)
You may select "REDUCE SIGNALS" or "FURTHER REDUCE SIGNALS" (Select only one out of these 2 options)
to see only significant volume rise.
If you will De-select both "REDUCE SIGNALS" or "FURTHER REDUCE SIGNALS" it will give Current Future volume for Nifty & Banknifty and Normal volume for Stocks with some calculated modifications.
This Indicator is only for Educational and Paper Trading Purpose. Please consult your financial Advisor before investing. This indicator may give error as it works on various data and calculations.

Ranged Volume DCA Strategy - R3c0nTraderUpdate: Republishing this as Public Open-Source script.
Credits:
Thank you "EvoCrypto" for granting me permission to use "Ranged Volume" to create this strategy.
Thank you "junyou0424" for granting me permission to use "DCA Bot with SuperTrend Emulator" which I used for adding bot inputs, calculations, and strategy
What does this do?
This script is mainly used for backtesting a Ranged Volume strategy to see how a 3Commas bot would perform.
I created this script out of necessity and I wanted a way to test a 3Commas DCA bot with a strategy based on “Volume.”
I came across "EvoCrypto’s" "Ranged Volume" study and strategy in TradingView and I liked it. I wanted to configure it so it can be used for DCA bot backtesting. I used parts from "junyou0424’s" "DCA Bot with SuperTrend Emulator" to add the following:
1. The Start Time and End Time
2. Price deviation to open safety orders (%)
3. Target Take Profit (%)
4. Trailing deviation
5. Base Order and Safety Order
6. Safety order volume scale
7. Safety order step scale
8. Max safety orders
In addition to the above, I also added chart indicators for "Take Profit" as well as "Safety Order"
Pre-requisites:
You can use this script without a 3Commas account and see how 3Commas DCA Bot and Ranged Volume strategy would perform vs. a non-DCA strategy. However, I highly recommend signing up for their free account and going through their training. This would give you a base understanding on the settings you will see in this strategy and why you will need to know them.
That said these are the pre-requisites I suggest you have:
1. Base Knowledge of 3Commas DCA bots
2. Base knowledge of settings such as “Max safety trades count”, “safety order volume scale” and “safety order step scale”. If these are alien to you, I suggest you read up on these.
3. Knowledge of setting up a Single-pair 3Commas bot for receiving custom TradingView signal.
4. A paper-bot to test your ideas. (Do not use a real money bot until you have tested it sufficiently with a paper-bot. You alone are responsible for your results!)
5. Add the study I created called "R3c0nTrader’s Ranged Volume Study” which adds a separate chart in its own pane showing the volume spikes. It will also generate the “buy” signals for your bot. NOTE: The study also has the same color scheme as this strategy and having the colors in both the strategy and the study will make things easier to see. If you use EvoCrypto’s Ranged Volume Study instead, just keep in mind that the colors won’t match, and you will have to manually match them.
6. Make your buy signals from your strategy are the same as in your study! To do this, use the same “Volume Range Length” you entered in the STRATEGY and enter that value for the “Volume Range Length” in the STUDY. Also ensure you have the same settings for “Heikin Ashi” (On or Off).
Comparisons of Ranged Volume Strategy vs Ranged Volume DCA Strategy
BTCUSD
Beware of Strategies that claim super high profits. This can easily be done by lowering the initial capital to something unrealistic. If I did that with this strategy and set the initial capital $100 and base order size to $100, I get a net profit of 2,864% which is not realistic.
How to Use
1. On the “Inputs” tab:
a. Set your Start and End Time to backtest against.
b. Set your “Volume Range Length” (number of bars to look back)
c. “Heikin Ashi Colors” – Usually I leave this enabled
d. “Show Bar Colors” – Leave enabled
e. “Show Break-Out” – Leave enabled
f. “Show Range” – Leave enabled
g. Set your other inputs which are those settings you would find in your 3Commas bot that you want to test (e.g., Price deviation to open safety orders, Target Take Profit, Base order, Safety order, etc.).
h. Quick Example for BTCUSD on 2hr chart:
i. Price deviation to open safety orders (%) = 6
ii. Target Take Profit (%) = 14
iii. Trailing deviation = 0
iv. Base order = 100
v. Safety order = 200
vi. Safety order volume scale = 2
vii. Safety order step scale = 1.4
viii. Max safety order = 5
2. On the “Properties” tab, set your initial capital, base currency, etc.
a. Initial capital – Default is 10,000 (Please use realistic values here. The amount here should be able to cover ALL your safety orders if they were triggered. Ideally, you should have funds left over and not use all trade capital.)
b. Base currency – Select your currency
c. Order Size - Not used. Use the “Inputs” tab to change your base order size.
d. Leave “Pyramiding” set to 999. This acts as a ceiling to the “Max safety orders” on the “Inputs” tab. It must always be higher than your “Max safety orders.” For example, if you set your “Max safety orders” to “4” and “Pyramiding” to “4” then it effectively means you have “3” “Max safety orders” and not “4” because it is counting each successive entry including the initial order.
e. “Commission” - Optional
f. “Verify price for limit orders” – Leave at zero. This does not change anything that I can tell.
g. Optional - Enter a value for “Commission”
h. Slippage – Optional. Slippage does not occur in backtesting but does occur in real trading but it can be simulated. Example use case for tracking performance of a real money bot: You enter the start date and time of your bot’s trade into this strategy and you notice some values are a little off due to slippage (average price, take profit, safety orders are not lining up) then you would go back here and increase the slippage until those lines up close enough with your actuals.
i. Margin for long positions – I don’t use this honestly.
j. Margin for short positions – I don’t use this honestly.
k. Recalculate “After order is filled” and “On every tick” – I don’t use this honestly.
3. “Style” tab
a. Ranged Volume Bar Coloring - You must disable bar coloring in any studies you added or this may not work properly
i. Color 0 – Default Yellow; appears when a volume breakout occurs
ii. Color 1 – Default Red; appears when a volume breakdown occurs
iii. Color 2 – Light Blue; appears when Close is higher than the Open
iv. Color 3 – Dark Blue; appears when the Close is lower than the Open
b. Take profit – Default Green; take profit line
c. Safety order – Default Light Blue; safety order line
d. No Safety Orders left – Default Red; when a trade runs out of safety orders, the line turns red and there is no safety orders left underneath to catch any further falling price movements.
e. Avg Position Price – Default Orange; your average position price for any given trade.
f. Take Profit Plot Area – Default Green; creates a highlighted area for your take profit
g. SO Plot Area – Default Light Blue; creates a highlighted area for your safety orders
h. Trades on chart – Show or hide your trades on the chart
i. Signal labels – Show or hide the trade signal labels on the chart
j. Quantity – Show or hide the trade quantity on the chart
Explanation of Chart lines and colors on chart

Super Volume+(Süper Hacim+)English
The "Super Volume+" plug-in was designed to be used in conjunction with the "Super Volume" plug-in, but can also be used alone. It facilitates the use of "Volume Bar Patterns(Volume Action)" by marking voluminous and non-voluminous bars on the chart. It also helps to distinguish between useful support and resistance by highlighting strong trading zones. You can receive "high volume" notifications with the alarm feature.
How to use?
Volume buys and sells are marked with dark dots.
Volumeless buys and sells are marked with light colored dots.
Having more dark dots on the support or resistance lines you draw indicates that those regions are strong regions.
Warning: I discovered these formations, they are still in the testing phase. You should be careful while using it.
Shifting Volume Patterns
*The volumeless red candles on the hills indicate that the decline will begin, and the decline accelerates with the normal and volume sales that follow.
*Green candles with no volume at the bottom indicate that the rise will begin, and the rise will accelerate with the normal and voluminous purchases that follow.
Fake Volume Patterns
*Volumeless red candles formed in an upward movement are false decreases and the rise continues.
*The volumeless green candles formed in a bearish movement are false rises and the decline continues.
Working logic:
For Shifting Volume Formations; the total volume of buying and selling is less than half of the 90 bar average. Incoming transactions are greatly reduced. This shows us that either the buyer or the seller is about to run out. Transactions of the prevailing party increase. We can understand which side is winning by looking at the color of the candle when the candle is closed. If it is red, the decline continues, if it is green, the rise continues.
For Fake Volume Formations; the total volume of buying and selling is less than half of the 90 bar average. Let's consider a minor trend, a candle without volume (buying or selling without volume) will not be enough to disrupt the trend. A small amount that comes in cannot change the direction of the buying or selling transaction. The price continues in the same direction even if there are candles of different colors in the trend.
Türkçe
"Süper Hacim+" eklentisi "Süper Hacim" eklentisi ile birlikte kullanılmak için tasarlandı ancak tek başına da kullanılabilir. Grafik üzerinde hacimli ve hacimsiz barları işaretleyerek "Hacim Çubuk Formasyonlarının" kullanımını kolaylaştırır. Ayrıca güçlü alım satım bölgelerini belirginleştirmesi sayesinde işe yarayacak destek ve dirençlerin kolayca ayırt edilmesine yardımcı olur. Alarm özelliği ile "yüksek hacim" bildirimleri alabilirsiniz.
Nasıl Kullanılır?
Hacimli alış ve satışlar koyu renkli noktalar ile işaretlenir.
Hacimsiz alış ve satışlar açık renkli noktalar ile işaretlenir.
Çizdiğiniz destek veya direnç çizgileri üzerinde koyu renkli noktaların fazla olması o bölgelerin güçlü bölgeler olduğunu gösterir.
Uyarı: Bu formasyonları ben keşfettim hala test aşamasındadır. Kullanırken dikkatli olmalısınız.
Yön Değiştiren Hacim Formasyonları
*Tepelerde oluşan hacimsiz kırmızı mumlar düşüşün başlayacağına işaret eder sonrasında gelen normal ve hacimli satışlarla düşüş hızlanır.
*Diplerde oluşan hacimsiz yeşil mumlar yükselişin başlayacağına işaret eder sonrasında gelen normal ve hacimli alışlarla yükseliş hızlanır.
Fake Hacim Formasyonları
*Bir yükseliş hareketi içerisinde oluşan hacimsiz kırmızı mumlar sahte düşüşlerdir yükseliş devam eder.
*Bir düşüş hareketi içerisinde oluşan hacimsiz yeşil mumlar sahte yükselişlerdir düşüş devam eder.
Çalışma mantığı:
Yön Değiştiren Hacim Formasyonları için; alış ve satış toplam hacim miktarı 90 barlık ortalamanın yarısından azdır. Gelen işlemler çok azalmıştır. Bu da bize alıcıların yada satıcıların ikisinden birinin bitmek üzere olduğunu gösterir. Üstünlük kazanan tarafın işlemleri artar. Hangi tarafın kazandığını mum kapandığında rengine bakarak anlayabiliriz kırmızı ise düşüş devam eder yeşil ise yükseliş devam eder.
Fake Hacim Formasyonları için; alış ve satış toplam hacim miktarı 90 barlık ortalamanın yarısından azdır. Minör bir trend düşünelim yükselen yada düşen trendin tersine oluşacak hacimsiz mum (hacimsiz alış veya satış) trendi bozmaya yetmeyecektir. Gelen küçük bir miktar alış yada satış işlemin yönünü değiştiremez. Trend içinde farklı renkte mum olsa da fiyat aynı yönde devam eder.
Örnek / Example:

TraderLion’s Enhanced VolumeTraderLion’s Enhanced Volume has the following features highlighted below.
1. High Relative Volume Bars: Clearly highlight high relative volume bars with a high closing range lime green for the best interpretation of volume on your Daily & Weekly Charts.
2. Low Relative Volume Bars: Clearly labels low relative volume days with a down arrow to interpret constructive price & volume action on your Daily & Weekly Charts.
3. Volume Labels: High volume days are labeled to show 2 things: Total shares traded and Percent above average
4. Highest Volume in Over a Year: Look for the letters HV on top of the volume bar to identify this powerful characteristic.
5. Simple Moving Average: SMA overlay on your volume without taking up limited indicator slots.
6. High Relative Volume Alerts: Set alerts that trigger when the volume surpasses the High Relative Volume Threshold.
Suggestions for additions and tweaks? Comment below!

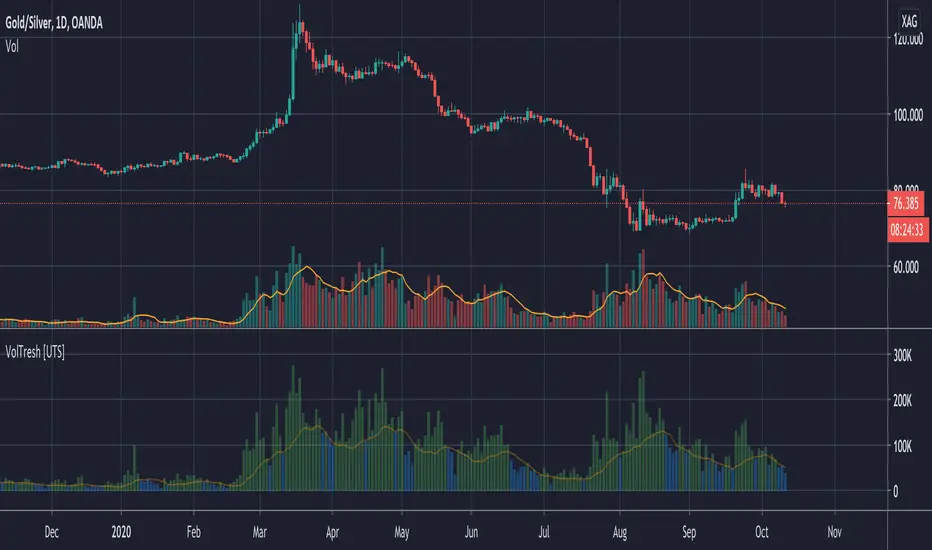
Volume Treshold [UTS]Volume Treshold
If volume of a candle is more than x percent of the average volume of the last n candles, it changes colour.
Can be shown on the candles themselves and could be set to independent figures vs the volume bars
Both elements of this, the volume bars and candles could be edited independently with the following values;
- Lookback period how many bars should be taken into consideration
- % that causes it to be triggered settable in decimals up to 3.5 where 1.0 equals to 100%
- Colour to change the volume bar to can be set via menu
- Colour to change the candle to can be set via menu
- Ability to show the treshold as visualized drawing over the histogram
- Ability to choose smoothing method SMA | EMA
- Optional: to add a moving average to the volume bars
Note: only works on charts with volume information
Accumulation/Distribution VolumeThis is a simple yet powerful indicator that can replace volume, Money Flow, Chaikin Money Flow, Price Volume Trend (PVT), Accumulation/Distribution Line (ADL), On Balance Volume (OBV).
When "Baseline Chart" option is disabled, it looks similar to regular volume. The volume bars has two shades of green and red. The dark shade shows amount of accumulation and the light shade shows total volume (what you see on a regular volume indicator). Blue line is the moving average (or cumulative total) of A/D and the gray line is for total volume.
When money volume is enabled, volume it multiplied by price. As you can see in the chart below, trade volume in terms of USD was declining after ATH. This is not the case in regular volume chart which shows instrument volume (chart above).
In Baseline view, the aggregation method you choose can turn it into different indicators. With EMA/SMA aggregation, blue and gray line shows buy/sell pressure. At 0, there is not buy or sell pressure.
If you turn off volume bars (from style menu), it gives you a reliable indicator to measure divergence. This should be more reliable than most other range-bound indicators (i.e. RSI, MFI, CMF). I will publish a TA about correctly measuring divergence (it's a must read even if you are a pro trader). Make sure that the length is set to a large number on smaller TFs such as 4h.
For following results, set aggregation to cumulative and turn off money volume:
When wick weight=0, the GRAY line is identical to OBV indicator.
When normalized by spread and wick weight=10, the BLUE line is identical to ADL (improved by true range).
When normalized by previous bar price, wick weight=0, the BLUE line is identical to PVT.
How I use this indicator:
- Baseline chart, replaced my regular volume indicator
- Mostly 4h TF for divergence
- EMA aggregation (and occasional cumulative aggregation) with length above 50. I change the length to 100 and 200 for confirmation.
- Wick weight=0 or max 2.
With this indicator, you can learn how different indicators are built and how they are different from each other. I will publish a TA to explain more about different indicators and their pros and cons.
I will publish this indicator without volume bars and additional options to make it range bound.

Heikin Ashi VolumeHeikin Ashi candles decrease market noise so that broader trends can be more easily visualized. In a typical chart utilizing Heikin Ashi candles, volume bars are colored in such a way that they also allow for the visualization of trends during a bullish/bearish move.
The Heikin Ashi Volume indicator allows the trader to continue to use the same volume bar coloring technique to visualize trends without having to utilize the Heikin Ashi candles, since a Heikin Ashi candle’s OHLC values are not true prices but instead based on calculations in order to provide the ‘denoising’ effect they are known for.
In addition to providing the Heikin Ashi Volume coloring effects, the Heikin Ashi Volume indicator also allows the user to set a volume threshold level where the bar colors will be darker unless volume is beyond that threshold, helping traders quickly determine if there is enough participation in the market at that time to justify taking risk in a trade when the market isn’t very active. The user has the option to show or hide the threshold line, change the colors of the bullish/bearish colors (for both above and below threshold volumes) and the option for the indicator to gradually brighten the bar colors are they approach the threshold instead of having a clear line of demarcation showing volume above or below the set threshold.

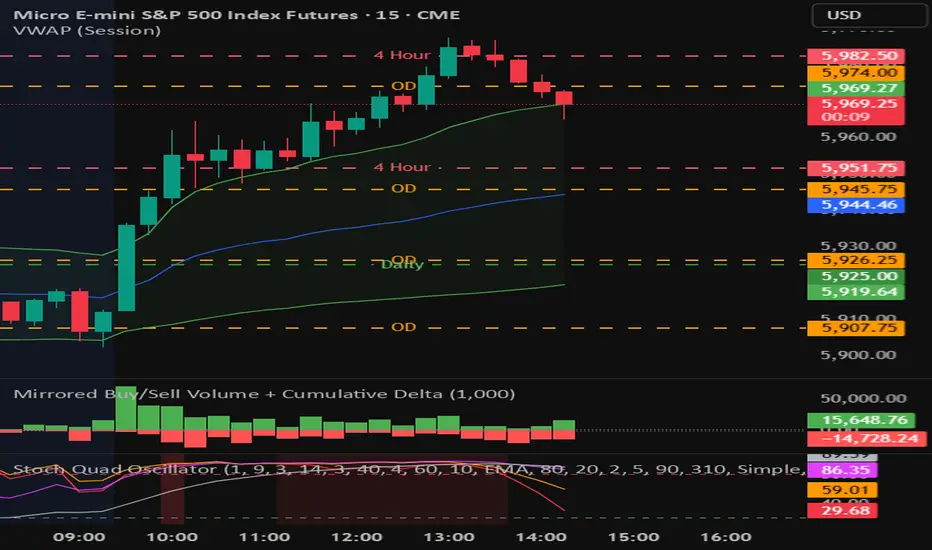
Mirrored Buy/Sell Volume + Cumulative DeltaUser Guide: Mirrored Buy/Sell Volume (Histogram)
🔍 What It Does
Displays green bars above zero for estimated buy volume
Displays red bars below zero for estimated sell volume
Adds a blue line showing Cumulative Delta (buy − sell over time)
Optional threshold lines help spot when net momentum builds up
📊 How Volume is Estimated
Same estimation method as the table version:
Buy Volume is proportion of volume estimated using (close - low) / (high - low)
Sell Volume is remainder of the total volume
Cumulative Delta = running total of (Buy − Sell) volume
This gives you:
A real-time sense of which side is gradually gaining control
More context than looking at candles or volume bars alone
✅ Best For
Visual trade decision support: who’s winning the tug-of-war?
Spotting trend initiation or momentum shifts
Combining with oscillator/trend tools for confirmation
⚠️ Limitations
Still an approximation — not based on actual trade aggressor data
Cannot separate passive vs. aggressive orders
Cumulative Delta does not reset unless specifically coded to do so
May mislead if the bar has long wicks or closes near midpoint
TradeSmart Morning GloryThe Morning Glory Indicator by TradeSmart University is a pre-market volume visualization tool designed to help traders quickly assess the quality of a morning gap. By highlighting volume levels before the market opens, this indicator helps distinguish between a professional gap (likely to continue running) and a retail/news-driven gap (likely to fade or reverse).
💡 What It Does:
This indicator plots color-coded volume bars in the pre-market session and highlights when volume crosses two key thresholds:
Teal Bars – Low institutional interest
Yellow Bars – Medium institutional interest (100K+ volume)
Red Bars – High institutional interest (400K+ volume)
These thresholds are most effective on AMEX:SPY and other high-volume ETFs or stocks, but may be customized to fit your trading style. Consider using a 15-minute chart for the above settings.
🧠 How to Use It:
This indicator works best in conjunction with the Morning Glory Strategy and Qualified Trade Setup . On its own, the indicator gives a real-time read on pre-market strength , helping you:
Confirm gap-and-go setups (gap + high volume = likely continuation)
Fade the gap (gap + low volume = higher likelihood of reversal)
While the indicator focuses exclusively on volume, the full Morning Glory strategy adds an important price gap size filter to create powerful trade signals.
📊 Probabilities of Success (Based on Full Strategy):
When used as part of the Morning Glory Qualified Trade Setup, here are the historical win rates by day of the week:
Monday: 65%
Tuesday: 77%
Wednesday: 79%
Thursday: 82%
Friday: 78%
If used in conjunction with an artificial intelligence like the Deep Sky Trading Assistant™, win-loss ratios improve to 89% or better across all days of the week.
🔔 Note: For best results, activate premium ARCA data on your TradingView account. This ensures the most accurate and complete pre-market volume data.
