Ultra VolumeVisualizes volume intensity using dynamic color gradients and percentile thresholds. Includes optional SMA, bar coloring, and adaptive liquidity boxes to highlight high- and low-volume zones in real time.
Introduction
The Ultra Volume indicator enhances volume analysis by categorizing volume bars into percentile-based intensity levels. It uses color-coded gradients to quickly identify periods of unusually high or low activity. The script also includes an optional simple moving average (SMA), bar coloring, and visual box overlays to highlight zones of significant liquidity shifts.
Detailed Description
.........
Volume Classification
Volume is segmented into five tiers: Extra High, High, Medium, Normal, and Low, using percentile ranks calculated over a dynamically adjusted historical window. This segmentation adapts based on the chart's timeframe – using 100 bars for daily and 1440/minutes for intraday – allowing for consistent behavior across resolutions.
.....
Color Gradients
Each volume bar is colored based on its percentile category, smoothly transitioning between thresholds for visual clarity. This makes it easy to spot volume spikes or droughts relative to recent history.
.....
Simple Moving Average (SMA)
An optional SMA can be plotted on top of the volume bars for trend comparison and baseline reference. Its length and color are fully customizable.
.....
Bar Coloring
You can optionally color the chart's candlesticks to reflect the same volume intensity as the histogram bars, reinforcing visual cues across the chart.
.....
Liquidity Boxes
Two adaptive box systems highlight zones of increased or decreased liquidity:
High Liquidity Boxes expand upward when price exceeds the previous box’s top.
Low Liquidity Boxes expand downward when price breaks the previous box’s bottom.
These boxes persist and auto-adjust over time unless reset, helping traders spot key zones of volume-driven price action.
.....
Box Indexing
A configurable index shift determines how far back in the chart the boxes originate. Setting this to 501 makes them "stick" to the candle where they were first created.
.....
Data Handling
A safety check ensures the script throws an error if volume data is unavailable (e.g., for some crypto or CFD symbols).
.........
Summary
Ultra Volume is a practical tool for traders who want more than just raw volume bars. With intelligent percentile-based classification, real-time adaptive liquidity zones, and fully customizable visual elements, it turns volume into a highly readable, actionable signal.
在脚本中搜索"VOLUME BAR"

Green*DiamondGreen*Diamond (GD1)
Unleash Dynamic Trading Signals with Volatility and Momentum
Overview
GreenDiamond is a versatile overlay indicator designed for traders seeking actionable buy and sell signals across various markets and timeframes. Combining Volatility Bands (VB) bands, Consolidation Detection, MACD, RSI, and a unique Ribbon Wave, it highlights high-probability setups while filtering out noise. With customizable signals like Green-Yellow Buy, Pullback Sell, and Inverse Pullback Buy, plus vibrant candle and volume visuals, GreenDiamond adapts to your trading style—whether you’re scalping, day trading, or swing trading.
Key Features
Volatility Bands (VB): Plots dynamic upper and lower bands to identify breakouts or reversals, with toggleable buy/sell signals outside consolidation zones.
Consolidation Detection: Marks low-range periods to avoid choppy markets, ensuring signals fire during trending conditions.
MACD Signals: Offers flexible buy/sell conditions (e.g., cross above signal, above zero, histogram up) with RSI divergence integration for precision.
RSI Filter: Enhances signals with customizable levels (midline, oversold/overbought) and bullish divergence detection.
Ribbon Wave: Visualizes trend strength using three EMAs, colored by MACD and RSI for intuitive momentum cues.
Custom Signals: Includes Green-Yellow Buy, Pullback Sell, and Inverse Pullback Buy, with limits on consecutive signals to prevent overtrading.
Candle & Volume Styling: Blends MACD/RSI colors on candles and scales volume bars to highlight momentum spikes.
Alerts: Set up alerts for VB signals, MACD crosses, Green*Diamond signals, and custom conditions to stay on top of opportunities.
How It Works
Green*Diamond integrates multiple indicators to generate signals:
Volatility Bands: Calculates bands using a pivot SMA and standard deviation. Buy signals trigger on crossovers above the lower band, sell signals on crossunders below the upper band (if enabled).
Consolidation Filter: Suppresses signals when candle ranges are below a threshold, keeping you out of flat markets.
MACD & RSI: Combines MACD conditions (e.g., cross above signal) with RSI filters (e.g., above midline) and optional volume spikes for robust signals.
Custom Logic: Green-Yellow Buy uses MACD bullishness, Pullback Sell targets retracements, and Inverse Pullback Buy catches reversals after downmoves—all filtered to avoid consolidation.
Visuals: Ribbon Wave shows trend direction, candles blend momentum colors, and volume bars scale dynamically to confirm signals.
Settings
Volatility Bands Settings:
VB Lookback Period (20): Adjust to 10–15 for faster markets (e.g., 1-minute scalping) or 25–30 for daily charts.
Upper/Lower Band Multiplier (1.0): Increase to 1.5–2.0 for wider bands in volatile stocks like AEHL; decrease to 0.5 for calmer markets.
Show Volatility Bands: Toggle off to reduce chart clutter.
Use VB Signals: Enable for breakout-focused trades; disable to focus on Green*Diamond signals.
Consolidation Settings:
Consolidation Lookback (14): Set to 5–10 for small caps (e.g., AEHL) to catch quick consolidations; 20 for higher timeframes.
Range Threshold (0.5): Lower to 0.3 for stricter filtering in choppy markets; raise to 0.7 for looser signals.
MACD Settings:
Fast/Slow Length (12/26): Shorten to 8/21 for scalping; extend to 15/34 for swing trading.
Signal Smoothing (9): Reduce to 5 for faster signals; increase to 12 for smoother trends.
Buy/Sell Signal Options: Choose “Cross Above Signal” for classic MACD; “Histogram Up” for momentum plays.
Use RSI Div + MACD Cross: Enable for high-probability reversal signals.
RSI Settings:
RSI Period (14): Drop to 10 for 1-minute charts; raise to 20 for daily.
Filter Level (50): Set to 55 for stricter buys; 45 for sells.
Overbought/Oversold (70/30): Tighten to 65/35 for small caps; widen to 75/25 for indices.
RSI Buy/Sell Options: Select “Bullish Divergence” for reversals; “Cross Above Oversold” for momentum.
Color Settings:
Adjust bullish/bearish colors for visibility (e.g., brighter green/red for dark themes).
Border Thickness (1): Increase to 2–3 for clearer candle outlines.
Volume Settings:
Volume Average Length (20): Shorten to 10 for scalping; extend to 30 for swing trades.
Volume Multiplier (2.0): Raise to 3.0 for AEHL’s volume surges; lower to 1.5 for steady stocks.
Bar Height (10%): Increase to 15% for prominent bars; decrease to 5% to reduce clutter.
Ribbon Settings:
EMA Periods (10/20/30): Tighten to 5/10/15 for scalping; widen to 20/40/60 for trends.
Color by MACD/RSI: Disable for simpler visuals; enable for dynamic momentum cues.
Gradient Fill: Toggle on for trend clarity; off for minimalism.
Custom Signals:
Enable Green-Yellow Buy: Use for momentum confirmation; limit to 1–2 signals to avoid spam.
Pullback/Inverse Pullback % (50): Set to 30–40% for small caps; 60–70% for indices.
Max Buy Signals (1): Increase to 2–3 for active markets; keep at 1 for discipline.
Tips and Tricks
Scalping Small Caps (e.g., AEHL):
Use 1-minute charts with VB Lookback = 10, Consolidation Lookback = 5, and Volume Multiplier = 3.0 to catch $0.10–$0.20 moves.
Enable Green-Yellow Buy and Inverse Pullback Buy for quick entries; disable VB Signals to focus on Green*Diamond logic.
Pair with SMC+ green boxes (if you use them) for reversal confirmation.
Day Trading:
Try 5-minute charts with MACD Fast/Slow = 8/21 and RSI Period = 10.
Enable RSI Divergence + MACD Cross for high-probability setups; set Max Buy Signals = 2.
Watch for volume bars turning yellow to confirm entries.
Swing Trading:
Use daily charts with VB Lookback = 30, Ribbon EMAs = 20/40/60.
Enable Pullback Sell (60%) to exit after rallies; disable RSI Color for cleaner candles.
Check Ribbon Wave gradient for trend strength—bright green signals strong bulls.
Avoiding Noise:
Increase Consolidation Threshold to 0.7 on volatile days to skip false breakouts.
Disable Ribbon Wave or Volume Bars if the chart feels crowded.
Limit Max Buy Signals to 1 for disciplined trading.
Alert Setup:
In TradingView’s Alerts panel, select:
“GD Buy Signal” for standard entries.
“RSI Div + MACD Cross Buy” for reversals.
“VB Buy Signal” for breakout plays.
Set to “Once Per Bar Close” for confirmed signals; “Once Per Bar” for scalping.
Backtesting:
Replay on small caps ( Float < 5M, Price $0.50–$5) to test signals.
Focus on “GD Buy Signal” with yellow volume bars and green Ribbon Wave.
Avoid signals during gray consolidation squares unless paired with RSI Divergence.
Usage Notes
Markets: Works on stocks, forex, crypto, and indices. Best for volatile assets (e.g., small-cap stocks, BTCUSD).
Timeframes: Scalping (1–5 minutes), day trading (15–60 minutes), or swing trading (daily). Adjust settings per timeframe.
Risk Management: Combine with stop-losses (e.g., 1% risk, $0.05 below AEHL entry) and take-profits (3–5%).
Customization: Tweak inputs to match your strategy—experiment in replay to find your sweet spot.
Disclaimer
Green*Diamond is a technical tool to assist with trade identification, not a guarantee of profits. Trading involves risks, and past performance doesn’t predict future results. Always conduct your own analysis, manage risk, and test settings before live trading.
Feedback
Love Green*Diamond? Found a killer setup?

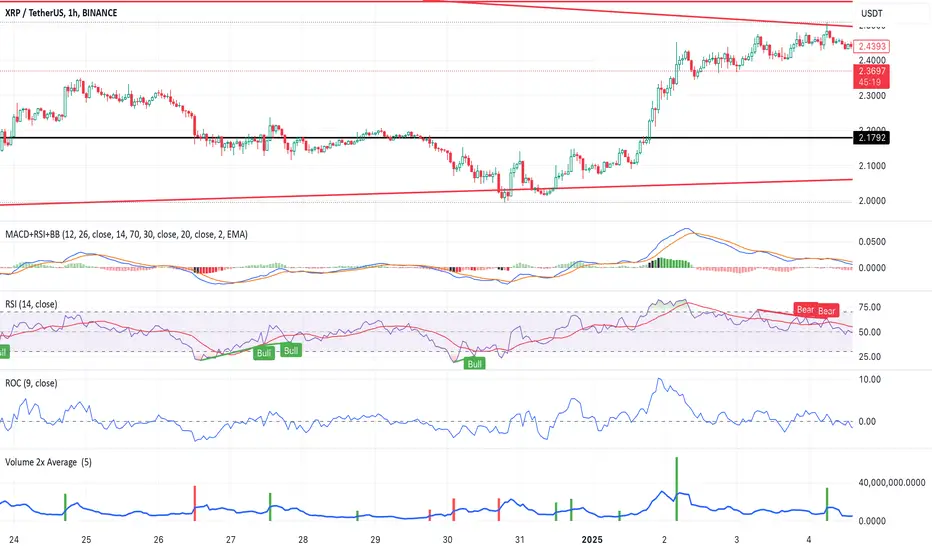
Volume 2x Average This script helps traders identify stocks or instruments experiencing unusually high trading volume compared to their average volume over a user-defined period. The key features include:
1. Volume 2x Average Filter:
Highlights bars where the current volume is greater than twice the average volume for the selected period.
2. Dynamic Average Period:
Allows users to specify the period for calculating the average volume (e.g., 1 day, 5 days, etc.).
3. Color-Coded Bars:
• Green Bars: Indicate bullish candlesticks where the closing price is higher than the
opening price.
• Red Bars: Indicate bearish candlesticks where the closing price is lower than the
opening price.
4. Optional Bar Visibility:
Users can toggle the visibility of the highlighted volume bars, providing flexibility for clean chart analysis.
5. Average Volume Line:
Plots the average volume as a blue line for reference.
Use Case:
This script is ideal for traders looking to identify potential breakouts, reversals, or key market movements driven by significant volume spikes. By dynamically adjusting the average period and toggling bar visibility, users can tailor the script to fit various trading strategies and timeframes.
Inputs:
1. Show 2x Volume Bars:
• Toggle to enable or disable the display of the highlighted volume bars.
2. Average Volume Period:
• Specify the number of periods (e.g., 1 for 1 day, 5 for 5 days) to calculate the average
volume.
Disclaimer:
This script is for educational purposes only and does not constitute financial advice. Use it alongside your analysis and trading strategy.
Jackson Volume breaker Indication# Jackson Volume Breaker Beta
### Advanced Volume Analysis Indicator
## Description
The Jackson Volume Breaker Beta is a sophisticated volume analysis tool that helps traders identify buying and selling pressure by analyzing price action and volume distribution. This indicator separates and visualizes buying and selling volume based on where the price closes within each candle's range, providing clear insights into market participation and potential trend strength.
## Key Features
1. **Smart Volume Distribution**
- Automatically separates buying and selling volume
- Color-coded volume bars (Green for buying, Red for selling)
- Winning volume always displayed on top for quick visual reference
2. **Real-time Volume Analysis**
- Shows current candle's buy/sell ratio
- Displays total volume with smart number formatting (K, M, B)
- Percentage-based volume distribution
3. **Technical Overlays**
- 20-period Volume Moving Average
- Dynamic scaling relative to price action
- Clean, uncluttered visual design
## How to Use
### Installation
1. Add the indicator to your chart
2. Adjust the Volume Scale input based on your preference (default: 0.08)
3. Toggle the Moving Average display if desired
### Reading the Indicator
#### Volume Bars
- **Green Bars**: Represent buying volume
- **Red Bars**: Represent selling volume
- **Stacking**: The larger volume (winning side) is always displayed on top
- **Height**: Relative to the actual volume, scaled for chart visibility
#### Information Table
The top-right table shows three key pieces of information:
1. **Left Percentage**: Winning side's volume percentage
2. **Middle Percentage**: Losing side's volume percentage
3. **Right Number**: Total volume (abbreviated)
### Trading Applications
1. **Trend Confirmation**
- Strong buying volume in uptrends confirms bullish pressure
- High selling volume in downtrends confirms bearish pressure
- Volume divergence from price can signal potential reversals
2. **Support/Resistance Breaks**
- High volume on breakouts suggests stronger moves
- Low volume on breaks might indicate false breakouts
- Monitor volume distribution for break direction confirmation
3. **Reversal Identification**
- Volume shift from selling to buying can signal potential bottoms
- Shift from buying to selling can indicate potential tops
- Use with price action for better entry/exit points
## Input Parameters
1. **Volume Scale (0.01 to 1.0)**
- Controls the height of volume bars
- Default: 0.08
- Adjust based on your chart size and preference
2. **Show MA (True/False)**
- Toggles 20-period volume moving average
- Useful for identifying volume trends
- Default: True
3. **MA Length (1+)**
- Changes the moving average period
- Default: 20
- Higher values for longer-term volume trends
## Best Practices
1. **Multiple Timeframe Analysis**
- Compare volume patterns across different timeframes
- Look for volume convergence/divergence
- Use higher timeframes for major trend confirmation
2. **Combine with Other Indicators**
- Price action patterns
- Support/resistance levels
- Momentum indicators
- Trend indicators
3. **Volume Pattern Recognition**
- Monitor for unusual volume spikes
- Watch for volume climax patterns
- Identify volume dry-ups
## Tips for Optimization
1. Adjust the Volume Scale based on your chart size
2. Use smaller timeframes for detailed volume analysis
3. Compare current volume bars to historical patterns
4. Watch for volume/price divergences
5. Monitor volume distribution changes near key price levels
## Note
This indicator works best when combined with proper price action analysis and risk management strategies. It should not be used as a standalone trading system but rather as part of a comprehensive trading approach.
## Version History
- Beta Release: Initial public version
- Features buy/sell volume separation, moving average, and real-time analysis
- Optimized for both intraday and swing trading timeframes
## Credits
Developed by Jackson based on other script creators
Special thanks to the trading community for feedback and suggestions

Volume Insignts AnalyzerDescription:
The Volume Insight Analyzer is an advanced Pine Script designed for traders who want a comprehensive view of volume dynamics on their charts. This script combines multiple volume-based indicators to help identify key trading opportunities, including significant volume days, volume dry-ups, and pocket pivots.
Key Features:
VDU (Volume Dry-Up) Detection: Automatically identifies and marks days when the volume is significantly below its moving average, helping to spot potential breakout or breakdown points. Customizable volume thresholds allow for tailored analysis based on your trading strategy. The Volume Dry-Up label appears when the volume is substantially below its average level and the price is near a key moving average. This condition indicates a period of equilibrium between supply and demand, suggesting a potential low-risk entry point for traders.
Pocket Pivot Analysis using 5 and 10 Length Pocket Pivots: Highlights days with exceptionally high volume compared to recent history, indicating potential pocket pivots. Visual markers on the chart and volume bars color-coded for 5 and 10-day lengths. Pocket pivot points are identified when the volume on a given day exceeds the maximum volume observed over the past several days. Specifically, a 5-day pocket pivot point is marked when today's volume surpasses the highest selling volume of the last 5 days. A cluster of 5-day pocket pivot points within a base is a strong indicator of stock strength. Similarly, a 10-day pocket pivot point following a Volume Dry-Up (VDU) suggests a potential entry opportunity. Moreover, a pre-existing cluster of 5-day pocket pivot points before a 10-day pocket pivot point provides greater conviction in the trade.
Volume Moving Averages: Set different lengths for primary and secondary moving averages to track volume trends over daily, weekly, and monthly timeframes. Options to display moving average lines on the volume chart.
Volume Visualization:
a. Major and Minor Volume Bars: Option to display bars that are either above or below average volume levels. Adjustable settings to show or hide these bars based on user preference.
b. Volume Bar Coloring: Volume bars are color-coded based on significant volume thresholds, including green for bullish signals, red for bearish signals, and orange for volume dry-ups.
Volume Metrics Table: A customizable table that displays real-time volume metrics including Relative Volume (RVOL), Turnover, and the number of high volume days. The table can be oriented horizontally or vertically and styled according to your theme preferences.
Visual Indicators:
a) Volume Dry-Up (VDU) Labels: Clearly marked VDU events with textual annotations on the chart.
b) Bullish and Bearish Arrows: Arrows indicating potential bullish or bearish closes based on volume analysis, enhancing decision-making.
Customization Options:
a) Dark and Light Theme Support: Toggle between dark and light themes to match your chart settings.
b) Adjustable Parameters: Easily configure input settings such as volume thresholds, MA lengths, and table display options to fit your trading style.
How to Use:
Set Parameters: Adjust the script settings such as volume thresholds, moving average lengths, and display preferences according to your analysis needs.
Analyze Volume Patterns: Use the indicators and visual markers provided by the script to identify significant volume patterns and potential trading signals.
Monitor Metrics: Refer to the volume metrics table for a quick overview of key volume-related statistics and trends.
Make Informed Decisions: Utilize the visual cues and volume data provided by the script to enhance your trading strategy and make more informed decisions.
Disclaimer:
This script is for informational purposes only and should not be considered as trading advice. Use it in conjunction with other analysis tools and consult with a financial advisor if needed. Trading involves risk, and past performance does not guarantee future results.

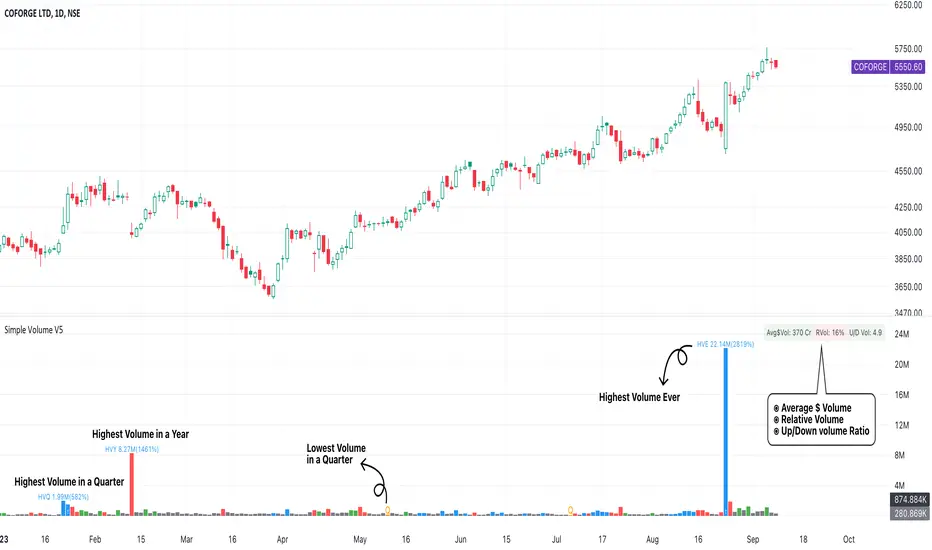
Volume ScoreVolume Score Indicator (VSCR)
The Volume Score Indicator (VSCR) is a powerful tool designed to enhance your trading analysis by evaluating volume activity relative to historical levels. This indicator provides valuable insights into volume trends, highlighting significant volume spikes and their implications for price movements.
Key Features:
1. Volume Analysis:
a.) Volume (RVol): Calculates the relative volume based on the 50-day simple
moving average.
b.) High Volume Conditions: Identifies conditions where volume is significantly higher
than historical levels, including:
b1.) Highest Volume in 1 Year (HV1Y): Volume exceeds the highest volume of
the year.
b2.) Highest Volume in 3 Months (HVQ): Volume exceeds the highest volume of
the past 3 months.
c.) Pocket Pivot Volume (PPV):
c1.) High Relative Volume: Volume is at least twice the 50-day moving average
volume.
c2.) Pocket Pivot Volume: Latest bar volume is higher than the highest down
volume bar of the last 10 days.
2.Volume Score Calculation:
a.) Computes a cumulative volume score (VSCR) based on the frequency and magnitude
of identified high-volume conditions over a user-defined look-back period (default:
90 days).
b.) Adds points to the volume score based on relative volume (RVol). For example, if
the current day's relative volume is 500% of the 50-day average volume, 5 points
will be added to the volume score.
Formula: Volume Score = Volume Score + (RVol / 100)
3. Customizable Plotting:
a.) High Volume Plotting (HV): Option to plot circles above bars when HV1Y or HVQ
conditions are met.
b.) Pocket Pivot Volume Plotting (PPV): Option to plot circles above bars when any of
the Pocket Pivot Volume conditions are met.
4.Interactive Table Display:
a.) Configurable table to display key volume metrics and scores.
b.) Customizable table layout (horizontal or vertical) and positioning (top, middle,
bottom; left, center, right).
c.) Dynamic Background Coloring: The table cells are color-coded to highlight
significant volume levels and scores:
c1.) Blue: Indicates a very high volume score or count, signaling exceptionally
strong volume activity (e.g., count >= 15, score >= 50).
c2.) Green: Represents a high but not extreme volume level, suggesting notable
volume activity (e.g., 10 <= count < 15, 40 <= score < 50).
c3.) Orange: Marks moderate volume activity, which is still above average but
less pronounced (e.g., 7 <= count < 10, 25 <= score < 40).
c4.) Red: Signifies relatively low volume activity, potentially indicating less
significant volume changes (e.g., count < 7, score < 25).
5.How to Use:
a.) Input Parameters:
a1.) Plot HV: Toggle to plot high volume i.e. HV1Y and HVQ conditions on the
chart. When enabled green plot will appear above the price bars on the
chart.
a2.) Plot PPV: Toggle to plot pocket pivot volume conditions on the chart. When
enabled orange plot will appear above the price bars on the chart.
a3.) Look Back Period: Define the period for looking back to calculate volume
conditions and scores (default: 90 days).
b.) Table Display:
b1.) Panel Options: Customize the table's position, layout, text size, and colors
to suit your preferences.
b2.) Volume Metrics: The table displays counts of high-volume events (HV1Y,
HVQ & PPV) and the cumulative volume score, color-coded based on
thresholds for easy interpretation.
c.) Practical Applications:
c1.) Volume Spike Detection: Quickly identify significant volume spikes that
may indicate institutional buying.
c2.) Historical Volume Context: Understand current volume activity in the
context of historical volume patterns.
c3.) Enhanced Decision Making: Use volume insights to make informed trading
decisions, particularly around areas of significant volume changes.
This indicator is an essential tool for traders looking to incorporate volume analysis into their trading strategy, providing clear and actionable insights into volume dynamics.
***Note***
Candlestick Exclusion: The indicator ignores any candles where the closing price is less than the opening price. All calculations and analysis are based on candles where the closing price is higher than the opening price.

Volume Candles By Anil ChawraHow Users Can Make Profit Using This Script:
1. Volume Representation : Each candle on the chart represents a specific time period (e.g., 1 minute, 1 hour, 1 day) and includes information about both price movement and trading volume during that period.
2. Candlestick Anatomy : A volume candle has the same components as a regular candlestick: the body (which represents the opening and closing prices) and the wicks or shadows (which indicate the highest and lowest prices reached during the period).
3. Volume Bars : Instead of just the candlestick itself, volume candles also include a bar or histogram representing the trading volume during that period. The height or length of the volume bar indicates the amount of trading activity.
4. Interpreting Volume : High volume candles typically indicate increased market interest or activity during that period. This could be due to significant buying or selling pressure.
5. Confirmation : Traders often look for confirmation from other technical indicators or price action to validate the significance of a high volume candle. For example, a high volume candle breaking through a key support or resistance level may signal a strong market move.
6. Trend Strength : Volume candles can provide insights into the strength of a trend. A series of high volume candles in the direction of the trend suggests strong momentum, while decreasing volume may indicate weakening momentum or a potential reversal.
7. Volume Patterns : Traders also analyze volume patterns, such as volume spikes or divergences, to identify potential trading opportunities or reversals.
8. Combination with Price Action: Volume analysis is often used in conjunction with price action analysis and other technical indicators to make more informed trading decisions.
9. Confirmation and Validation: It's important to confirm the significance of volume candles with other indicators or price action signals to avoid false signals.
10. Risk Management : As with any trading strategy, proper risk management is crucial when using volume candles to make trading decisions. Set stop-loss orders and adhere to risk management principles to protect your capital.
How the Script Works:
1. Volume Representation : Each candle on the chart represents a specific time period (e.g., 1 minute, 1 hour, 1 day) and includes information about both price movement and trading volume during that period.
2. Candlestick Anatomy : A volume candle has the same components as a regular candlestick: the body (which represents the opening and closing prices) and the wicks or shadows (which indicate the highest and lowest prices reached during the period).
3. Volume Bars : Instead of just the candlestick itself, volume candles also include a bar or histogram representing the trading volume during that period. The height or length of the volume bar indicates the amount of trading activity.
4. Interpreting Volume : High volume candles typically indicate increased market interest or activity during that period. This could be due to significant buying or selling pressure.
5. Confirmation : Traders often look for confirmation from other technical indicators or price action to validate the significance of a high volume candle. For example, a high volume candle breaking through a key support or resistance level may signal a strong market move.
6. Trend Strength : Volume candles can provide insights into the strength of a trend. A series of high volume candles in the direction of the trend suggests strong momentum, while decreasing volume may indicate weakening momentum or a potential reversal.
7. Volume Patterns : Traders also analyze volume patterns, such as volume spikes or divergences, to identify potential trading opportunities or reversals.
8. Combination with Price Action : Volume analysis is often used in conjunction with price action analysis and other technical indicators to make more informed trading decisions.
9. Confirmation and Validation : It's important to confirm the significance of volume candles with other indicators or price action signals to avoid false signals.
10. Risk Management : As with any trading strategy, proper risk management is crucial when using volume candles to make trading decisions. Set stop-loss orders and adhere to risk management principles to protect your capital.
Understanding volume candles can provide valuable insights into market dynamics and help traders make more informed decisions. However, like any technical tool, it's essential to use volume analysis in conjunction with other forms of analysis for comprehensive market assessment.
Understanding volume candles can provide valuable insights into market dynamics and help traders make more informed decisions. However, like any technical tool, it's essential to use volume analysis in conjunction with other forms of analysis for comprehensive market assessment.

Zaree - Bull & Bear Volume VoidThe "Zaree - Bull & Bear Volume Void" (BBVV) indicator is a versatile tool designed to help traders assess the dynamics of bull and bear power in the market, with a focus on volume-based analysis. This indicator offers a range of features that aid in identifying potential shifts in market sentiment and strength.
Details of the Indicator:
Volume Void Color Settings: This indicator allows you to customize the colors used for different conditions, such as strong bull areas, slowing bull areas, strong bear areas, and slowing bear areas. These colors play a crucial role in visualizing the indicator's output.
Volume Void Settings: The BBVV indicator provides options for selecting specific volume void functions, which include "Relative Volume Comparison," "Percentage of Average Volume," "Fixed Volume Threshold," "Volatility-Adjusted Volume," "Compare to Previous Volume Bars," "Volume Percentile Rank," and "Market Session Comparison." Each function has its own criteria for evaluating volume conditions.
Void Bull Sensitivity and Void Bear Sensitivity: These are key parameters in the settings. The values you choose for void bull sensitivity and void bear sensitivity will significantly impact the background color displayed by the indicator. Properly configuring these values is crucial for the indicator's effectiveness.
Moving Average Settings: You can specify the source and length of moving averages used in the indicator. This helps in smoothing out data and providing a clearer picture of bull and bear power.
Void Color Background Conditions: The indicator dynamically changes the background color of the chart based on the current market conditions. It takes into account bull and bear power, as well as the configured sensitivity levels to determine whether the market is in a strong or slowing bull/bear phase.
MACD and Signal Lines: The indicator also displays MACD and signal lines on the chart, helping traders identify potential bullish and bearish crossovers.
Histogram Bars: Histogram bars are used to represent the strength of bull and bear power. Above-zero bars indicate bullish strength, while below-zero bars indicate bearish strength.
How to Use the Indicator:
Begin by customizing the color settings for different market conditions to your preference.
Select a volume void function that aligns with your trading strategy and objectives.
Configure the void bull sensitivity and void bear sensitivity values carefully. These values should reflect your desired sensitivity to volume conditions.
Choose the source and length of moving averages based on your analysis requirements.
Pay attention to the background color of the chart. It will change dynamically based on the current market conditions, providing insights into the strength of bull and bear power.
Observe the MACD and signal lines for potential bullish or bearish crossovers, which can be used as additional confirmation signals.
Interpret the histogram bars to gauge the strength of bull and bear power.
Example of Usage:
As a swing trader with a focus on volume analysis, you can use the BBVV indicator to enhance your trading decisions. Here's an example of how you might use the indicator:
Select "Relative Volume Comparison" as the volume void function to assess volume relative to a simple moving average.
Configure void bull sensitivity and void bear sensitivity to match your risk tolerance and trading style.
Choose "SMA" as the moving average type with a suitable length.
Pay attention to the background color changes in the chart. Strong bull areas may indicate potential bullish opportunities, while strong bear areas may signal bearish conditions.
Monitor the MACD and signal lines for potential crossovers, aligning them with the background color to validate your trading decisions.
Use the histogram bars to assess the strength of bull and bear power, helping you gauge market sentiment.
Remember that the BBVV indicator is a valuable tool to complement your trading strategy. It provides insights into volume dynamics and market conditions, allowing you to make informed trading choices.
Be sure to adjust the indicator settings according to your trading preferences and always consider the broader market context in your analysis.

Volume Breakouts v2The Volume Breakouts Indicator 2.0 is a comprehensive improvement on its predecessor "Volume Breakouts" with new features and improved performance. It offers high customization options where almost every aspect can be changed to suit your preferences.
The main functionality of the indicator is to display volume that exceeds a certain level of relative volume with a specific color, and now it also differentiates between strong up and strong down days. The legacy mode from the previous version is still available, and the calculation error has been corrected in the legacy mode.
Volume Bars in their default configuration are determined by the following factors: Up and Down days, relative volume , and a strong/weak close range. The strong/weak close range is determined by marking bars with a "strong" color only if the close price is higher/weaker than 60% or 40% of the candlestick range - otherwise the color gets downgraded by one level (for example from strong green upday to medium strong blue upday). The main options for Volume Bars are the "Multipliers", where a multiplier of 1.5 represents 150% relative volume . For example, if there is an up day closing above 60% of its range and the volume is above the defined moving average threshold times the multiplier, the bar will be colored green.
(the option: "Strong/week close range" is optional and can be disabled)
Upday and multiplier 2: green
Upday and multiplier 1: blue
Downday and multiplier 2: red
Downday and multiplier 1: pink
The indicator also integrates Pocket Pivots , which are displayed as "star" icons above the current volume bar. There are two types of Pocket Pivots:
The day's volume should be larger than the highest down volume day over the prior 10 days (Rule No. 3, Chris Kacher)
If the pocket pivot occurs in an uptrend after the stock has broken out, it should act constructively around its 10-dma." The star will appear in black if the first condition is met and red if the second condition is met. (Rule No. 4, Chris Kacher)
The signal (star) will appear in black if the first condition is met and red if the second condition is met.
A new addition to the indicator is the Dashboard of different variables, which can be individually enabled or disabled. These variables include:
Actual volume: the volume of the most recent bar
Actual dollar volume: the amount of $ traded on the most recent bar
Average volume: the average volume over a defined period of time (same as moving average)
Average dollar volume: the amount of $ traded over a defined period of time (same as moving average)
Relative volume: the relative value of the current bar compared to the moving average of the volume
Up/down volume ratio: the total of the stock's volume on days when it closes up divided by the volume traded on days when the stock closed down. The assumption is that if a stock closes up for the day, the volume was buying induced and thus the stock is under accumulation
Free floating shares: Free float, also known as public float, refers to the shares of a company that can be publicly traded and are not restricted (for example held by insiders)
Rocket Ratio: Is a value (Formula: Float/AvgVolume) which measures the liquidity of the stock. A lower value means that fewer shares can move the stock fast. The default threshold is < 150
All colors can be customized, and there is also a predefined option for dark mode.

Simple Volume with Pocket PivotsThis is a minimalistic indicator that, instead of introducing more bells & whistles, strips away the conventional volume indicator from a lot of “ noise ”, and displays only 3 type of volume bars prominently:
Blue bars : Pocket Pivot Volumes (PPV), that is an up-day volume which is greater than the highest down-day volume of the last 10 down-days.
Red bars : Down-day volumes that are greater than 50-period moving average of the volume.
Green bars : Up-day volumes that are greater than 50-period moving average of the volume.
All other volumes are “ noise ” & need not be kept into any actionable consideration. All these bars are dark grey .
While initiating a long entry, we need to look out for only these 3 volume bars in this way:
RRV (recent red volumes) are indicative of unconsumed supply. Either the highs of those red days be taken out, or these RRVs be suceeded later by higher RGV (recent green volumes) . Pocket Pivot Volumes (PPV) are the best indicator of institutional accumulation. Multiple PPVs in a consolidation base, & in a breakout candle are very bullish signals.
Please also note that moving average of the volume is also purposely hidden, as the dark grey bars themselves are indication of a below-average volume. Rather than looking at each bar & comparing it to the overlying moving average line, the color scheme itself is self-explanatory, & devoid of distractions.
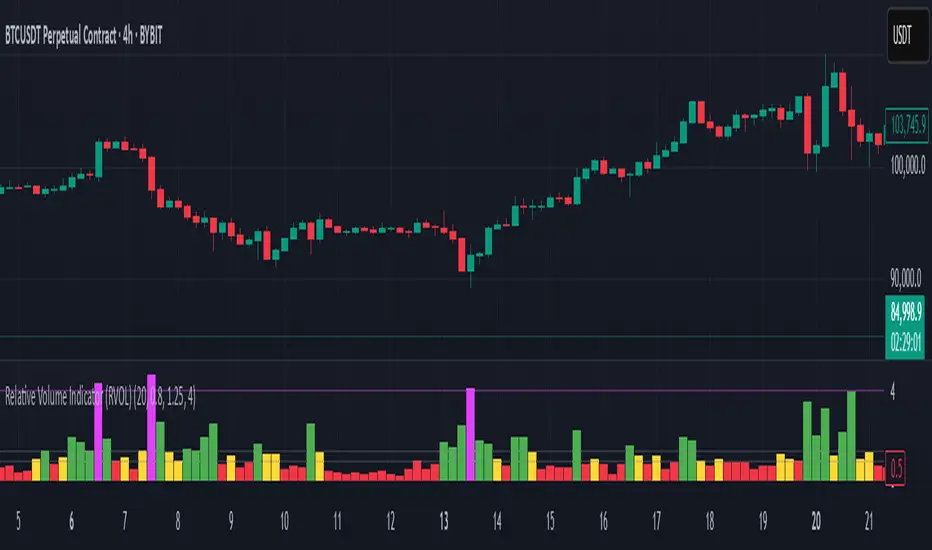
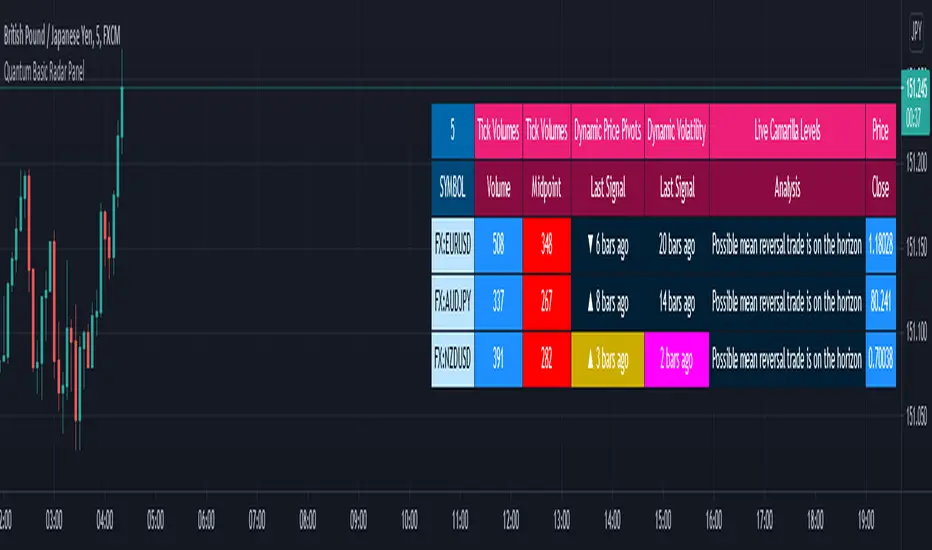
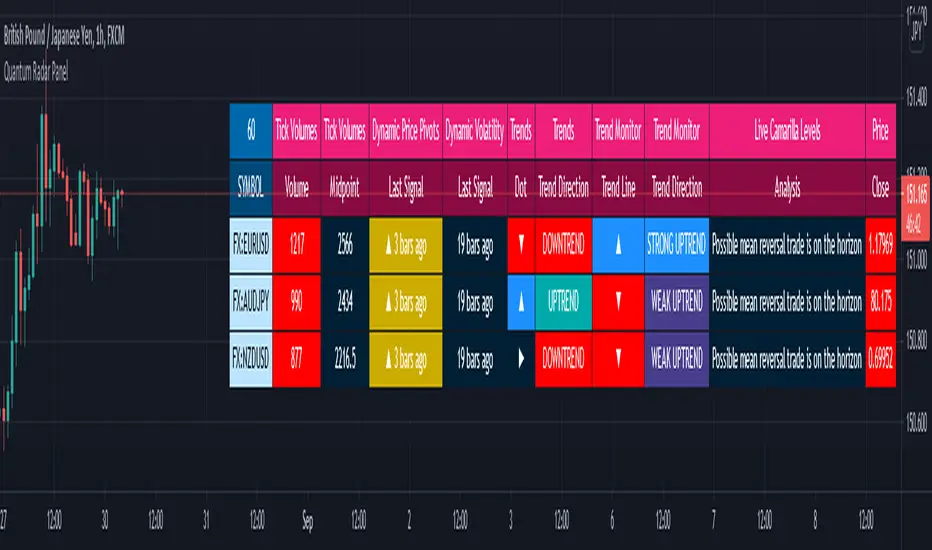
Quantum Basic Radar PanelOverview
One of the biggest issues trading any market is in keeping track of trading opportunities as they arise across all the various timeframes without having multiple monitors or charts open and this is where the Radar Panel steps in. Using TradingView’s Table function, we have incorporated a host of our leading indicators on the panel which can be applied to any timeframe and from which you can instantly spot opportunities as they arise whether in terms of trend, reversals, volatility, or volume. In addition, when using a scanner such as this, it also highlights broad sentiment if, for example, you have added currency pairs from the same matrix or a group of stocks from the same sector. And you can of course have multiples open across the various timeframes.
The Quantum Radar Panel is a powerful indicator that keeps track of indicator signals of up to 10 different symbols in real time. For each symbol, it can display the current signals of 4 Quantum Trading indicators namely:
Quantum Tick Volumes
Quantum Dynamic Price Pivots
Quantum Dynamic Volatility
Quantum Live Camarilla Levels
It can also display the current Open, High, Low, and Close prices of each symbol. Each indicator has 1 or more columns allotted to them to display information about their respective signals. Below we will discuss what each indicator does and how it displays its signals in the Radar Panel.
Tick Volumes
Volume is a powerful leading indicator, yet few traders ever take advantage of its awesome power. Why? Because identifying volume trends using the standard indicator can be confusing, and judging volume height even more so!
The Quantum Tick Volumes indicator takes a simple tool and makes it come to life! First, it paints the volume bar to match the candle. This makes it quick and easy to identify buying and selling volume with the associated price action.
Second, the Quantum Tick Volume indicator displays a dynamic mid-point, instantly telling you whether volumes are high, average or low in the session. No more guesswork! Volume analysis made simple – making it easy to spot profitable trading opportunities – fast!
In the Radar Panel, the Tick Volumes indicator displays 2 columns -Volume and Midpoint.
Columns
Volume – this column displays the current volume of the symbol and changes colors according to the sentiment of the current candle.
Midpoint – this column displays half of the highest volume bar within the current day and it is visible in intraday timeframes only
Dynamic Price Pivots
The Quantum Dynamic Price Pivots indicator could best be described as the Swiss army knife of trading. Power, simplicity and functionality all in one tool. Many traders struggle to identify reversal points based on price action alone. Why? Because you need to have a complete understanding of candlesticks, candles and candle patterns.
The dynamic pivot appears once a three-candle price pattern is created. This is one of the first signs of a possible change in sentiment, based on the price action alone. A pivot high in an uptrend, and pivot low in a down trend. So, whether you are trading long or short, the Quantum Dynamic Price Pivots indicator will instantly give you a visual signal to – pay attention! Powerful, yet so simple, and two indicators in one!
In the Radar Panel, the Dynamic Price Pivots indicator displays the last signal (isolated high or isolated low) and the number of bars since it was last seen.
Column
Last Signal – this column displays the last pivot arrow that appeared in the chart in the form of an upward (isolated low) or downward (isolated high) arrow and the number of bars since it was detected. The cell turns yellow when the arrow is seen in the last 3 bars or less.
Dynamic Volatility
Volatility can be both good and bad. Great for making money fast. Not so good when you’re on the losing side! But how do you know when a market is volatile. Is the price action you are seeing normal for that currency pair? And more importantly, what is normal?
The Quantum Dynamic Volatility indicator is designed with one objective in mind. To show you, dynamically volatile price action. You then decide, based on the price action, whether to wait, or take advantage. One of the hardest things to learn in trading, is when to stay out. The Quantum Dynamic Volatility indicator makes this child’s play – keep you safe. It could almost be called your safety belt!
In the Radar Panel, the Dynamic Volatility indicator displays the number of bars since a volatile candle was last seen.
Column
Last Signal – this column displays the number of bars since a volatile candle was detected. The cell turns magenta when the signal is seen in the last 3 bars or less.
Live Camarilla Levels
What is the Camarilla protocol, how does it work and what will it do for me?
Put simply it is a chameleon of an indicator and will appeal whether you are a more discretionary type of trader, making and taking decisions yourself, or if you prefer a more systematic or mechanical approach often associated with an EA for example. With the Camarilla levels indicator both approaches can be embraced and accommodated.
The Camarilla protocol has its roots in the open outcry trading pits, where traders considered floor pivots an essential tool. Based on these original ideas and incorporating the Camarilla equation we have developed a unique indicator which delivers clear and precise price-based support and resistance levels, which act as targets for profits, triggers for potential reversals, signals for possible breakouts, and finally stop loss placement. So, if you’re a swing or reversal trader, it’s the perfect indicator. Equally if you prefer breakout trading, again it’s the perfect indicator. And all with predetermined and clear levels for any price objectives and profit targets, with stop loss placement covered also.
In other words, a complete indicator, and one which is delivered with potential trading setups built in to help you see when key levels are being approached or breached. And to help you further when using the indicator, we have also included some simple messages to guide you as the various levels are approached and tested.
In the Radar Panel, the Live Camarilla Levels indicator displays the 12 Camarilla levels in descending order, R6 to R1 and S1 to S6, as well as the Analysis based on where the current price is situated among the 12 levels.
Columns
Analysis – this column displays messages that can guide you as the various levels are approached and tested.
R6 – R1, S1 – S6 (12 columns) – these columns display the 12 Camarilla levels calculated for the current timeframe and each one changes colors depending on the current price
OHLC Prices
Apart from the 4 Quantum indicators, the Radar Panel also displays the current OHLC prices of each symbol.
Open
High
Low
Close
Their color changes depending on the current price action.
With the portability of the TradingView platform, having the Radar Panel in your set of tools truly puts all the power of 4 Quantum indicators right at your fingertips. Get yours now.
Quantum Radar PanelOverview
One of the biggest issues trading any market is in keeping track of trading opportunities as they arise across all the various timeframes without having multiple monitors or charts open and this is where the Radar Panel steps in. Using TradingView’s Table function, we have incorporated a host of our leading indicators on the panel which can be applied to any timeframe and from which you can instantly spot opportunities as they arise whether in terms of trend, reversals, volatility, or volume. In addition, when using a scanner such as this, it also highlights broad sentiment if, for example, you have added currency pairs from the same matrix or a group of stocks from the same sector. And you can of course have multiples open across the various timeframes.
The Quantum Radar Panel is a powerful indicator that keeps track of indicator signals of up to 10 different symbols in real time. For each symbol, it can display the current signals of 6 Quantum Trading indicators namely:
Quantum Tick Volumes
Quantum Dynamic Price Pivots
Quantum Dynamic Volatility
Quantum Trends
Quantum Trend Monitor
Quantum Live Camarilla Levels
It can also display the current Open, High, Low, and Close prices of each symbol. Each indicator has 1 or more columns allotted to them to display information about their respective signals. Below we will discuss what each indicator does and how it displays its signals in the Radar Panel.
Tick Volumes
Volume is a powerful leading indicator, yet few traders ever take advantage of its awesome power. Why? Because identifying volume trends using the standard indicator can be confusing, and judging volume height even more so!
The Quantum Tick Volumes indicator takes a simple tool and makes it come to life! First, it paints the volume bar to match the candle. This makes it quick and easy to identify buying and selling volume with the associated price action.
Second, the Quantum Tick Volume indicator displays a dynamic mid-point, instantly telling you whether volumes are high, average or low in the session. No more guesswork! Volume analysis made simple – making it easy to spot profitable trading opportunities – fast!
In the Radar Panel, the Tick Volumes indicator displays 2 columns -Volume and Midpoint.
Columns
Volume– this column displays the current volume of the symbol and changes colors according to the sentiment of the current candle.
Midpoint – this column displays half of the highest volume bar within the current day and it is visible in intraday timeframes only
Dynamic Price Pivots
The Quantum Dynamic Price Pivots indicator could best be described as the Swiss army knife of trading. Power, simplicity and functionality all in one tool. Many traders struggle to identify reversal points based on price action alone. Why? Because you need to have a complete understanding of candlesticks, candles and candle patterns.
The dynamic pivot appears once a three-candle price pattern is created. This is one of the first signs of a possible change in sentiment, based on the price action alone. A pivot high in an uptrend, and pivot low in a down trend. So, whether you are trading long or short, the Quantum Dynamic Price Pivots indicator will instantly give you a visual signal to – pay attention! Powerful, yet so simple, and two indicators in one!
In the Radar Panel, the Dynamic Price Pivots indicator displays the last signal (isolated high or isolated low) and the number of bars since it was last seen.
Column
Last Signal – this column displays the last pivot arrow that appeared in the chart in the form of an upward (isolated low) or downward (isolated high) arrow and the number of bars since it was detected. The cell turns yellow when the arrow is seen in the last 3 bars or less.
Dynamic Volatility
Volatility can be both good and bad. Great for making money fast. Not so good when you’re on the losing side! But how do you know when a market is volatile. Is the price action you are seeing normal for that currency pair? And more importantly, what is normal?
The Quantum Dynamic Volatility indicator is designed with one objective in mind. To show you, dynamically volatile price action. You then decide, based on the price action, whether to wait, or take advantage. One of the hardest things to learn in trading, is when to stay out. The Quantum Dynamic Volatility indicator makes this child’s play – keep you safe. It could almost be called your safety belt!
In the Radar Panel, the Dynamic Volatility indicator displays the number of bars since a volatile candle was last seen.
Column
Last Signal – this column displays the number of bars since a volatile candle was detected. The cell turns magenta when the signal is seen in the last 3 bars or less.
Trends
All traders know that price is a leading indicator. Yet few traders ever discover how to correctly interpret the start of a new trend, or indeed the end of an old one. To add further complexity, markets spend over 70% of their time in congestion, moving sideways in a narrow range. The traders worst enemy.
What’s the answer? Step forward – the Quantum Trends indicator. With this simple and elegant indicator, dynamic trends are painted for you instantly and dynamically, in real time. In trading any market, you need to be quick on your feet, and the Quantum Trends indicator delivers in spades! But even better, not only will it signal your possible entry and exit, but it also signals a market in congestion – equally important. Knowing when to stay out, is just as important as knowing when to get in.
In the Radar Panel, the Trends indicator displays where the last trend dot is heading and the sentiment of the dot or the trend direction.
Columns
Dot – this column displays whether the current trend dot is going upwards, downwards, or sideways
Trend Direction – this column displays the sentiment of the current trend dot and its color
Trend Monitor
One of the hardest things to do in trading, is to stay in, and take the maximum profit from any position. You know how it goes. You get in and all is going well. Then the market reverses. You get frightened, and close out. What happens next?
Yes, you guessed it – the market reverses again and starts to move fast. Now it’s too late. You have missed out on some great profits, and are left wishing you had stayed in.
That’s why we developed the Quantum Trend Monitor. It does just that. It monitors the strength of the trend. It will help you stay in, when your emotion is telling you to get out. The Trend Monitor will give you the confidence, not just to stay in, but to take the maximum profit from each and every trade.
In the Radar Panel, the Trend Monitor indicator displays where the trend line (one of Trend Monitor’s 2 modes) is heading at and the current sentiment or trend direction.
Columns
Trend Line – in the indicator proper, the trend line shows the progression or steepness of the trend’s momentum, and this information is simplified as the direction of the line, whether it is going upwards, downwards, or sideways.
Trend Direction – this column displays the current sentiment and its color
Live Camarilla Levels
What is the Camarilla protocol, how does it work and what will it do for me?
Put simply it is a chameleon of an indicator and will appeal whether you are a more discretionary type of trader, making and taking decisions yourself, or if you prefer a more systematic or mechanical approach often associated with an EA for example. With the Camarilla levels indicator both approaches can be embraced and accommodated.
The Camarilla protocol has its roots in the open outcry trading pits, where traders considered floor pivots an essential tool. Based on these original ideas and incorporating the Camarilla equation we have developed a unique indicator which delivers clear and precise price-based support and resistance levels, which act as targets for profits, triggers for potential reversals, signals for possible breakouts, and finally stop loss placement. So, if you’re a swing or reversal trader, it’s the perfect indicator. Equally if you prefer breakout trading, again it’s the perfect indicator. And all with predetermined and clear levels for any price objectives and profit targets, with stop loss placement covered also.
In other words, a complete indicator, and one which is delivered with potential trading setups built in to help you see when key levels are being approached or breached. And to help you further when using the indicator, we have also included some simple messages to guide you as the various levels are approached and tested.
In the Radar Panel, the Live Camarilla Levels indicator displays the 12 Camarilla levels in descending order, R6 to R1 and S1 to S6, as well as the Analysis based on where the current price is situated among the 12 levels.
Columns
Analysis – this column displays messages that can guide you as the various levels are approached and tested.
R6 – R1, S1 – S6 (12 columns) – these columns display the 12 Camarilla levels calculated for the current timeframe and each one changes colors depending on the current price
OHLC Prices
Apart from the 6 Quantum indicators, the Radar Panel also displays the current OHLC prices of each symbol.
Open
High
Low
Close
Their color changes depending on the current price action.
With the portability of the TradingView platform, having the Radar Panel in your set of tools truly puts all the power of 6 Quantum indicators right at your fingertips. Get yours now.
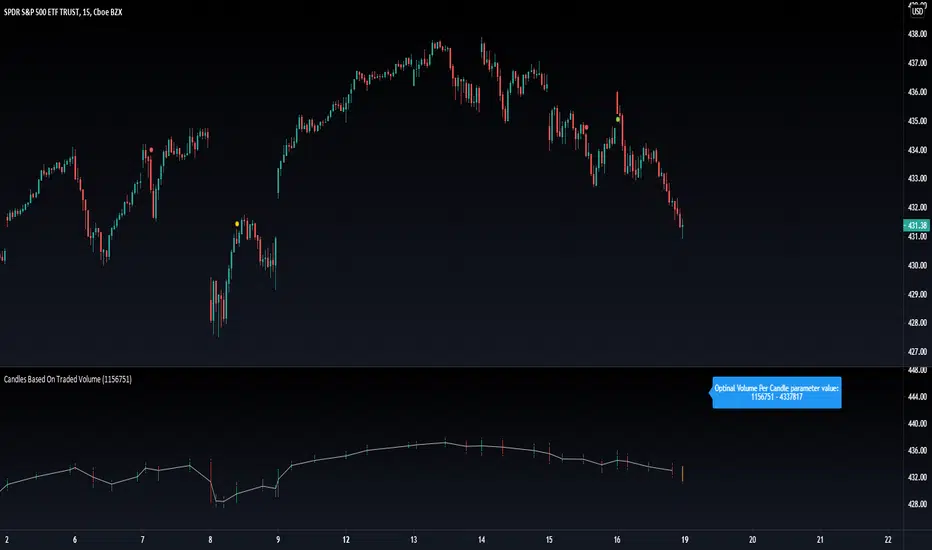
Candles Based On Traded VolumeCBTV - Candlesticks Based on Traded Volume
This is the first robust implementation of volume based candlesticks (bars) on TradingView. This type of bar was describe in the book "Advances in Financial Machine Learning," written by Lopez de Prado, a well-known quant who has managed billions of dollars over the course of his career.
Volume Candlesticks (Bars) are bars that are indexed by total volume, with each set of N shares exchanged forming a separate bar.
This means that on CBTV chart a candle forms not after a specific time interval defined by the time frame of the chart, but when a determined volume was traded.
This approach to price sampling is much better than the time based one, because it does not oversample periods where nothing happens. Traditional candlestick charts show a lot of low volume bars without meaningful price changes in them.
The efficient price sampling results in better results when using volume based bars in machine learning forecasting models. They are also useful for technical analysis. Candlestick patterns on CBTV chart are more pronounced and have more predictive power.
Volume based bars can be constructed only for instruments where volume data is available. These are stocks, futures and crypto currencies.
When you run CBTV it appears in a separate window below the traditional time based chart.
CBTV will be used in pair with a helper indicator which is called Optimal Volume per Candle (OVPC).
When applied to a chart OVPC shows the optimal range for volume per candle to construct volume based candlesticks from this timeframe data. It appears in the blue box above the most recent candle of a standard time based chart.
When you set a Volume Per Candle parameter in CBTV make sure it is within the range that shows OVPC. In this case volume based chart will be easy to read and all the calculations will be performed with the high level of precision.
The most recent unfinished candle is marked with the different set of colors than historical candles. Unfinished candle is colored in orange if it is a falling candle, blue it it is a rising one.
If you leave the CBTV chart opened for a long time you can have multiple blue or orange candles on it. In this case press the “hide” icon with the eye sign twice (it’s on the left side of the indicator panel next to its input parameters). This will refresh the CBTV and remove the artifacts.
While everything comes Real-time you will see the orange or blue bars form but never update. All you need to do is REFRESH THE CHART. Hoping soon to update this with a version you wont have to refresh the chart.
Please drop a like and comment what you guys think and once again thank you Tradingview for such a great platform :)
BK AK-FVG/SR Institutional⚔️ BK AK-FVG/SR Institutional — Smart Money Gaps. True Support/Resistance. ⚔️
There are already some excellent FVG tools out there—built by traders who’ve put in real work studying imbalance, liquidity, and smart money behavior.
BK AK-FVG/SR Institutional is simply my version of that idea: my attempt to take what I learned from those great frameworks and push it further into volume, structure, lifecycle, and accountability—so every zone is treated as a living, graded object, not just a static box on a chart.
This is my 12th script release—and that number matters to me. Twelve is structure: twelve tribes, twelve months, twelve divisions of ordered space. It’s the number of complete arrangement. So for script twelve, I’m releasing what I consider my institutional map—a tool built specifically around boundaries, alignment, and where real money chooses to defend and attack.
This script is invite-only. Access is controlled. It’s built for traders who actually respect structure, not tourists looking for colors on a chart.
“AK” in the name is not branding—it’s honor. It belongs to my mentor A.K., whose standard of discipline and clarity sits behind every decision in this tool. Above that, all glory and gratitude to Gd—the real source of any wisdom, edge, or endurance we have in this game.
🧠 What BK AK-FVG/SR Institutional Actually Does
This is a full institutional FVG/SR system, not a paintbrush. It:
Detects and manages bullish & bearish FVG zones using ATR/percent filters and aging logic
Assigns a 0–100 institutional strength score and 1–5★ rating to every zone
Builds a per-zone lower-timeframe volume profile with POC, volume delta, and optional volume text
Tracks historical touches, breaks, role reversals, merging, clustering, and divergence at the zone
Runs per-zone backtest stats and feeds that into an adaptive/ML-style confidence weight
Compresses the whole environment into a real-time Info Table: bias, market position, nearest S/R, risk, session
Fires alerts only when something actually matters: strong FVGs, magnetic pull, divergence at a level
If price is the map, this is the layer that tells you which levels are real and which are noise.
🧱 Core Engine — Institutional Zone Logic
Smart FVG Detection
Clean 3-bar gap logic for bullish & bearish FVGs
ATR or % based minimum gap size + optional distance filter from price
Zone aging with max life in bars and optional “reset on touch”
Overlap & proximity control:
Prevent overlapping zones
Enforce minimum bar spacing
Or keep only the strongest zone in a cluster
Institutional Strength & Rating
Each zone gets a score (0–100) + star rating (1–5★) based on:
Volume vs average (with optional lower timeframe split)
Gap size vs ATR
Pivot confluence
Historical meaningful touches
Role reversal (support ↔ resistance)
MTF FVG alignment
Session weighting (Asian / London / NY / overlaps)
Order block overlap & imbalance behavior
VWAP proximity/extremes
Fib level alignment
Delta divergence
Zone clustering & consolidation
Adaptive “performance weight” from historical reactions
Bad zones don’t just look weaker—they literally get filtered out when you enable minimum star / institutional filters.
📊 In-Zone Volume & Profile Intelligence
Each zone can be backed by lower-timeframe volume:
Per-zone volume histogram inside the gap
POC line at the most traded price in that zone
Optional total volume label
POC line color shifts with volume delta (buy vs sell pressure)
Additional bull/bear volume bars alongside the zone and/or numeric volume text inside the box
You’re not just staring at a gap—you’re seeing the liquidity pocket inside the gap.
🎯 Structure, Confluence & Role Reversal
The engine includes deep structural context:
Pivots: stored swing highs/lows for S/R confluence
MTF FVG Confluence: two extra timeframes for higher-timeframe alignment
Fibonacci Levels: auto-mapped 0.236 / 0.382 / 0.5 / 0.618 / 0.786 with optional lines & labels
Order Blocks & Imbalance: engulfing OB detection + volume/imbalance filters
VWAP Intelligence: VWAP proximity/extreme bonuses, optional short-form plotting
Delta Divergence: volume-based confirmation flags for zones under real internal pressure
Smart S/R Positioning & Role Flip
Hide “wrong side” zones or auto-flip roles when broken & retested
Track broken zones for N bars, then retire them
Mark role reversals with badges and strength bonuses
Support/resistance is treated like behavior, not just lines.
🤖 Adaptive Learning & Backtesting
Each zone is monitored when price touches it:
Checks if price respects the zone and moves X points away (success)
Or violates beyond failure threshold (failure)
Tracks successes, failures, and win rate per zone
Feeds a confidence score into an adaptive weight so consistently performing zones matter more
Zones that meet the bar get ML/🤖 marking when enabled
The script doesn’t just say “this looks strong”—it tracks how it actually behaved.
📋 Info Table & Sessions — On-Chart War Room
On the latest bar, an Info Table summarizes:
Zone count (bull vs bear)
Market position (NEAR SUPPORT / NEAR RESISTANCE / ABOVE RESISTANCE / BELOW SUPPORT / NEUTRAL)
Nearest S/R levels
Trade bias (BULLISH / BEARISH / NEUTRAL)
Active session (ASIAN / LONDON / NY / OVERLAP / OFF)
Risk level (LOW / MED / HIGH)
Sessions are coded in EST with multipliers so you can weight London/NY more heavily than Asia if that matches your playbook.
Hover the table for a strategy tooltip: live market posture, suggested behavior near the zones, and context around the current environment.
⚠ Divergence & Alerts
Real-time RSI/OBV/ADX divergence detection at the zone
Flexible visual modes: border, icon, color change, or combinations
Alerts included:
Magnetic Zone Pull (price entering ATR-based “field” of a strong zone)
Strong Bullish FVG
Strong Bearish FVG
Divergence at Zone
Let the chart call you when a real decision point appears, instead of forcing you to stare all day.
🕹 How to Use BK AK-FVG/SR Institutional
1️⃣ Build Bias With Structure
Use the Info Table, star ratings, and where the 4–5★ zones cluster relative to price to decide which side of the tape you’re allowed to trade on.
2️⃣ Only Trade From Strong, Aligned Zones
Focus on 4–5★ zones with confluence (pivots, Fib, OB, VWAP, clustering).
Use the zone body/wick region as your execution area, not some random mid-air candle.
3️⃣ Treat Role Reversal & Clusters as Campaign Nodes
When a strong zone breaks, flips role, and collects touches, that’s campaign territory—not scalp noise.
4️⃣ Use Divergence/Delta as a Brake, Not a Toy
If divergence lights up at your level, respect it: size down, wait for confirmation, or stand down.
5️⃣ Let the Engine Filter Junk For You
Tune volMultiplier, star thresholds, session multipliers, distance filters, and min star rating to match your timeframe and instrument.
This script’s job is to remove your excuse for taking low-quality trades.
📜 Boundaries & Wisdom
King Solomon wrote:
“Do not remove the ancient boundary stone that your fathers have set.”
This tool is built around that idea. It maps where the real boundaries live—where smart money defends, attacks, traps, and reverses.
It will not give you discipline. It will simply remove the illusion that “you didn’t know the level was there.”
🔒 Access & Usage
This is an invite-only TradingView script.
Access is granted at my discretion to traders who take structure, risk, and discipline seriously.
⚔️ BK AK-FVG/SR Institutional — Map the Smart Money Gaps. Trade Only the Real Levels.
May Gd bless your vision, your patience, and every decision you make at the edge. 🙏

mrD-Volume Profile HeatmapThis indicator combines advanced volume analysis with institutional-grade visualization techniques to provide traders with a comprehensive view of market structure and liquidity zones.
WHAT MAKES THIS UNIQUE:
• Proprietary bidirectional volume profiling algorithm that separates buying and selling pressure using VWAP deviation analysis, not standard volume bars
• Custom heatmap visualization engine with adaptive gradient calculation based on volume-weighted price distribution across multiple timeframes
• Integrated Weekly VWAP with hlc3 weighting for institutional reference levels
• Dynamic POC (Point of Control) detection with fixed-height text boxes for clarity
• Optimized rendering system that handles 500+ bars efficiently without lag
HOW IT WORKS:
The algorithm analyzes volume distribution at each price level within the lookback period, applying a proprietary weighting system that considers:
1. Volume-weighted average price (VWAP) deviation to classify volume as bullish/bearish
2. Price levels are binned into customizable rows (bins) for granular analysis
3. Volume bars extend bidirectionally: positive volume (green) extends left, negative volume (red) extends right
4. Heatmap overlay uses multi-level gradient mapping (6-color spectrum) to highlight high volume nodes
5. Weekly VWAP provides macro trend reference with session-based reset logic
VOLUME PROFILE MECHANICS:
• Calculates volume distribution across price levels using a grid-based binning system
• Each bin accumulates volume when the price touches that level
• Positive/negative classification based on VWAP position (above = bullish, below = bearish)
• POC automatically identifies the price level with maximum volume concentration
• Display shows volume intensity through color gradients and bar lengths
HEATMAP VISUALIZATION:
• Uses exponential gradient multiplier (default 1.9) for enhanced contrast
• Color transitions: Dark Blue (low volume) → Cyan → Green → Yellow (high volume)
• Transparency-adjusted overlays ensure chart readability
• Real-time updates as new volume data arrives
WEEKLY VWAP INTEGRATION:
• Resets at the start of each trading week (request.security logic)
• Uses hlc3 (typical price) as the volume-weighted source
• Provides institutional reference level for swing traders
• Yellow color (#FFEB3B) for easy identification
KEY PARAMETERS:
• Period: Lookback window for volume calculations (default: 500 bars)
• Bins: Number of price levels for volume distribution (default: 150 rows)
• Offset: Horizontal positioning of volume bars (default: 50)
• Heatmap Rows: Granularity of heatmap overlay (default: 250)
• POC displays actual volume numbers for transparency
TRADING APPLICATIONS:
→ Identify high-volume nodes as support/resistance zones
→ Detect liquidity clusters where institutional orders concentrate
→ Spot low-volume areas where price may move quickly (thin zones)
→ Use bidirectional volume to assess buying vs selling pressure
→ Combine with Weekly VWAP for multi-timeframe confluence
→ POC levels often act as price magnets (mean reversion targets)
TECHNICAL IMPLEMENTATION NOTES:
• Optimized for intraday to swing timeframes (1m to Daily charts)
• Volume calculations use session-based accumulation (no future data)
• Box rendering is limited to 500 objects for performance
• Gradient calculations use mathematical power functions for smooth transitions
• VWAP calculation follows institutional standard (volume-weighted hlc3)
RESTRICTIONS:
This is a proprietary algorithm. Redistribution, modification, or commercial use is strictly prohibited. The logic and methods contained herein are confidential and protected intellectual property.
═══════════════════════════════════════════
DISCLAIMER & RISK WARNING
This indicator is provided solely for educational and informational purposes. It is designed to help traders understand market structure, volume distribution, and price action analysis. This tool should be used as part of a comprehensive trading education program.
NOT FINANCIAL ADVICE:
The information and signals provided by this indicator DO NOT constitute financial advice, investment advice, trading advice, or any other sort of advice. You should not treat any of the indicators' content, outputs, or signals as such. Nothing contained in this indicator constitutes a solicitation, recommendation, endorsement, or offer to buy or sell any securities or other financial instruments in this or in any other jurisdiction.
NO GUARANTEED RESULTS:
Past performance is NOT indicative of future results. The historical backtesting results, volume patterns, and statistical data shown by this indicator do not guarantee future performance or success. Market conditions change constantly, and what worked in the past may not work in the future. Trading and investing involve substantial risk of loss.
MARKET VOLATILITY:
Financial markets are inherently volatile and unpredictable. Volume patterns, support/resistance levels, and other technical indicators can fail at any time. No indicator can predict market movements with certainty. Always use proper risk management and position sizing.
By using this indicator, you acknowledge that you have read, understood, and agree to this disclaimer in its entirety. If you do not agree with any part of this disclaimer, you should not use this indicator.

Volume Mood Bars Volume Mood Bars — Saël edition v3.2
A lightweight volume-based bar-coloring system that highlights how each bar behaves rather than how it looks.
It reveals the internal “mood” of the bar: strength, weakness, transitions, and fading momentum — all directly from volume dynamics.
The tool is intentionally minimalistic: no clutter, no overlays, only the essential price–volume relationship presented through clean color logic.
Works on any market and timeframe.
Key Features
• projected final volume on the current bar
• smooth color transitions based on bar progress
• immediate recognition of strong/weak volume bars
• compact and intuitive visual design
Perfect Pairing with Pythia
Volume Mood Bars complement Pythia exceptionally well:
they expose volume-based bar strength while Pythia tracks structural momentum decay.
Together, they provide a clear and reliable read of internal market pressure.

Advanced Smart Trading Suite with OTE═══════════════════════════════════════
ADVANCED SMART TRADING SUITE WITH OPTIMAL TRADE ENTRY
═══════════════════════════════════════
A comprehensive institutional trading system combining multiple advanced concepts including multi-timeframe liquidity analysis, order blocks, fair value gaps, and optimal trade entry zones. Features optional anti-repainting controls for confirmed signal generation.
───────────────────────────────────────
WHAT THIS INDICATOR DOES
───────────────────────────────────────
This all-in-one trading suite provides:
- Multi-Timeframe Liquidity Detection - HTF (Higher Timeframe), LTF (Lower Timeframe), and current timeframe liquidity sweep identification
- Order Blocks - Institutional accumulation/distribution zones with enhanced detection
- Fair Value Gaps (FVG) - Price imbalance detection
- Inverse Fair Value Gaps (iFVG) - Counter-trend imbalance zones
- Optimal Trade Entry (OTE) Zones - Fibonacci retracement-based entry zones (0.618-0.786)
- Trading Sessions - Asian, London, and New York session visualization
- Anti-Repainting Controls - Optional confirmed signals with adjustable confirmation bars
- Comprehensive Alert System - Notifications for all major events
───────────────────────────────────────
HOW IT WORKS
───────────────────────────────────────
ANTI-REPAINTING SYSTEM:
This indicator includes optional anti-repainting controls that fundamentally change how signals are generated:
Confirmed Mode (Recommended):
- Signals wait for confirmation bars before appearing
- No repainting - what you see is final
- Adjustable confirmation period (1-5 bars)
- Slight lag in signal generation
- Better for backtesting and systematic trading
Live Mode:
- Signals appear immediately as patterns develop
- May repaint as new bars form
- Faster signal generation
- Better for discretionary real-time trading
The confirmation system affects all features: liquidity sweeps, order blocks, FVGs, and OTE zones.
LIQUIDITY SWEEP DETECTION:
Three-Tier System:
1. Current Timeframe Liquidity:
- Detects swing highs/lows on chart timeframe
- Configurable lookback and confirmation periods
- Session-tagged for context (Asian/London/NY)
2. HTF (Higher Timeframe) Key Liquidity:
- Default: 4H timeframe (configurable to Daily/Weekly)
- Strength-based filtering using ATR multipliers
- Distance-based clustering prevention
- Only strongest levels displayed (top 1-10)
- Labels show timeframe and strength rating
3. LTF (Lower Timeframe) Key Liquidity:
- Default: 1H timeframe (configurable)
- Precision entry/exit levels
- Strength-based ranking
- Distance filtering to avoid clutter
Sweep Detection Methods:
- Wick Break: Any wick beyond the level
- Close Break: Close price beyond the level
- Full Retrace: Break and close back inside (stop hunt detection)
Buffer System:
- Configurable ATR-based buffer for sweep confirmation
- Prevents false positives from minor price fluctuations
ORDER BLOCKS (Enhanced):
Detection Methodology:
- Identifies the last opposing candle before significant structure break
- Bullish OB: Last red candle before bullish break
- Bearish OB: Last green candle before bearish break
Enhanced Filters:
1. Size Filter:
- Minimum order block size (ATR-based)
- Ensures significant zones only
2. Volume Filter:
- Requires above-average volume (configurable multiplier)
- Confirms institutional participation
3. Imbalance Filter:
- Requires strong directional move after OB formation
- Validates true institutional activity
Violation Detection:
- Wick-based: Any wick through the zone
- Close-based: Close price through the zone
- Automatic removal of broken order blocks
FAIR VALUE GAPS (FVG):
Bullish FVG: Gap between candle 3 low and candle 1 high (three-bar pattern)
Bearish FVG: Gap between candle 3 high and candle 1 low
Requirements:
- Minimum gap size (ATR-based)
- Clear price imbalance
- No overlap between the three candles
Fill Detection:
- Configurable fill threshold (default 50%)
- Tracks partial and complete fills
- Removes filled gaps to keep chart clean
INVERSE FAIR VALUE GAPS (iFVG):
What are iFVGs:
- Counter-trend FVGs that form after original FVG is filled
- Indicate potential reversal or continuation failure
- Form within specific timeframe after original FVG
Detection Rules:
- Must occur after a FVG is filled
- Must form within 20 bars of original FVG
- Minimum size requirement (ATR-based)
- Opposite direction to original FVG
Visual Distinction:
- Dashed border boxes
- Different color scheme from regular FVGs
- Combined labels when FVG and iFVG overlap
OPTIMAL TRADE ENTRY (OTE) ZONES:
Based on Fibonacci retracement principles used by institutional traders:
Concept:
After a structure break (swing high/low violation), price often retraces to specific Fibonacci levels before continuing. The OTE zone (0.618 to 0.786) represents the optimal entry area.
Bullish OTE Formation:
1. Swing low is formed
2. Structure breaks above previous swing high (bullish structure break)
3. Price retraces into 0.618-0.786 Fibonacci zone
4. Entry signal when price enters and holds in OTE zone
Bearish OTE Formation:
1. Swing high is formed
2. Structure breaks below previous swing low (bearish structure break)
3. Price retraces into 0.618-0.786 Fibonacci zone
4. Entry signal when price enters and holds in OTE zone
Key Fibonacci Levels:
- 0.618 (Golden ratio - primary target)
- 0.705 (Square root of 0.5 - institutional level)
- 0.786 (Square root of 0.618 - deep retracement)
Structure Break Requirement:
- Optional setting to require confirmed structure break
- Prevents premature OTE zone identification
- Ensures proper swing structure is established
Entry/Exit Tracking:
- Green checkmark: Price entered OTE zone validly
- Red X: Price exited OTE zone (stop or target)
- Real-time status monitoring
TRADING SESSIONS:
Displays three major trading sessions with full customization:
Asian Session (Tokyo + Sydney):
- Default: 01:00-13:00 UTC+4
- Typically lower volatility
- Sets up key levels for London open
London Session:
- Default: 11:00-20:00 UTC+4
- Highest liquidity period
- Major institutional moves
New York Session:
- Default: 16:00-01:00 UTC+4
- US market hours
- High impact news events
Features:
- Real-time status indicators (🟢 Open / 🔴 Closed)
- Session high/low tracking
- Overlap detection and highlighting
- Historical session display (0-30 days)
- Customizable colors and borders
───────────────────────────────────────
HOW TO USE
───────────────────────────────────────
MASTER CONTROLS:
Enable/disable major features independently:
- Trading Sessions
- Liquidity Sweeps (Current TF)
- HTF Liquidity Sweeps
- LTF Liquidity Sweeps
- Order Blocks
- Fair Value Gaps
- Inverse Fair Value Gaps
- Optimal Trade Entry Zones
ANTI-REPAINTING SETUP:
For Backtesting/Systematic Trading:
1. Enable "Use Confirmed Signals"
2. Set Confirmation Bars to 2-3
3. All signals will wait for confirmation
4. No repainting will occur
For Real-Time Discretionary Trading:
1. Disable "Use Confirmed Signals"
2. Signals appear immediately
3. Be aware signals may adjust with new bars
MULTI-TIMEFRAME LIQUIDITY STRATEGY:
Top-Down Analysis:
1. Identify HTF liquidity levels (4H/Daily) for major targets
2. Find LTF liquidity levels (1H) for entry refinement
3. Wait for HTF liquidity sweep (liquidity grab)
4. Enter on LTF order block in direction of HTF sweep
5. Target next HTF or LTF liquidity level
Liquidity Sweep Trading:
1. HTF liquidity sweep = major institutional move
2. Look for immediate reversal or continuation
3. Use order blocks for entry timing
4. Place stops beyond the swept liquidity
SESSION-BASED TRADING:
Asian Session Strategy:
1. Identify Asian session high/low
2. Wait for London or NY session to open
3. Trade breakouts of Asian range
4. Target previous day's highs/lows
London/NY Session Strategy:
1. Watch for liquidity sweeps at session open
2. Enter on order block confirmation
3. Use OTE zones for retracement entries
4. Target session high/low or HTF liquidity
OTE ZONE TRADING:
Setup Identification:
1. Wait for clear swing high/low formation
2. Confirm structure break in intended direction
3. Monitor for price retracement to 0.618-0.786 zone
4. Enter when price enters OTE zone with confirmation
Entry Rules:
- Bullish: Long when price enters OTE zone from above
- Bearish: Short when price enters OTE zone from below
- Stop loss: Beyond 0.786 level or swing extreme
- Target: Previous swing high/low or HTF liquidity
Exit Management:
- Indicator tracks when price exits OTE zone
- Red X indicates position should be managed/closed
- Use order blocks or FVGs for partial profit targets
FAIR VALUE GAP STRATEGY:
FVG Entry Method:
1. Wait for FVG formation
2. Monitor for price return to FVG
3. Enter on first touch of FVG zone
4. Stop beyond FVG boundary
5. Target: Fill of FVG or next liquidity level
iFVG Reversal Strategy:
1. Original FVG is filled
2. iFVG forms in opposite direction
3. Indicates failed move or reversal
4. Enter on iFVG confirmation
5. Target: Opposite end of range or next structure
Combined FVG + iFVG:
- When both overlap, indicator combines labels
- Represents high-probability reversal zone
- Use with order blocks for confirmation
ORDER BLOCK STRATEGY:
Entry Approach:
1. Wait for order block formation after structure break
2. Enter on first return to order block
3. Place stop beyond order block boundary
4. Target: Next order block or liquidity level
Confirmation Layers:
- Order block + FVG = strong confluence
- Order block + Liquidity sweep = institutional setup
- Order block + OTE zone = optimal entry
- Order block + Session open = high probability
Volume Analysis:
- Wider colored section = stronger institutional interest
- Use volume bars to confirm order block strength
- Higher volume order blocks = more reliable
───────────────────────────────────────
CONFIGURATION GUIDE
───────────────────────────────────────
LIQUIDITY SETTINGS:
Lookback: 5-30 bars
- Lower = more frequent, sensitive levels
- Higher = fewer, more significant levels
- Recommended: 15 for intraday, 20-25 for swing
Sweep Detection Type:
- Wick Break: Most sensitive
- Close Break: More conservative
- Full Retrace: Stop hunt detection
Sweep Buffer: 0-1.0 ATR
- Adds distance requirement for sweep confirmation
- Prevents false positives
- Recommended: 0.1 for most markets
HTF/LTF LIQUIDITY:
HTF Timeframe Selection:
- Swing trading: 1D or 1W
- Day trading: 4H or 1D
- Scalping: 1H or 4H
LTF Timeframe Selection:
- Swing trading: 4H or 1D
- Day trading: 1H or 4H
- Scalping: 15m or 1H
Strength Filters:
- Min Pivot Strength: Higher = fewer, stronger levels
- Min Distance: Higher = less clustering
- Recommended: 2.0 ATR for HTF, 1.5 ATR for LTF
ORDER BLOCK SETTINGS:
Swing Length: 5-20
- Controls sensitivity of structure break detection
- Lower = more order blocks, faster signals
- Higher = fewer order blocks, stronger signals
- Recommended: 8-10 for most timeframes
Enhancement Filters:
- Min Size: 0.5-1.5 ATR typical
- Volume Multiplier: 1.2-2.0 typical
- Imbalance: Enable for strongest signals only
OTE SETTINGS:
Swing Length: 5-50
- Controls OTE zone formation sensitivity
- Lower = more frequent, smaller moves
- Higher = fewer, larger trend moves
- Recommended: 10-15 for intraday
Require Structure Break:
- Enabled: Only shows OTE after confirmed break
- Disabled: Shows potential OTE zones earlier
- Recommended: Enable for higher probability setups
FVG SETTINGS:
Min FVG Size: 0.1-2.0 ATR
- Lower = more gaps detected
- Higher = only significant gaps
- Recommended: 0.5 ATR for most markets
Fill Threshold: 0.1-1.0
- Determines when gap is considered "filled"
- 0.5 = 50% fill required
- Higher = more conservative
iFVG Min Size: 0.1-2.0 ATR
- Typically smaller than regular FVG
- Recommended: 0.3 ATR
ALERT SYSTEM:
Available Alerts:
- Liquidity Sweeps (Current TF)
- HTF Liquidity Sweeps
- LTF Liquidity Sweeps
- Session Changes (Open/Close)
- OTE Entry Signals
Alert Setup:
1. Enable alerts in settings
2. Select specific alert types
3. Create TradingView alert using "Any alert() function call"
4. Configure delivery method (mobile, email, webhook)
Alert Messages Include:
- Event type and direction
- Confirmation status (if using confirmed mode)
- Price level
- Timeframe (for liquidity sweeps)
───────────────────────────────────────
RECOMMENDED CONFIGURATIONS
───────────────────────────────────────
For Day Trading (15m-1H charts):
- HTF Liquidity: 4H
- LTF Liquidity: 1H
- Liquidity Lookback: 15
- Order Block Swing Length: 8
- OTE Swing Length: 10
- Confirmed Signals: Enabled, 2 bars
For Swing Trading (4H-1D charts):
- HTF Liquidity: 1D or 1W
- LTF Liquidity: 4H
- Liquidity Lookback: 20
- Order Block Swing Length: 10
- OTE Swing Length: 15
- Confirmed Signals: Enabled, 2-3 bars
For Scalping (5m-15m charts):
- HTF Liquidity: 1H or 4H
- LTF Liquidity: 15m or 1H
- Liquidity Lookback: 10-12
- Order Block Swing Length: 6-8
- OTE Swing Length: 8
- Confirmed Signals: Optional
───────────────────────────────────────
PERFORMANCE OPTIMIZATION
───────────────────────────────────────
This indicator is optimized with:
- max_bars_back declarations for efficient lookback
- Automatic memory cleanup every 10 bars
- Conditional execution based on enabled features
- Drawing object limits to prevent performance degradation
Memory Management:
- Old liquidity zones automatically removed
- Filled FVGs/iFVGs cleaned up
- Exited OTE zones removed
- Mitigated order blocks deleted
Best Practices:
- Enable only needed features
- Use appropriate timeframe combinations
- Don't display excessive historical sessions
- Monitor drawing object counts on lower timeframes
───────────────────────────────────────
EDUCATIONAL DISCLAIMER
───────────────────────────────────────
This indicator combines multiple institutional trading concepts:
- Liquidity theory (where orders accumulate)
- Order flow analysis (institutional footprints)
- Price imbalance detection (FVGs)
- Fibonacci retracement theory (OTE zones)
- Session-based trading (time-of-day patterns)
All calculations use standard technical analysis methods:
- Pivot high/low detection
- ATR-based normalization
- Volume analysis
- Fibonacci ratios
- Time-based filtering
The indicator identifies potential setups but does not predict future price movements. Success depends on proper application within a complete trading plan including risk management, position sizing, and market context analysis.
───────────────────────────────────────
USAGE DISCLAIMER
───────────────────────────────────────
This tool is for educational and analytical purposes. Trading involves substantial risk of loss. The anti-repainting features provide confirmed signals but do not guarantee profitability. Always conduct independent analysis, use proper risk management, and never risk capital you cannot afford to lose. Past performance does not indicate future results.

Smart Volume [Volume Hub]Smart Volume is a custom indicator designed to highlight meaningful changes in market activity by measuring how current volume compares to historical averages. Instead of looking at raw volume alone, it calculates how many standard deviations above or below the mean a bar’s volume is. This makes it possible to identify unusual activity (accumulation, distribution, breakouts, or fakeouts) that might not be visible just by looking at candle size or price action.
The script classifies each bar’s volume into zones:
🔴 Extra High: 4× or more standard deviations above average
🟠 High: 2.5× above average
🟡 Medium: 1× above average
🔵 Normal: around average
🟢 Low: below average
Each classification has its own color, which is applied directly to the volume histogram. This provides a quick “heatmap” effect so traders can instantly see when markets are entering phases of unusually high or unusually low participation.
🔑 How It Works
The script computes a moving average of volume over the last 610 bars.
It calculates the standard deviation of volume over the same lookback.
For each bar, it measures how far that bar’s volume is from the average, expressed in multiples of standard deviation.
Depending on the zone it falls into (low, normal, medium, high, or extra high), the bar is colored accordingly.
Background heatmap zones and threshold lines can optionally be displayed to help visualize where each threshold lies.
This approach goes beyond raw volume numbers by showing relative extremes. For example, a 50K-volume bar on one market might mean nothing, but if it’s 4 standard deviations higher than usual, it’s an “extra high” signal of market participation.
📌 How to Use It
Look for clusters of extra-high volume bars to spot institutional activity or breakout confirmation.
Use low-volume areas to identify possible consolidations, false breakouts, or lack of conviction.
Combine with your trend or price-action tools: e.g., if price breaks resistance on extra high volume, the move is more likely valid.
Works across all markets (stocks, forex, crypto, futures) and timeframes.
⚠️ Disclaimer
This script does not generate buy/sell signals. It is a volume analysis tool to help identify areas of high or low activity. Always combine with proper risk management and other forms of analysis.
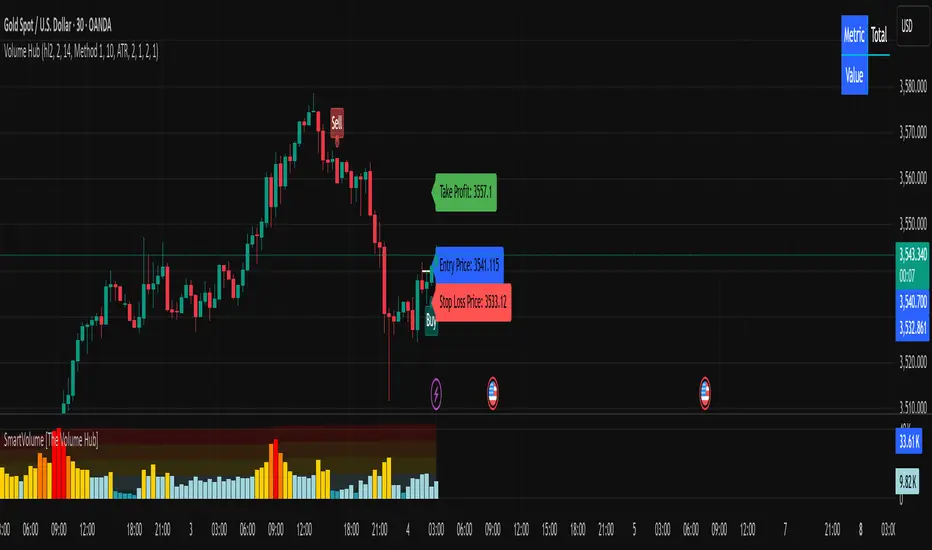
Volume Profile Grid [Alpha Extract]A sophisticated volume distribution analysis system that transforms market activity into institutional-grade visual profiles, revealing hidden support/resistance zones and market participant behavior. Utilizing advanced price level segmentation, bullish/bearish volume separation, and dynamic range analysis, the Volume Profile Grid delivers comprehensive market structure insights with Point of Control (POC) identification, Value Area boundaries, and volume delta analysis. The system features intelligent visualization modes, real-time sentiment analysis, and flexible range selection to provide traders with clear, actionable volume-based market context.
🔶 Dynamic Range Analysis Engine
Implements dual-mode range selection with visible chart analysis and fixed period lookback, automatically adjusting to current market view or analyzing specified historical periods. The system intelligently calculates optimal bar counts while maintaining performance through configurable maximum limits, ensuring responsive profile generation across all timeframes with institutional-grade precision.
// Dynamic period calculation with intelligent caching
get_analysis_period() =>
if i_use_visible_range
chart_start_time = chart.left_visible_bar_time
current_time = last_bar_time
time_span = current_time - chart_start_time
tf_seconds = timeframe.in_seconds()
estimated_bars = time_span / (tf_seconds * 1000)
range_bars = math.floor(estimated_bars)
final_bars = math.min(range_bars, i_max_visible_bars)
math.max(final_bars, 50) // Minimum threshold
else
math.max(i_periods, 50)
🔶 Advanced Bull/Bear Volume Separation
Employs sophisticated candle classification algorithms to separate bullish and bearish volume at each price level, with weighted distribution based on bar intersection ratios. The system analyzes open/close relationships to determine volume direction, applying proportional allocation for doji patterns and ensuring accurate representation of buying versus selling pressure across the entire price spectrum.
🔶 Multi-Mode Volume Visualization
Features three distinct display modes for bull/bear volume representation: Split mode creates mirrored profiles from a central axis, Side by Side mode displays sequential bull/bear segments, and Stacked mode separates volumes vertically. Each mode offers unique insights into market participant behavior with customizable width, thickness, and color parameters for optimal visual clarity.
// Bull/Bear volume calculation with weighted distribution
for bar_offset = 0 to actual_periods - 1
bar_high = high
bar_low = low
bar_volume = volume
// Calculate intersection weight
weight = math.min(bar_high, next_level) - math.max(bar_low, current_level)
weight := weight / (bar_high - bar_low)
weighted_volume = bar_volume * weight
// Classify volume direction
if bar_close > bar_open
level_bull_volume += weighted_volume
else if bar_close < bar_open
level_bear_volume += weighted_volume
else // Doji handling
level_bull_volume += weighted_volume * 0.5
level_bear_volume += weighted_volume * 0.5
🔶 Point of Control & Value Area Detection
Implements institutional-standard POC identification by locating the price level with maximum volume accumulation, providing critical support/resistance zones. The Value Area calculation uses sophisticated sorting algorithms to identify the price range containing 70% of trading volume, revealing the market's accepted value zone where institutional participants concentrate their activity.
🔶 Volume Delta Analysis System
Incorporates real-time volume delta calculation with configurable dominance thresholds to identify significant bull/bear imbalances. The system visually highlights price levels where buying or selling pressure exceeds threshold percentages, providing immediate insight into directional volume flow and potential reversal zones through color-coded delta indicators.
// Value Area calculation using 70% volume accumulation
total_volume_sum = array.sum(total_volumes)
target_volume = total_volume_sum * 0.70
// Sort volumes to find highest activity zones
for i = 0 to array.size(sorted_volumes) - 2
for j = i + 1 to array.size(sorted_volumes) - 1
if array.get(sorted_volumes, j) > array.get(sorted_volumes, i)
// Swap and track indices for value area boundaries
// Accumulate until 70% threshold reached
for i = 0 to array.size(sorted_indices) - 1
accumulated_volume += vol
array.push(va_levels, array.get(volume_levels, idx))
if accumulated_volume >= target_volume
break
❓How It Works
🔶 Weighted Volume Distribution
Implements proportional volume allocation based on the percentage of each bar that intersects with price levels. When a bar spans multiple levels, volume is distributed proportionally based on the intersection ratio, ensuring precise representation of trading activity across the entire price spectrum without double-counting or volume loss.
🔶 Real-Time Profile Generation
Profiles regenerate on each bar close when in visible range mode, automatically adapting to chart zoom and scroll actions. The system maintains optimal performance through intelligent caching mechanisms and selective line updates, ensuring smooth operation even with maximum resolution settings and extended analysis periods.
🔶 Market Sentiment Analysis
Features comprehensive volume analysis table displaying total volume metrics, bullish/bearish percentages, and overall market sentiment classification. The system calculates volume dominance ratios in real-time, providing immediate insight into whether buyers or sellers control the current price structure with percentage-based sentiment thresholds.
🔶 Visual Profile Mapping
Provides multi-layered visual feedback through colored volume bars, POC line highlighting, Value Area boundaries, and optional delta indicators. The system supports profile mirroring for alternative perspectives, line extension for future reference, and customizable label positioning with detailed price information at critical levels.
Why Choose Volume Profile Grid
The Volume Profile Grid represents the evolution of volume analysis tools, combining traditional volume profile concepts with modern visualization techniques and intelligent analysis algorithms. By integrating dynamic range selection, sophisticated bull/bear separation, and multi-mode visualization with POC/Value Area detection, it provides traders with institutional-quality market structure analysis that adapts to any trading style. The comprehensive delta analysis and sentiment monitoring system eliminates guesswork while the flexible visualization options ensure optimal clarity across all market conditions, making it an essential tool for traders seeking to understand true market dynamics through volume-based price discovery.

PowerBar (Purple Dot) – Price & Volume Spike📌 Overview
This indicator is inspired by the well-known “Purple Dot” indicator popularized by Manas Arora, designed to help traders identify fast-moving stocks exhibiting strong price and volume momentum.
This indicator flags high-activity bars called "PowerBars" — bars where:
Rate of Change (ROC) is equal to or above a user-defined threshold (default 5%)
Volume is equal to or a user-defined threshold (default 500,000)
These bars are visually marked with purple dots and can serve as a signal of strength, interest, or volatility spike.
🔍 How It Works
The indicator:
Calculates bar-level conditions based on:
ROC >= Threshold (e.g., 5%)
Volume >= Threshold (e.g., 500,000)
Flags qualifying bars with a purple dot below the candle
Aggregates PowerBar count over selectable historical periods (1 week, 1M, 3M, 6M, 9M, 12M)
Displays total PowerBars and total return (%) over the selected time period in a clean visual table
🛠 Features
Purple Dot Plotting: Marks bars where price changes rapidly (based on a user-defined Rate of Change threshold) and where volume exceeds a set minimum, signaling potential momentum bursts.
Flexible Timeframes: Count PowerBars and calculate stock return over selectable lookback periods ranging from 1 week to 12 months, adaptable to various trading styles and markets.
PowerBar Count: Tracks and displays the number of PowerBars within the chosen period, helping quantify momentum frequency.
Return Calculation: Shows the percentage return over the selected time horizon, supporting performance validation.
Customizable Summary Table: On-chart table with dark/light themes, adjustable size, and position offers a clean overview of key metrics.
Dual Modes:
Chart Mode: Ideal for single-stock analysis with visual dot markers and performance stats.
PineScreener Mode: Outputs data suitable for PineScreener scanning.
⚙️ Parameters
ROC Threshold (%): Minimum bar-to-bar price change in percentage to signal a PowerBar (default 5%).
Volume Threshold: Minimum volume for a bar to qualify (default 500,000).
PowerBar and Return Periods: Choose from 1 week up to 12 months.
Visual Customization: Enable/disable purple dots, configure the summary table’s appearance, and select dark or light theme.
Mode Selection: Switch easily between Chart Mode and PineScreener Mode based on use case.
📬 Alerts
Set alerts for PowerBars (purple dots) to get notified when a strong price-volume bar appears.

Whale Activity[nakano]#### **Title**
Whale Activity
#### **Summary**
This indicator visualizes the micro-level power dynamics occurring inside each candlestick. It analyzes the volume of a user-defined lower timeframe (e.g., 1-second) within each bar of the main chart (e.g., 5-minute) and separately plots the total "buying pressure" (bullish volume) and "selling pressure" (bearish volume) that exceeded a significant volume threshold.
It's a tool designed to help you trace the footprints of "whales" (large-scale investors) that are often hidden in standard volume bars.
#### **Key Features**
* **Bi-directional Volume Bars:**
* **Upward Green Bars:** Represent the sum of volume from bullish (up) lower-timeframe candles that exceeded the volume threshold, signifying buying pressure.
* **Downward Red Bars:** Represent the sum of volume from bearish (down) lower-timeframe candles that exceeded the threshold, signifying selling pressure.
* **Complete Customization:**
* **Symbol to Analyze:** Freely select any instrument from any market (Crypto, Stocks, Forex, etc.).
* **Analysis Timeframe (Lower):** Choose the granularity of your analysis (1S, 5S, 10S, 1M, etc.) from a dropdown menu.
* **Volume Threshold (Lower TF):** Set a minimum volume to filter out market noise and focus only on significant trades.
#### **How to Use & Interpretation Tips**
* **See Through "Deceptive Volume":**
If a 5-minute candle has high total volume, but this indicator shows small green and red bars, it suggests the volume was comprised of many insignificant trades with no clear intent from large players ("whales").
* **Identify Dominant Pressure:**
Conversely, a large, protruding green bar with a small red bar indicates strong, persistent buying pressure and potential accumulation. The same applies to selling pressure.
* **Threshold Adjustment is Key:**
The "Volume Threshold" is critical and varies greatly between assets. A value of `1.0` might be suitable for BTC, while a stock like AAPL might require `100000` (shares). Adjust this value to fit the instrument you are analyzing to unlock the full potential of this tool.
#### **Disclaimer**
* Using this indicator on high chart timeframes (e.g., 1H, 1D) requires fetching a very large amount of data from the lower timeframe, which may lead to performance issues or script errors. It is recommended for use on intraday timeframes (e.g., 1M, 5M, 15M).
* Always ensure the selected "Analysis Timeframe (Lower)" is shorter than or equal to your main chart's timeframe.
---
#### **タイトル**
Whale Activity
#### **概要 (Summary)**
このインジケーターは、ローソク足の内部で起きている微細な力関係を可視化します。指定した時間足(例:5分足)の中に含まれる、さらに短い時間足(例:1秒足)の出来高を分析し、閾値を超えた「買い圧力(陽線出来高)」と「売り圧力(陰線出来高)」をそれぞれ合計して、上下のバーで表示します。
通常の出来高バーでは見えない「クジラ(大口投資家)」の動きの痕跡を探るためのツールです。
#### **主な機能 (Key Features)**
* **上下の出来高バー:**
* **緑のバー(上向き):** 閾値を超えた陽線(買い)の出来高の合計値を表します。
* **赤のバー(下向き):** 閾値を超えた陰線(売り)の出来高の合計値を表します。
* **完全なカスタマイズ性:**
* **分析する銘柄:** 暗号資産、株式、FXなど、あらゆる銘柄を自由に選択して分析できます。
* **分析する時間足 (下位):** 1秒、5秒、10秒など、分析の粒度をドロップダウンから選択できます。
* **出来高の閾値 (下位TF):** 市場のノイズを除去し、「意味のある」と判断する出来高の基準値を自由に設定できます。
#### **使い方・分析のヒント (How to Use & Interpretation Tips)**
* **「見せかけの出来高」を見破る:**
例えば、5分足の出来高が大きくても、このインジケーターのバーが両方とも小さい場合、それは閾値以下の小さな取引の集合であり、大口の明確な意図はないかもしれません。
* **優勢な力の特定:**
逆に、緑のバーだけが突出している場合、誰かが継続的に買い集めている強いシグナルと解釈できます。売りも同様です。
* **閾値の調整が鍵:**
「出来高の閾値」は、分析する銘柄や時間帯によって大きく異なります。BTCなら`1`、AAPL株なら`100000`のように、適切な値に調整することで、初めてこのツールは真価を発揮します。
#### **注意点 (Disclaimer)**
* チャートの時間足を長くする(例: 1時間足、日足)と、計算するデータ量が膨大になり、パフォーマンスが低下したり、エラーが発生する可能性があります。分足での使用を推奨します。
* 「分析する時間足 (下位)」は、必ずチャート本体の時間足よりも短いものを選択してください。

Capital Flow StrengthCapital Flow Strength Indicator Guide
This is a comprehensive technical indicator that measures capital flow into or out of an asset, combined with volume analysis. Here's how to use it effectively:
Basic Understanding
The indicator shows capital flow strength on a scale from -100 to +100
Positive values (green) indicate money flowing into the asset
Negative values (red) indicate money flowing out
The blue/gray volume bars show relative volume compared to recent average
Key Components
Capital Flow Line
Green line above zero: Buying pressure dominates
Red line below zero: Selling pressure dominates
Crossing zero: Potential shift in market sentiment
Reference Lines
0 line: Neutral balance between buyers and sellers
+50 line: Strong buying pressure
-50 line: Strong selling pressure
Volume Strength Bars
Blue bars: Volume exceeding threshold (currently 1.5x average)
Gray bars: Normal volume levels
Taller bars: Higher relative volume
Trading Applications
Entry Signals
Strong buying setup: Capital flow above +50 with blue volume bars
Strong selling setup: Capital flow below -50 with blue volume bars
Confirmation Tool
Use with price action and other indicators for confirmation
Strong readings are more reliable when volume is higher than average
Divergence Analysis
Bullish divergence: Price making lower lows but capital flow making higher lows
Bearish divergence: Price making higher highs but capital flow making lower highs
Customization Options
Length (14): Adjust the calculation period
Volume Threshold (1.5): Modify sensitivity to volume spikes
Alert Conditions
The indicator has two built-in alerts:
"Strong Capital Inflow" - triggers when flow > 50 with high volume
"Strong Capital Outflow" - triggers when flow < -50 with high volume
These alerts can help you identify significant buying or selling pressure as it emerges.

Relative Volume Indicator (RVOL)Relative Volume Indicator (RVOL)
The Relative Volume Indicator (RVOL) helps traders identify unusual volume activity by comparing the current volume to the average historical volume. This makes it easier to spot potential breakouts, reversals, or significant market events that are accompanied by volume confirmation.
What This Indicator Shows
This indicator displays volume as a multiple of average volume, where:
- 1.0x means 100% of average volume
- 2.0x means 200% of average volume (twice the average)
- 0.5x means 50% of average volume (half the average)
Color Coding
The volume bars are color-coded based on configurable thresholds:
- Red: Below average volume (< Average Volume Threshold)
- Yellow: Average volume (between Average Volume and Above Average thresholds)
- Green: Above average volume (between Above Average and Extreme thresholds)
- Magenta: Extreme volume (> Extreme Volume Threshold)
Horizontal Reference Lines
Three dotted horizontal reference lines help you visualize the thresholds:
- Lower gray line: Average Volume Threshold (default: 0.8x)
- Upper gray line: Above Average Threshold (default: 1.25x)
- Magenta line: Extreme Volume Threshold (default: 4.0x)
How To Use This Indicator
1. Volume Confirmation: Use green bars to confirm breakouts or trend changes - stronger moves often come with above-average volume.
2. Low Volume Warning: Red bars during price movements may indicate weak conviction and potential reversals.
3. Extreme Volume Events: Magenta bars (extreme volume) often signal major market events or potential exhaustion points that could lead to reversals.
4. Volume Divergence: Look for divergences between price and volume - for example, if price makes new highs but volume is decreasing (more yellow/red bars), the move may be losing strength.
Settings Configuration
- Average Volume Lookback Period: Number of bars used to calculate the average volume (default: 20)
- Average Volume Threshold: Volume below this level is considered below average (default: 0.8x)
- Above Average Threshold: Volume above this level is considered above average (default: 1.25x)
- Extreme Volume Threshold: Volume above this level is considered extreme (default: 4.0x)
- Colors: Customize colors for each volume category
Important Note: Adjust threshold values only through the indicator settings (not in the Style tab). Changing values in the Style tab will not adjust the coloring of the volume bars.
Adjust these settings based on the specific asset being analyzed and your trading timeframe. More volatile assets may require higher thresholds, while less volatile ones might need lower thresholds.