Rolling VWAP LevelsRolling VWAP Levels Indicator
Overview
Dynamic horizontal lines showing rolling Volume Weighted Average Price (VWAP) levels for multiple timeframes (7D, 30D, 90D, 365D) that update in real-time as new bars form.
Who This Is For
Day traders using VWAP as support/resistance
Swing traders analyzing multi-timeframe price structure
Scalpers looking for mean reversion entries
Options traders needing volatility bands for strike selection
Institutional traders tracking volume-weighted fair value
Risk managers requiring dynamic stop levels
How To Trade With It
Mean Reversion Strategies:
Buy when price is below VWAP and showing bullish divergence
Sell when price is above VWAP and showing bearish signals
Use multiple timeframes - enter on shorter, confirm on longer
Target opposite VWAP level for profit taking
Breakout Trading:
Watch for price breaking above/below key VWAP levels with volume
Use 7D VWAP for intraday breakouts
Use 30D/90D VWAP for swing trade breakouts
Confirm breakout with move beyond first standard deviation band
Support/Resistance Trading:
VWAP levels act as dynamic support in uptrends
VWAP levels act as dynamic resistance in downtrends
Multiple timeframe VWAP confluence creates stronger levels
Use standard deviation bands as additional S/R zones
Risk Management:
Place stops beyond next VWAP level
Use standard deviation bands for position sizing
Exit partial positions at VWAP levels
Monitor distance table for overextended moves
Key Features
Real-time Updates: Lines move and extend as new bars form
Individual Styling: Custom colors, widths, styles for each timeframe
Standard Deviation Bands: Optional volatility bands with custom multipliers
Smart Labels: Positioned above, below, or diagonally relative to lines
Distance Table: Shows percentage distance from each VWAP level
Alert System: Get notified when price crosses VWAP levels
Memory Efficient: Automatically cleans up old drawing objects
Settings Explained
Display Group: Show/hide labels, font size, line transparency, positioning
Individual VWAP Groups: Color, line width (1-5), line style for each timeframe
Standard Deviation Bands: Enable bands with custom multipliers (0.5, 1.0, 1.5, 2.0, etc.)
Labels Group: Position (8 options including diagonal), custom text, price display
Additional Info: Distance table, alert conditions
Technical Implementation
Uses rolling arrays to maintain sliding windows of price*volume data. The core calculation function processes both VWAP and standard deviation efficiently. Lines are created dynamically and updated every bar. Memory management prevents object accumulation through automatic cleanup.
Best Practices
Start with 7D and 30D VWAP for most strategies
Add 90D/365D for longer-term context
Use standard deviation bands when volatility matters
Position labels to avoid chart clutter
Enable distance table during high volatility periods
Set alerts for key VWAP level breaks
Market Applications
Forex: Major pairs during London/NY sessions
Stocks: Large cap names with good volume
Crypto: Bitcoin, Ethereum, major altcoins
Futures: ES, NQ, CL, GC with continuous volume
Options: Use SD bands for strike selection and volatility assessment
在脚本中搜索"VWAP"

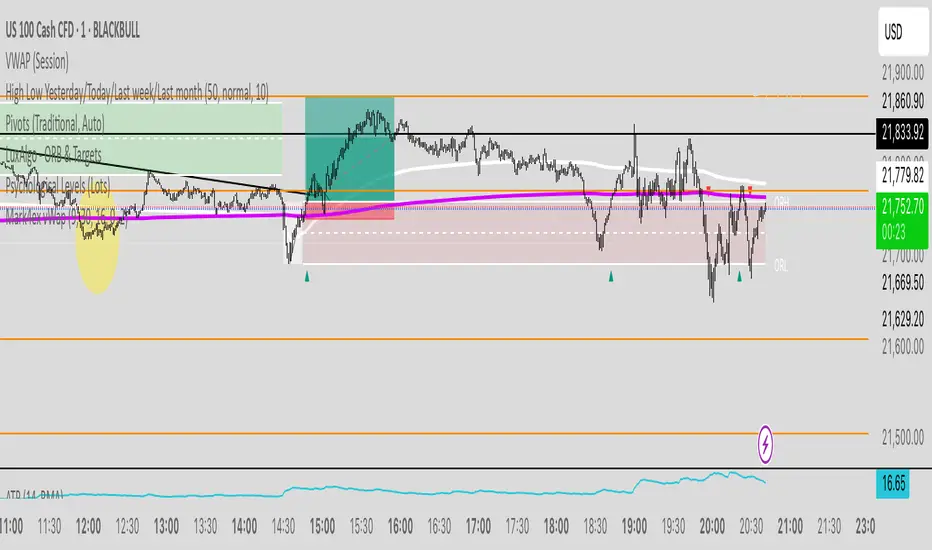
Mark4ex vWapMark4ex VWAP is a precision session-anchored Volume Weighted Average Price (VWAP) indicator crafted for intraday traders who want clean, reliable VWAP levels that reset daily to match a specific market session.
Unlike the built-in continuous VWAP, this version anchors each day to your chosen session start and end time, most commonly aligned with the New York Stock Exchange Open (9:30 AM EST) through the market close (4:00 PM EST). This ensures your VWAP reflects only intraday price action within your active trading window — filtering out irrelevant overnight moves and providing clearer mean-reversion signals.
Key Features:
Fully configurable session start & end times — adapt it for NY session or any other market.
Anchored VWAP resets daily for true session-based levels.
Built for the New York Open Range Breakout strategy: see how price interacts with VWAP during the volatile first 30–60 minutes of the US market.
Plots a clean, dynamic line that updates tick-by-tick during the session and disappears outside trading hours.
Designed to help you spot real-time support/resistance, intraday fair value zones, and liquidity magnets used by institutional traders.
How to Use — NY Open Range Breakout:
During the first hour of the New York session, institutional traders often define an “Opening Range” — the high and low formed shortly after the bell. The VWAP in this zone acts as a dynamic pivot point:
When price is above the session VWAP, bulls are in control — the level acts as a support floor for pullbacks.
When price is below the session VWAP, bears dominate — the level acts as resistance against bounces.
Breakouts from the opening range often test the VWAP for confirmation or rejection.
Traders use this to time entries for breakouts, retests, or mean-reversion scalps with greater confidence.
⚙️ Recommended Settings:
Default: 9:30 AM to 4:00 PM New York time — standard US equities session.
Adjust hours/minutes to match your target market’s open and close.
👤 Who is it for?
Scalpers, day traders, prop traders, and anyone trading the NY Open, indices like the S&P 500, or highly liquid stocks during US cash hours.
🚀 Why use Mark4ex VWAP?
Because a properly anchored VWAP is a trader’s real-time institutional fair value, giving you better context than static moving averages. It adapts live to volume shifts and helps you follow smart money footprints.
This indicator will reconfigure every day, anchored to the New York Open, it will also leave historical NY Open VWAP for study purpose.
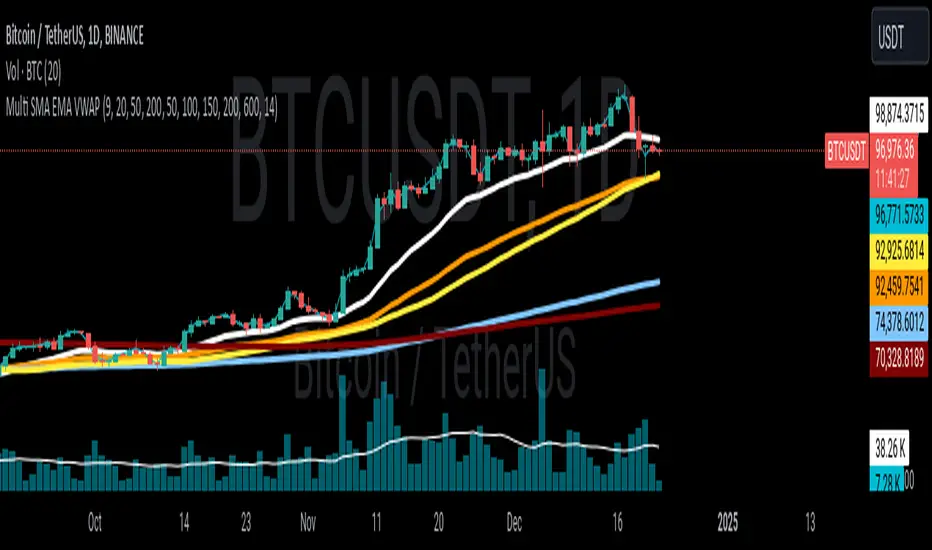
Multi SMA EMA VWAP1. Moving Average Crossover
This is one of the most common strategies with moving averages, and it involves observing crossovers between EMAs and SMAs to determine buy or sell signals.
Buy signal: When a faster EMA (like a short-term EMA) crosses above a slower SMA, it can indicate a potential upward movement.
Sell signal: When a faster EMA crosses below a slower SMA, it can indicate a potential downward movement.
With 4 EMAs and 5 SMAs, you can set up crossovers between different combinations, such as:
EMA(9) crosses above SMA(50) → buy.
EMA(9) crosses below SMA(50) → sell.
2. Divergence Confirmation Between EMAs and SMAs
Divergence between the EMAs and SMAs can offer additional confirmation. If the EMAs are pointing in one direction and the SMAs are still in the opposite direction, it is a sign that the movement could be stronger and continue in the same direction.
Positive divergence: If the EMAs are making new highs while the SMAs are still below, it could be a sign that the market is in a strong trend.
Negative divergence: If the EMAs are making new lows and the SMAs are still above, you might consider that the market is in a downtrend or correction.
3. Using EMAs as Dynamic Support and Resistance
EMAs can act as dynamic support and resistance in strong trends. If the price approaches a faster EMA from above and doesn’t break it, it could be a good entry point for a long position (buy). If the price approaches a slower EMA from below and doesn't break it, it could be a good point to sell (short).
Buy: If the price is above all EMAs and approaches the fastest EMA (e.g., EMA(9)), it could be a good buy point if the price bounces upward.
Sell: If the price is below all EMAs and approaches the fastest EMA, it could be a good sell point if the price bounces downward.
4. Combining SMAs and EMAs to Filter Signals
SMAs can serve as a trend filter to avoid trading in sideways markets. For example:
Bullish trend condition: If the longer-term SMAs (such as SMA(100) or SMA(200)) are below the price, and the shorter EMAs are aligned upward, you can look for buy signals.
Bearish trend condition: If the longer-term SMAs are above the price and the shorter EMAs are aligned downward, you can look for sell signals.
5. Consolidation Zone Between EMAs and SMAs
When the price moves between EMAs and SMAs without a clear trend (consolidation zone), you can expect a breakout. In this case, you can use the EMAs and SMAs to identify the direction of the breakout:
If the price is in a narrow range between the EMAs and SMAs and then breaks above the fastest EMA, it’s a sign that an upward trend may begin.
If the price breaks below the fastest EMA, it could indicate a potential downward trend.
6. "Golden Cross" and "Death Cross" Strategy
These are classic strategies based on crossovers between moving averages of different periods.
Golden Cross: Occurs when a faster EMA (e.g., EMA(50)) crosses above a slower SMA (e.g., SMA(200)), which suggests a potential bullish trend.
Death Cross: Occurs when a faster EMA crosses below a slower SMA, which suggests a potential bearish trend.
Additional Recommendations:
Combining with other indicators: You can combine EMA and SMA signals with other indicators like the RSI (Relative Strength Index) or MACD (Moving Average Convergence/Divergence) for confirmation and to avoid false signals.
Risk management: Always use stop-loss and take-profit orders to protect your capital. Moving averages are trend-following indicators but don’t guarantee that the price will move in the same direction.
Timeframe analysis: It’s recommended to use different timeframes to confirm the trend (e.g., use EMAs on hourly charts along with SMAs on daily charts).
VWAP
1. VWAP + EMAs for Trend Confirmation
VWAP can act as a trend filter, confirming the direction provided by the EMAs.
Buy Signal: If the price is above the VWAP and the EMAs are aligned in an uptrend (e.g., short-term EMAs are above longer-term EMAs), this indicates that the trend is bullish and you can look for buy opportunities.
Sell Signal: If the price is below the VWAP and the EMAs are aligned in a downtrend (e.g., short-term EMAs are below longer-term EMAs), this suggests a bearish trend and you can look for sell opportunities.
In this case, VWAP is used to confirm the overall trend. For example:
Bullish: Price above VWAP, EMAs aligned to the upside (e.g., EMA(9) > EMA(50) > EMA(200)), buy.
Bearish: Price below VWAP, EMAs aligned to the downside (e.g., EMA(9) < EMA(50) < EMA(200)), sell.
2. VWAP as Dynamic Support and Resistance
VWAP can act as a dynamic support or resistance level during the day. Combining this with EMAs and SMAs helps you refine your entry and exit points.
Support: If the price is above VWAP and starts pulling back to VWAP, it could act as support. If the price bounces off the VWAP and aligns with bullish EMAs (e.g., EMA(9) crossing above EMA(50)), you can consider entering a buy position.
Resistance: If the price is below VWAP and approaches VWAP from below, it can act as resistance. If the price fails to break through VWAP and aligns with bearish EMAs (e.g., EMA(9) crossing below EMA(50)), it could be a good signal for a sell.
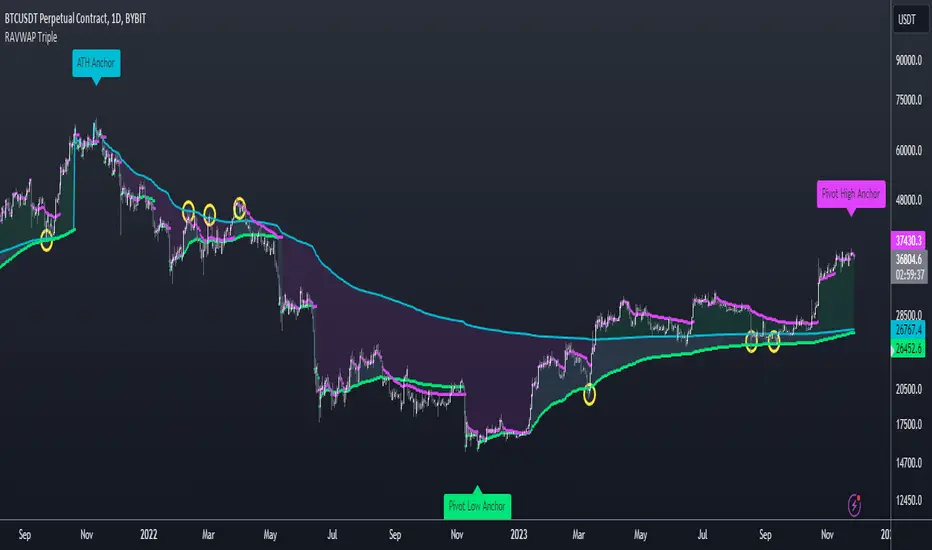
Re-Anchoring VWAP TripleThe Triple Re-Anchoring VWAP (Volume Weighted Average Price) indicator is a tool designed for traders seeking a deeper understanding of market trends and key price levels. This indicator dynamically recalibrates VWAP calculations based on significant market pivot points, offering a unique perspective on potential support and resistance levels.
Key Features:
Dynamic Re-anchoring at All-Time Highs (ATH) : The first layer of this indicator continuously tracks the all-time high and recalibrates the VWAP from each new ATH. This VWAP line, typically acting as a dynamic resistance level, offers insights into the overbought conditions and potential reversal zones.
Adaptive Re-anchoring to Post-ATH Lows : The second component of the indicator shifts focus to the market's reaction post-ATH. It identifies the lowest low following an ATH and re-anchors the VWAP calculation from this point. This VWAP line often serves as a dynamic support level, highlighting key areas where the market finds value after a significant high.
Re-anchoring to Highs After Post-ATH Lows : The third element of this tool takes adaptation one step further by tracking the highest high achieved after the lowest low post-ATH. This VWAP line can act as either support or resistance, providing a nuanced view of the market's valuation in the recovery phase or during consolidation after a significant low.
Applications:
Trend Confirmation and Reversal Signals : By comparing the price action relative to the dynamically anchored VWAP lines, traders can gauge the strength of the trend and anticipate potential reversals.
Entry and Exit Points : By highlighting significant support and resistance areas, it assists in determining optimal entry and exit points, particularly in swing trading and mean reversion strategies.
Enhanced Market Insight : The dynamic nature of the indicator, with its shifting anchor points, offers a refined understanding of market sentiment and valuation changes over time.
Why Triple Re-Anchoring VWAP?
Traditional VWAP tools offer a linear view, often missing out on the intricacies of market fluctuations. The Triple Re-Anchoring VWAP addresses this by providing a multi-faceted view of the market, adapting not just to daily price changes but pivoting around significant market events. Whether you're a day trader, swing trader, or long-term investor, this indicator adds depth to your market analysis, enabling more informed trading decisions.
Examples:
Colored VWAP and BarcolorThis indicator plots the Volume Weighted Average Price (VWAP) as well as changes the bar color if the current price is above or below VWAP, for quick visual reference.
Background Information
Straight from TradingView, "Volume Weighted Average Price (VWAP) is a technical analysis tool used to measure the average price weighted by volume. VWAP is typically used with intraday charts as a way to determine the general direction of intraday prices. It's similar to a moving average in that when price is above VWAP, prices are rising and when price is below VWAP, prices are falling. VWAP is primarily used by technical analysts to identify market trend."
About the Indicator
This indicator changes the VWAP line color and bar color based on the current price.
Bar Color
Bullish Up Candle Color = Current price is above VWAP and the close of the candle was greater than the open.
Bullish Down Candle Color = Current price is above VWAP and the close of the candle was less than the open.
Bearish Up Candle Color = Current price is below VWAP and the close of the candle was greater than the open.
Bearish Down Candle Color = Current price is below VWAP and the close of the candle was less than the open.

Chart VWAP█ OVERVIEW
This indicator displays a Volume-Weighted Average Price anchored to the leftmost visible bar of the chart. It dynamically recalculates when the chart's visible bars change because you scroll or zoom your chart.
If you are not already familiar with VWAP, our Help Center will get you started. The typical VWAP is designed to be used on intraday charts, as it resets at the beginning of the day. Our Rolling VWAP , instead, resets on a rolling time window. You may also find the VWAP Auto Anchored built-in indicator worth a try.
█ HOW TO USE IT
Load the indicator on an active chart (see the Help Center if you don't know how). By default, it displays the chart's VWAP in orange and a simple average of the chart's visible close values in gray. This average can be used as a companion to the VWAP, since both are calculated from the same set of bars. The script's settings allow you to hide it.
You may also use the script's settings to enable the display of the chart's OHLC (open, high, low, close) levels and the values of the high and low. These are also calculated from the range of visible bars. You can complement the high and low lines with their price and their distance in percent from the chart's latest visible close . You can use the levels to quickly identify the distances from extreme points in the visible price range, as well as observe the visible chart's beginning and end prices.
█ NOTES FOR Pine Script™ CODERS
This script showcases three novelties:
• Dynamic recalculation on visible bars
• The VisibleChart library by PineCoders
• The new `anchor` parameter of ta.vwap()
Dynamic recalculation on visible bars
This script behaves in a novel way made possible by the recent introduction of two new built-in variables: chart.left_visible_bar_time and chart.right_visible_bar_time , which return the opening time of the leftmost and rightmost visible bars on the chart. These are only two of many new built-ins in the `chart.*` namespace. See this blog post for more information, or look up them up by typing "chart." in the Pine Script™ Reference Manual .
Any script using chart.left_visible_bar_time or chart.right_visible_bar_time acquires a unique property, which triggers its recalculation when traders scroll or zoom their chart, causing the range of visible bars to change. This new capability is what makes it possible for this script to calculate its VWAP on the chart's visible bars only, and dynamically recalculate if the user scrolls or zooms their chart.
This script is just a start to the party; endless uses for indicators that redraw on changes to the chart will no doubt emerge through the hands of our community's Pine Script™ programmers.
The VisibleChart library by PineCoders
The newly published VisibleChart library is designed to help programmers benefit from the new capabilities made possible by the fact that Pine Script™ code can now tell when it is executing on visible bars. The library's description, functions and example code will help programmers make the most of the new feature.
This script uses three of the library's functions:
• `PCvc.vVwap()` calculates a VWAP for visible bars.
• `PCvc.avg()` calculates the average of a source value for visible bars only. We use it to calculate the average close (the default source).
• `PCvc.chartXTimePct(25)` calculates a time value corresponding to 25% of the horizontal distance between visible bars, starting from the left.
The new `anchor` parameter of ta.vwap()
Our script also uses this new `anchor` parameter to reset the VWAP at the leftmost visible bar. See how simple the code is for the VisibleChart library's `vVwap()` function.
Look first. Then leap.

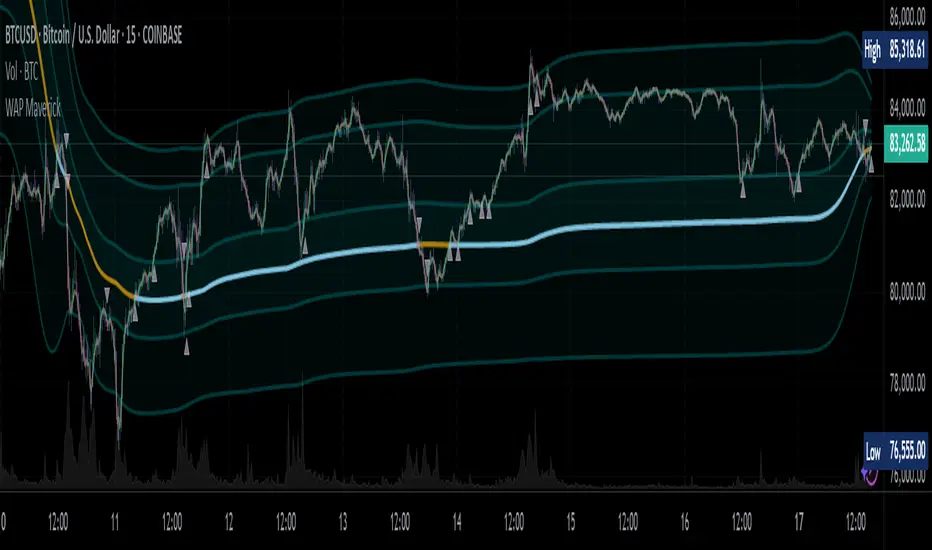
WAP Maverick - (Dual EMA Smoothed VWAP) - [mutantdog]Short Version:
This here is my take on the popular VWAP indicator with several novel features including:
Dual EMA smoothing.
Arithmetic and Harmonic Mean plots.
Custom Anchor feat. Intraday Session Sizes.
2 Pairs of Bands.
Side Input for Connection to other Indicator.
This can be used 'out of the box' as a replacement VWAP, benefitting from smoother transitions and easy-to-use custom alerts.
By design however, this is intended to be a highly customisable alternative with many adjustable parameters and a pseudo-modular input system to connect with another indicator. Well suited for the tweakers around here and those who like to get a little more creative.
I made this primarily for crypto although it should work for other markets. Default settings are best suited to 15m timeframe - the anchor of 1 week is ideal for crypto which often follows a cyclical nature from Monday through Sunday. In 15m, the default ema length of 21 means that the wap comes to match a standard vwap towards the end of Monday. If using higher chart timeframes, i recommend decreasing the ema length to closely match this principle (suggested: for 1h chart, try length = 8; for 4h chart, length = 2 or 3 should suffice).
Note: the use of harmonic mean calculations will cause problems on any data source incorporating both positive and negative values, it may also return unusable results on extremely low-value charts (eg: low-sat coins in /btc pairs).
Long version:
The development of this project was one driven more by experimentation than a specific end-goal, however i have tried to fine-tune everything into a coherent usable end-product. With that in mind then, this walkthrough will follow something of a development chronology as i dissect the various functions.
DUAL-EMA SMOOTHING
At its core this is based upon / adapted from the standard vwap indicator provided by TradingView although I have modified and changed most of it. The first mod is the dual ema smoothing. Rather than simply applying an ema to the output of the standard vwap function, instead i have incorporated the ema in a manner analogous to the way smas are used within a standard vwma. Sticking for now with the arithmetic mean, the basic vwap calculation is simply sum(source * volume) / sum(volume) across the anchored period. In this case i have simply applied an ema to each of the numerator and denominator values resulting in ema(sum(source * volume)) / ema(sum(volume)) with the ema length independent of the anchor. This results in smoother (albeit slower) transitions than the aforementioned post-vwap method. Furthermore in the case when anchor period is equal to current timeframe, the result is a basic volume-weighted ema.
The example below shows a standard vwap (1week anchor) in blue, a 21-ema applied to the vwap in purple and a dual-21-ema smoothed wap in gold. Notably both ema types come to effectively resemble the standard vwap after around 24 hours into the new anchor session but how they behave in the meantime is very different. The dual-ema transitions quite gradually while the post-vwap ema immediately sets about trying to catch up. Incidentally. a similar and slower variation of the dual-ema can be achieved with dual-rma although i have not included it in this indicator, attempted analogues using sma or wma were far less useful however.
STANDARD DEVIATION AND BANDS
With this updated calculation, a corresponding update to the standard deviation is also required. The vwap has its own anchored volume-weighted st.dev but this cannot be used in combination with the ema smoothing so instead it has been recalculated appropriately. There are two pairs of bands with separate multipliers (stepped to 0.1x) and in both cases high and low bands can be activated or deactivated individually. An example usage for this would be to create different upper and lower bands for profit and stoploss targets. Alerts can be set easily for different crossing conditions, more on this later.
Alongside the bands, i have also added the option to shift ('Deviate') the entire indicator up or down according to a multiple of the corrected st.dev value. This has many potential uses, for example if we want to bias our analysis in one direction it may be useful to move the wap in the opposite. Or if the asset is trading within a narrow range and we are waiting on a breakout, we could shift to the desired level and set alerts accordingly. The 'Deviate' parameter applies to the entire indicator including the bands which will remain centred on the main WAP.
CUSTOM (W)ANCHOR
Ever thought about using a vwap with anchor periods smaller than a day? Here you can do just that. I've removed the Earnings/Dividends/Splits options from the basic vwap and added an 'Intraday' option instead. When selected, a custom anchor length can be created as a multiple of minutes (default steps of 60 mins but can input any value from 0 - 1440). While this may not seem at first like a useful feature for anyone except hi-speed scalpers, this actually offers more interesting potential than it appears.
When set to 0 minutes the current timeframe is always used, turning this into the basic volume-weighted ema mentioned earlier. When using other low time frames the anchor can act as a pre-ema filter creating a stepped effect akin to an adaptive MA. Used in combination with the bands, the result is a kind of volume-weighted adaptive exponential bollinger band; if such a thing does not already exist then this is where you create it. Alternatively, by combining two instances you may find potential interesting crosses between an intraday wap and a standard timeframe wap. Below is an example set to intraday with 480 mins, 2x st.dev bands and ema length 21. Included for comparison in purple is a standard 21 ema.
I'm sure there are many potential uses to be found here, so be creative and please share anything you come up with in the comments.
ARITHMETIC AND HARMONIC MEAN CALCULATIONS
The standard vwap uses the arithmetic mean in its calculation. Indeed, most mean calculations tend to be arithmetic: sma being the most widely used example. When volume weighting is involved though this can lead to a slight bias in favour of upward moves over downward. While the effect of this is minor, over longer anchor periods it can become increasingly significant. The harmonic mean, on the other hand, has the opposite effect which results in a value that is always lower than the arithmetic mean. By viewing both arithmetic and harmonic waps together, the extent to which they diverge from each other can be used as a visual reference of how much price has changed during the anchored period.
Furthermore, the harmonic mean may actually be the more appropriate one to use during downtrends or bearish periods, in principle at least. Consider that a short trade is functionally the same as a long trade on the inverse of the pair (eg: selling BTC/USD is the same as buying USD/BTC). With the harmonic mean being an inverse of the arithmetic then, it makes sense to use it instead. To illustrate this below is a snapshot of LUNA/USDT on the left with its inverse 1/(LUNA/USDT) = USDT/LUNA on the right. On both charts is a wap with identical settings, note the resistance on the left and its corresponding support on the right. It should be easy from this to see that the lower harmonic wap on the left corresponds to the upper arithmetic wap on the right. Thus, it would appear that the harmonic mean should be used in a downtrend. In principle, at least...
In reality though, it is not quite so black and white. Rarely are these values exact in their predictions and the sort of range one should allow for inaccuracies will likely be greater than the difference between these two means. Furthermore, the ema smoothing has already introduced some lag and thus additional inaccuracies. Nevertheless, the symmetry warrants its inclusion.
SIDE INPUT & ALERTS
Finally we move on to the pseudo-modular component here. While TradingView allows some interoperability between indicators, it is limited to just one connection. Any attempt to use multiple source inputs will remove this functionality completely. The workaround here is to instead use custom 'string' input menus for additional sources, preserving this function in the sole 'source' input. In this case, since the wap itself is dependant only price and volume, i have repurposed the full 'source' into the second 'side' input. This allows for a separate indicator to interact with this one that can be used for triggering alerts. You could even use another instance of this one (there is a hidden wap:mid plot intended for this use which is the midpoint between both means). Note that deleting a connected indicator may result in the deletion of those connected to it.
Preset alertconditions are available for crossings of the side input above and below the main wap, alongside several customisable alerts with corresponding visual markers based upon selectable conditions. Alerts for band crossings apply only to those that are active and only crossings of the type specified within the 'crosses' subsection of the indicator settings. The included options make it easy to create buy alerts specific to certain bands with sell alerts specific to other bands. The chart below shows two instances with differing anchor periods, both are connected with buy and sell alerts enabled for visible bands.
Okay... So that just about covers it here, i think. As mentioned earlier this is the product of various experiments while i have been learning my way around PineScript. Some of those experiments have been branched off from this in order to not over-clutter it with functions. The pseudo-modular design and the 'side' input are the result of an attempt to create a connective framework across various projects. Even on its own though, this should offer plenty of tweaking potential for anyone who likes to venture away from the usual standards, all the while still retaining its core purpose as a traders tool.
Thanks for checking this out. I look forward to any feedback below.
Volume Profile Free Pro (25 Levels Value Area VWAP) by RRBVolume Profile Free Pro by RagingRocketBull 2019
Version 1.0
All available Volume Profile Free Pro versions are listed below (They are very similar and I don't want to publish them as separate indicators):
ver 1.0: style columns implementation
ver 2.0: style histogram implementation
ver 3.0: style line implementation
This indicator calculates Volume Profile for a given range and shows it as a histogram consisting of 25 horizontal bars.
It can also show Point of Control (POC), Developing POC, Value Area/VWAP StdDev High/Low as dynamically moving levels.
Free accounts can't access Standard TradingView Volume Profile, hence this indicator.
There are 3 basic methods to calculate the Value Area for a session.
- original method developed by Steidlmayr (calculated around POC)
- classical method using StdDev (calculated around the mean VWAP)
- another method based on the mean absolute deviation (calculated around the median)
POC is a high volume node and can be used as support/resistance. But when far from the day's average price it may not be as good a trend filter as the other methods.
The 80% Rule: When the market opens above/below the Value Area and then returns/stays back inside for 2 consecutive 30min periods it has 80% chance of filling VA (like a gap).
There are several versions: Free, Free Pro, Free MAX. This is the Free Pro version. The Differences are listed below:
- Free: 30 levels, Buy/Sell/Total Volume Profile views, POC
- Free Pro: 25 levels, +Developing POC, Value Area/VWAP High/Low Levels, Above/Below Area Dimming
- Free MAX: 50 levels, packed to the limit
Features:
- Volume Profile with up to 25 levels (3 implementations)
- POC, Developing POC Levels
- Buy/Sell/Total/Side by Side View modes
- Side Cover
- Value Area, VAH/VAL dynamic levels
- VWAP High/Low dynamic levels with Source, Length, StdDev as params
- Show/Hide all levels
- Dim Non Value Area Zones
- Custom Range with Highlighting
- 3 Anchor points for Volume Profile
- Flip Levels Horizontally
- Adjustable width, offset and spacing of levels
- Custom Color for POC/VA/VWAP levels and Transparency for buy/sell levels
Usage:
- specify max_level/min_level for a range (required in ver 1.0/2.0, auto/optional in ver 3.0 = set to highest/lowest)
- select range (start_bar, range length), confirm with range highlighting
- select mode Value Area or VWAP to show corresponding levels.
- flip/select anchor point to position the buy/sell levels, adjust width and spacing as needed
- select Buy/Sell/Total/Side by Side view mode
- use POC/Developing POC/VA/VWAP High/Low as S/R levels. Usually daily values from 1-3 days back are used as levels for the current day.
- Green - buy volume of a specific price level in a range, Red - sell volume. Green + Red = Total volume of a price level in a range
There's no native support for vertical histograms in Pinescript (with price axis as base)
Basically, there are 4 ways to plot a series of horizontal bars stacked on top of each other:
1. plotshape style labeldown (ver 0 prototype discarded)
- you can have a set of fixed width/height text labels consisting of a series of underscores and moving dynamically as levels. Level offset controls visible length.
- you can move levels and scale the base width of the volume profile histogram dynamically
- you can calculate the highest/lowest range values automatically. max_level/min_level inputs are optional
- you can't fill the gaps between levels/adjust/extend width, height - this results in a half baked volume profile and looks ugly
- fixed text level height doesn't adjust and looks bad on a log scale
- fixed font width also doesn't scale and can't be properly aligned with bars when zooming
2. plot style columns + hist_base (ver 1.0)
- you can plot long horizontal bars using a series of small adjacent vertical columns with level offsets controlling visible length.
- you can't hide/move levels of the volume profile histogram dynamically on each bar, they must be plotted at all times regardless - you can't delete the history of a plot.
- you can't scale the base width of the volume profile histogram dynamically, can't set show_last from input, must use a preset fixed width for each level
- hist_base can only be a static const expression, can't be assigned highest/lowest range values automatically - you have to specify max_level/min_level manually from input
- you can't control spacing between columns - there's an equalizer bar effect when you zoom in, and solid bars when you zoom out
- using hist_base for levels results in ugly load/redraw times - give it 3-5 sec to finalize its shape after each UI param change
- level top can be properly aligned with another level's bottom producing a clean good looking histogram
- columns are properly aligned with bars automatically
3. plot style histogram + hist_base (ver 2.0)
- you can plot long horizontal bars using a series of small vertical bars (horizontal histogram) instead of columns.
- you can control the width of each histogram bar comprising a level (spacing/horiz density). Large enough width will cause bar overlapping and give level a "solid" look regardless of zoom
- you can only set width <= 4 in UI Style - custom textbox input is provided for larger values. You can set width and plot transparency from input
- this method still uses hist_base and inherits other limitations of ver 2.0
4. plot style lines (ver 3.0)
- you can also plot long horizontal bars using lines with level offsets controlling visible length.
- lines don't need hist_base - fast and smooth redraw times
- you can calculate the highest/lowest range values automatically. max_level/min_level inputs are optional
- level top can't be properly aligned with another level's bottom and have a proper spacing because line width uses its own units and doesn't scale
- fixed line width of a level (vertical thickness) doesn't scale and looks bad on log (level overlapping)
- you can only set width <= 4 in UI Style, a custom textbox input is provided for larger values. You can set width and plot transparency from input
Notes:
- hist_base for levels results in ugly load/redraw times - give it 3-5 sec to finalize its shape after each UI param change
- indicator is slow on TFs with long history 10000+ bars
- Volume Profile/Value Area are calculated for a given range and updated on each bar. Each level has a fixed width. Offsets control visible level parts. Side Cover hides the invisible parts.
- Custom Color for POC/VA/VWAP levels - UI Style color/transparency can only change shape's color and doesn't affect textcolor, hence this additional option
- Custom Widh for levels - UI Style supports only width <= 4, hence this additional option
- POC is visible in both modes. In VWAP mode Developing POC becomes VWAP, VA High and Low => VWAP High and Low correspondingly to minimize the number of plot outputs
- You can't change buy/sell level colors (only plot transparency) - this requires 2x plot outputs exceeding max 64 limit. That's why 2 additional plots are used to dim the non Value Area zones
- Use Side by Side view to compare buy and sell volumes between each other: base width = max(total_buy_vol, total_sell_vol)
- All buy/sell volume lengths are calculated as % of a fixed base width = 100 bars (100%). You can't set show_last from input
- Sell Offset is calculated relative to Buy Offset to stack/extend sell on top of buy. Buy Offset = Zero - Buy Length. Sell Offset = Buy Offset - Sell Length = Zero - Buy Length - Sell Length
- If you see "loop too long error" - change some values in UI and it will recalculate - no need to refresh the chart
- There's no such thing as buy/sell volume, there's just volume, but for the purposes of the Volume Profile method, assume: bull candle = buy volume, bear candle = sell volume
- Volume Profile Range is limited to 5000 bars for free accounts
P.S. Cantaloupia Will be Free!
Links on Volume Profile and Value Area calculation and usage:
www.tradingview.com
stockcharts.com
onlinelibrary.wiley.com

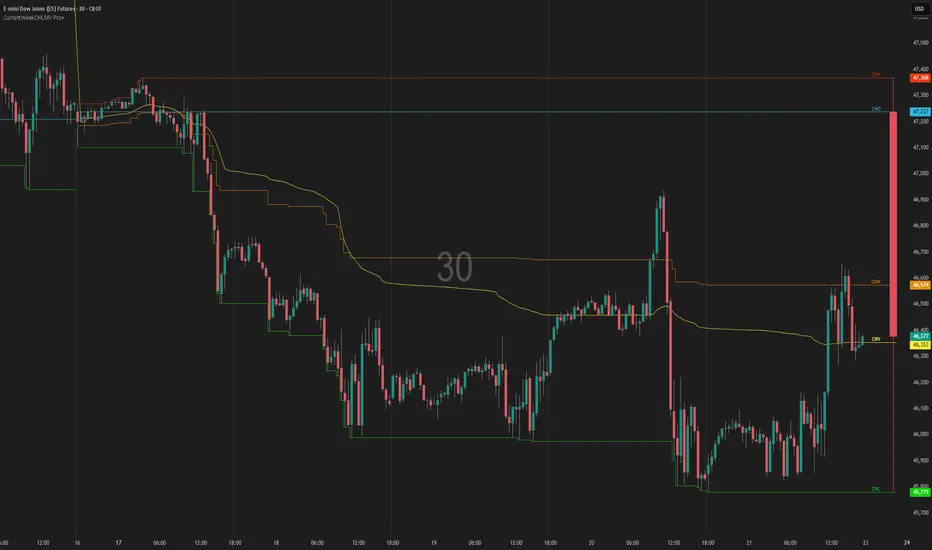
DT 20 200 VWAP Combo v2DT 20 200 VWAP Combo is a simple trend and bias tool that combines three core pieces of context on one chart
• Short term momentum with the 20 EMA
• Higher time frame trend with the 200 EMA
• Value with a flexible anchored VWAP
Use it to quickly answer three questions
What is the bigger picture trend
Where is price trading relative to value
Is my entry idea trading with or against that structure
What this indicator does
Plots a 20 EMA for short term momentum
Plots a 200 EMA for overall trend bias
Plots a VWAP that you can anchor in different ways
Session
Daily
Weekly
Monthly
Yearly
Colors the background when price and EMAs agree with the selected VWAP
Bull zone when 20 EMA is above 200 EMA and price is above VWAP
Bear zone when 20 EMA is below 200 EMA and price is below VWAP
Optionally prints labels when
20 EMA crosses above or below 200 EMA
Price crosses above or below the chosen VWAP
How to use it in your process
Set your VWAP anchor
Session if you are intraday focused
Daily or Weekly if you want a cleaner swing bias
Monthly or Yearly for longer swing context
Use the 200 EMA and anchored VWAP as your higher time frame filter
Only look for longs when price is above both
Only look for shorts when price is below both
Use the 20 EMA as your timing tool
Look for entries in the direction of the background color
Avoid trades that fight both EMAs and VWAP at the same time
This is not a complete trading system by itself
It is a context and confluence tool that works best when combined with your own price action and liquidity model such as structure shifts, sweeps, or a pattern based entry
Nothing in this script is financial advice
Always test and refine any idea in a demo environment and in a written plan before risking real capital

Student Alpha VWAPStudent Alpha VWAP is a flexible, anchor-based VWAP tool designed for traders who want deeper control over intraday and higher-timeframe volume-weighted trend analysis.
The indicator supports multiple anchor types—including Sessions, Weeks, Months, Quarters, Years, and event-based anchors such as Earnings, Dividends, and Splits—allowing VWAP to automatically reset at meaningful market intervals.
The script includes up to three optional VWAP bands. These can be calculated using standard deviation or percentage-based distance, making the tool adaptable for volatility modeling, mean-reversion strategies, or structural trend assessment.
Bands and colors are fully customizable, while an optional filter hides VWAP on 1D+ charts for cleaner high-timeframe layouts.
Features include:
• Event-aware VWAP anchoring (Earnings / Dividends / Splits)
• Standard deviation or percentage-based VWAP bands
• Three independent band multipliers with visual fills
• Automatic timeframe and period detection
• Offset controls and full plot toggle options
This tool aims to give traders a more adaptable, context-aware version of VWAP that fits both systematic and discretionary workflows.
CCI ±100 Price Deviation with SMA & VWAP Trend ColorIndicator Synopsis: CCI ±100 Price Deviation with SMA & VWAP
Purpose:
This indicator combines trend filtering, momentum smoothing, and dynamic price bands to help identify intraday trading opportunities. It’s designed for:
15-minute chart → trend identification
1–2 minute chart → precise entries based on dynamic bands
Components:
SMA of Typical Price (smaTP)
Smooth average of the current bar’s typical price (hlc3).
Acts as a dynamic midpoint for the ±100 deviation bands.
±100 Deviation Bands
Calculated using a modified CCI formula:
Upper = SMA TP + 0.015 × MAD × 100
Lower = SMA TP - 0.015 × MAD × 100
Works as dynamic support/resistance and potential reversal zones.
SMA of CCI length (scaled to price)
Smooths the CCI momentum signal to the price scale.
Acts as a confirmation filter for trade direction near bands.
Optional toggle and customizable color/line width.
VWAP (Volume Weighted Average Price)
Optional overlay with trend-based coloring:
Price above VWAP → bullish → green
Price below VWAP → bearish → red
Acts as primary trend filter.
How to Use the Indicator
Step 1: Determine Trend (15-minute chart)
Check VWAP trend:
Price > VWAP → bullish trend → only consider long trades
Price < VWAP → bearish trend → only consider short trades
Confirm with SMA TP slope:
Rising SMA → bullish bias
Falling SMA → bearish bias
This ensures you only trade in the direction of the intraday trend.

Order-Flow Proxy (VWAP Deviation Zones)Order-Flow Proxy (VWAP Deviation Zones) helps traders visualize when market price moves unusually far away from its Volume-Weighted Average Price (VWAP) — a key fair-value level used by institutional participants.
When price stretches too far above or below VWAP, it often signals temporary imbalance between buying and selling pressure.
This tool highlights those moments using simple color zones and an optional statistical Z-Score filter for deeper precision.
In short: it’s a clean, minimal mean-reversion indicator showing when price is statistically “too far” from fair value.
Red zone → Price extended above VWAP → possible buyer exhaustion or short setup.
Green zone → Price extended below VWAP → possible seller exhaustion or long setup.
VWAP line → Acts as a dynamic fair-value anchor.
Concept:
VWAP combines both price and traded volume to define where most transactions occurred.
Deviations from it — measured either by a fixed distance (1%) or by Z-Score — can reveal overvaluation or undervaluation zones used by professional traders for contrarian setups.
How to use:
Apply the indicator to any intraday chart (1m–1h recommended).
Watch for background color shifts — red or green.
Optionally enable the Z-Score filter to focus only on statistically extreme deviations.
Combine with volume spikes, liquidity sweeps, or your own order-flow tools for confirmation.
Tip:
Best used as a visual overlay for detecting stretched markets and potential reversals.

VipPro VWAP Momentum Tracker — Auto Buy/Sell + Fibonacci TPVipPro VWAP Momentum Tracker is an auxiliary tool designed to complement the main VipPro Realtime indicator.
It is primarily used on lower timeframes to filter false entries and refine intraday precision.
The script combines VWAP (Volume Weighted Average Price) with short-term momentum analysis and Fibonacci-based target projection.
It automatically generates two technical profit levels derived from Fibonacci extensions — 1.27 and 1.61 — providing a structured approach to short-term trade management.
VWAP acts as the dynamic reference line (orange).
When price is above VWAP, it reflects buying pressure and potential long setups.
When price is below VWAP, it suggests selling pressure and potential short opportunities.
The VWAP represents the market’s fair-value zone based on both price and volume, making it one of the most reliable metrics for identifying institutional positioning and volume-weighted trend direction.
This tool can be used independently or in combination with VipPro Realtime, especially when confirming signals from the upper dashboard that summarizes:
Market trend
Liquidity conditions
Momentum strength
RSI and volatility context
Overbought/Oversold signals
Results may vary depending on the trader’s experience and ability to interpret market structure in conjunction with VWAP behavior and momentum alignment.

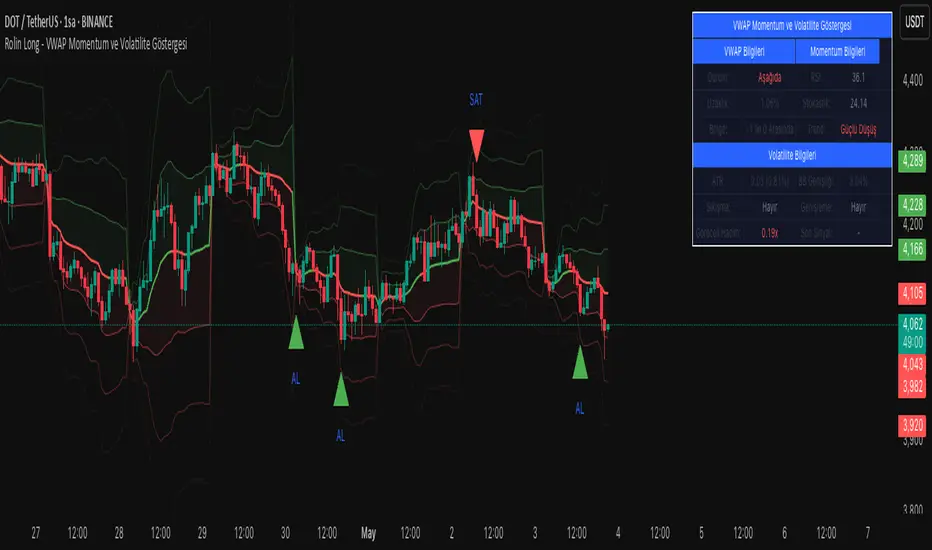
VWAP Momentum and Volatility IndicatorVWAP Momentum and Volatility Indicator
Merges VWAP trend, momentum oscillators (RSI & Stochastic), volatility measures (ATR & Bollinger Bands) and an optional volume filter into one overlay to generate more reliable buy/sell signals.
1) Components & Rationale
VWAP (Session/Day/Week/Month): Shows the volume-weighted average price trend with selectable reset periods.
VWAP ±1/±2/±3 StdDev Bands: Highlight volatility expansions or contractions—price moves outside these bands can signal breakouts or reversals.
RSI (14): Confirms overbought (>70) and oversold (<30) momentum, reducing false entries.
Stochastic (14, SlowK=3, SlowD=3): Captures momentum shifts; used alongside RSI for stronger confirmation.
ATR (14): Measures absolute price movement to aid in risk sizing and contextualizing band widths.
Bollinger Bands (20, 2σ): Identifies “squeeze” (low volatility) and “expansion” phases.
Volume Filter (optional): Ensures signals are backed by above-average volume.
2) Default Settings
VWAP Reset: Session
StdDev Multiplier: 2.0
VWAP Lookback: 20 bars
RSI: 14 period, Overbought = 70, Oversold = 30
Stochastic: 14 period, SlowK = 3, SlowD = 3
ATR: 14 period
Bollinger Bands: 20 period, Multiplier = 2
Volume Filter: 10-bar SMA threshold at 1.5× average
Visuals: VWAP bands, signal markers, and info table enabled; table positioned top-right at small size.
3) How to Use
Add to chart: Select “VWAP Momentum and Volatility Indicator.”
Adjust inputs: Set reset period, band multiplier, momentum thresholds and volume filter to match your asset and timeframe.
Buy signal: Price crosses above VWAP + (RSI < 50 or Stochastic in oversold) + volume filter pass.
Sell signal: Price crosses below VWAP + (RSI > 50 or Stochastic in overbought) + volume filter pass.
Info table: Review VWAP status, distance (%), band region, RSI, Stochastic, ATR%, Bollinger width, squeeze/expansion, relative volume, and the most recent signal.
4) Warnings & Disclaimer
This indicator is provided for educational purposes only. Always backtest with real funding and volume data, apply your own risk management, and recognize that past performance does not guarantee future results. Use the settings and signals as part of a broader trading plan.
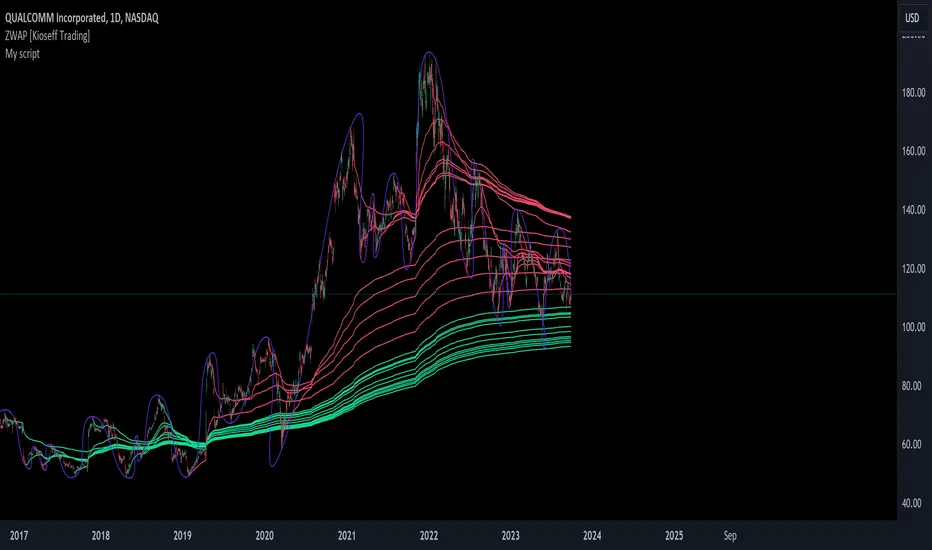
ZWAP (ZigZag Anchored VWAP) [Kioseff Trading]Hello!
Quick script showcasing the new polyline function for Pine Script!
Features
Up to 100 high/low pivot points auto anchored VWAP
Visible range auto anchored VWAP
Curved ZigZag (Adjustable!)
With the new polyline function, auto-anchored VWAP at specific price points is more viable.
When using line.new() only 500 lines can exist on the chart concurrently and, since VWAP is calculated on every update, a "proper" VWAP drawn using line.new() can extend 500 bars at most, to which no additional VWAP lines can be drawn after.
Of course, when using the plot() function a VWAP line will draw on every bar; however, this method isn't highly compatible with auto-anchoring VWAP lines.
However!
A polyline, from beginning to end irrespective of the number of coordinates used, constitutes 1 polyline; 100 can exist simultaneously with 10,000 xy coordinates per line.
The image above shows an attempt to draw the same auto-anchored VWAP lines using the line.new() function. Not an ideal outcome!
The image above shows the same attempt using the polyline.new() function!
Very nice (:
The image above shows the indicator auto anchoring to zig zag turning points.
Subsequent to a new anchoring, VWAP is calculated for the following bars - up to the current bar.
Thank you for checking this out; if you have any ideas to spice it up feel free to comment!
Anchored VWAP+This indicator is an enhanced version of the Anchored VWAP indicator with additional functions:
1. Anchored AP (average price). It removes the volume weighting step in Anchored VWAP, and can display the average price over a period of time. For example, if the price of the stock in the last 3 days is 100, 200, 300, then AP is their average value of 200
2. Anchored AC (average cost). The average cost over time can be displayed. For example, if the price of the stock in the last 2 days is 100,300, then AC is (1+1)/(1/100+1/300)=150
When using the indicator, you need to choose a starting point, then the indicator will start to calculate the subsequent VWAP, AP and AC from this starting point, and draw 3 lines in the graph
These three lines can be regarded as the average cost line of the market, with potential support and resistance effects
We have filled the shadow between VWAP and AP, which can be regarded as a potential support resistance band
===========================中文版本===========================
该指标为增强版本的Anchored VWAP指标。在Anchored VWAP基础上增加了额外功能:
1. Anchored AP。其去掉了Anchored VWAP中成交量加权的步骤,可以显示一段时间的平均价格。举个例子,假如股票最近3天的价格为100,200,300,那么AP为他们的平均值200
2. Anchored AC。可以显示一段时间的平均成本。举个例子,假如股票最近2天的价格为100,300,那么AC为(1+1)/(1/100+1/300)=150
使用指标时你需要先选择一个起点,随后指标将会以该起点开始计算后续的VWAP、AP和AC,并且在图中绘制3根线
这3根线均可以视作是市场的平均成本线,具有潜在的支撑和阻力效果
我们让VWAP和AP之间填充了阴影,该阴影可以视作潜在的支撑阻力带

VWAP Rate of ChangeVWAP Rate of Change Indicator
Description :
The VWAP Rate of Change (ROC) indicator is a tool that can help traders identify the strength of a trend and potential reversal points.
How to Use:
Trend Strength: Traders can use the EMA of the VWAP ROC as an indicator of trend strength. If the oscillator is above 50, it suggests that the trend is bullish, and if it's below 50, it suggests that the trend is bearish.
Overbought/Oversold: Traders can use the VWAP ROC as an overbought/oversold indicator. If the oscillator is above a certain level (e.g., 70), it suggests that the price is overbought, and if it's below a certain level (e.g., 30), it suggests that the price is oversold.
Divergence: Traders can look for divergences between the VWAP ROC and the price. For example, if the price is making higher highs, but the VWAP ROC is making lower highs, it suggests that the trend is losing strength, and a reversal may be imminent.
Confirmation: Traders can use the VWAP ROC as a confirmation indicator for other technical analysis tools. For example, if a trader identifies a potential trade setup using another indicator, they can use the VWAP ROC to confirm the direction of the trend before entering a trade.
Features:
Customizable input variables, including price, length, and VWAP ROC length
Ability to toggle a table to display current VWAP ROC value
Dotted line at the neutral level (50) for easier visualization

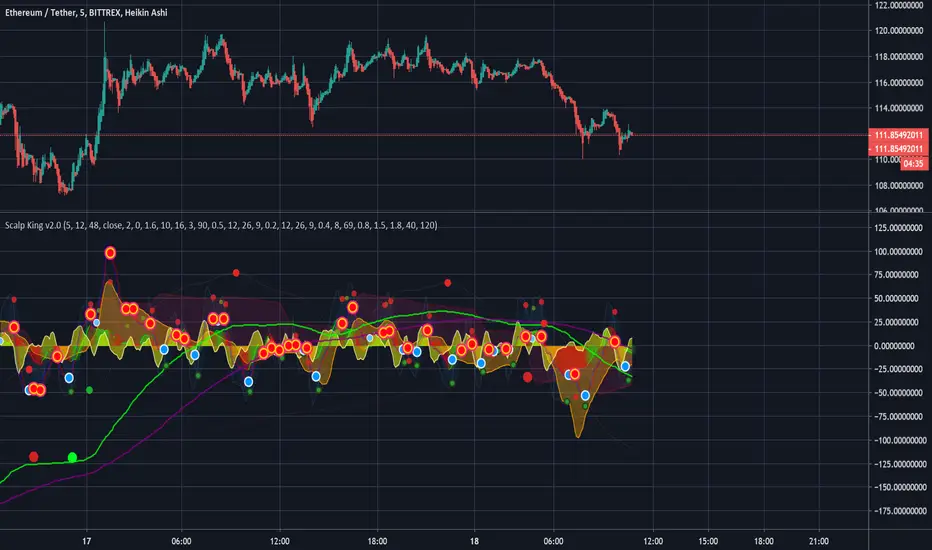
Scalp King v2.0 - Multi-time VWAP, multi-condition alertsMulti time-range VWAP with Multiple condition alerts - version 2.0 - by Viral Killer
This is a script that contains 3 VWAP modes, 5 min, 60 min and 240 min timeframes, all on the same indicator. You add it to the 5 min chart, but seems to work on other ranges.
Usually, when the VWAP wave crosses above, it is a buy signal, although not perfect. This ensures there is also a MAC-D buy confirmation, for a much stronger buy signal.
You can setup SUPER alerts which ensure multiple time ranges line up, before alerting. Some are already built in.
Yellow Wave is 5 min VWAP , crossing from below into positive is a buy signal. Note the word signal, not guaranteed buy.
Orange Wave is 60 min VWAP , crossing from below into positive is a buy signal.
Purple Wave is 240 min VWAP , crossing from below into positive is a buy signal.
The blue wave is 5 the minutes RSI and the other lines are 1h/4h, corresponding to oversold and overbought signals.
U will see a trail of red and blue arrows on the MAC-D, this script knows when the MAC-D is losing power.
Green dots are a buy, dark dots are a sell. Green with orange rim is a weak buy.
If you see 2 or 3 green dots from different time frames very close together, that is a much stronger buy signal. If the MAC-D also agrees, well, it is very strong. This is shown as blue circle white arrow up.
Exit when you see a red cross or red arrow down, RSI overbought and MAC-D crossing down respectively.
You can use multi condition alerts, i.e. alert me to a STRONG BUY when 5 min VWAP crossed above while the 60 min is positive too, aaaand the MAC-D agrees.
Enjoy.
-Viral Killer
Current Week OHLM + VWAPCurrent Week OHLV + Anchored VWAP – Professional Edition
OVERVIEW
Real-time display of the current trading week’s developing Open, High, Low, Close (live), and anchored VWAP with a full-size current-week candle in the right margin.
IMPLEMENTATION & VALUE ADDED
• Live anchored VWAP updated throughout the week as a dynamic anchor
• Full current-week candle rendered in the right margin
• All levels as exportable plots
• Comprehensive alerts on every level and VWAP interaction
HOW TO USE
Apply to daily or intraday charts. The live VWAP serves as the week’s volume-weighted fair value; the right-margin candle gives instant bias and range context.
CREDIT & TRANSPARENCY
Core methodology: public domain (Current Week OHLC + Anchored VWAP).
Independent implementation with original live candle display, exportable plots, and alerting.
DISCLAIMER
For educational and informational purposes only. Not financial advice. Test thoroughly.
VWAP CATS background flipped 4.0VWAP CATS Background Flipped 4.0 is a sophisticated Pine Script v5 indicator for TradingView that combines a configurable moving average (MA) with dynamic Gann Square of 9 levels to create a multi-layered background shading system for price action analysis. It visualizes support/resistance zones around a central MA (often VWAP or RVWAP) using incremental offsets (either % or absolute points), generating symmetrical bands that resemble a "CATS" (Concentric Adaptive Tiered System) — hence the name.The background is "flipped" in the sense that shading intensity and structure emphasize higher-tier zones, and labels are placed to the right of the chart for future projection.Key FeaturesFeature
Description
Multi-MA Engine
Supports 20+ MA types: EMA, DEMA, TEMA, SMA, VWAP, RVWAP, HMA, ALMA, custom volume blends (CVB1–4)
RVWAP Mode
Rolling VWAP with adaptive or fixed time window (days/hours/minutes)
Gann Square of 9 Logic
Generates 80+ symmetric levels (0.25x to 17x increment) above/below the MA
Dual Increment Mode
Choose Percent or Points for spacing
Background Fills
Tiered transparency fills between Gann levels (darker = stronger zones)
Visual MA Offset
Shift MA line left/right without breaking fill alignment
Smart Labels
Projected labels on last bar: "FV", "normal", "high", "3/4" at key levels
Performance Optimized
Hidden plots + label cleanup to prevent lag
Primary Use Cases
1. Institutional VWAP Anchoring
Use RVWAP (1-day fixed) as maRaw
Set Increment = 0.5 points or 0.05%
Watch price interaction with "normal" (2x), "high" (4x), "3/4" (6x) zones
Ideal for intraday scalping on indices (ES, NQ) or forex
2. Swing Trading with Gann Projections
Use 400-period SMA/EMA on daily chart
Increment in Percent mode (~1.22%)
Identify confluence when price rejects at 2x, 4x, or 6x bands
Labels project future targets to the right
3. Volume-Weighted Mean Reversion
Select CVB1–CVB4 for heavy volume smoothing
Use Points mode for stocks with stable tick sizes (e.g. $0.50 increments)
Trade mean reversion between ±1x and ±2x bands
4. Risk Management & Stop Placement
Place stops beyond 2x or 4x bands
Take profits at next major tier (e.g. 4x → 6x)
Pro Tips
Enable "Use Fixed Time Period" for RVWAP to avoid session reset issues
Increase i_label_offset on lower timeframes to avoid overlap
Combine with volume profile or order flow for confluence
The "FV" label marks the Fair Value MA — core anchor
Summary"VWAP CATS Background Flipped 4.0" turns any moving average into a dynamic Gann-based pricing grid with intelligent background shading and forward-projected labels — perfect for institutional-style mean reversion, swing targeting, and risk-defined trading."

Trading Blueprint v7 Pro — VWAP-CVD, cPOC Trend MomentumTBv7 Pro is the advanced release of the Trading Blueprint framework — engineered for institutional-style intraday analysis that fuses VWAP location, CVD orderflow, composite profile bias, and momentum curvature into one cohesive system.
Core Framework
VWAP Structure → Adaptive mean anchored to session VWAP with ±1σ / ±2σ deviation envelopes for dynamic equilibrium detection.
vPOC per bar by ruckard ()
Anchored Volume Profile by DGT ()
CVD Orderflow Divergence → Smoothed delta histogram with fractal pivots identifying hidden absorption and exhaustion (patterns (Bull / Bear Div). Cumulative Volume Delta by AustrianTradingMachine )
cPOC Integration (2-Day Composite) by poopsnag (me :)→ Confirms true acceptance or rejection zones across sessions for precision bias alignment.
TMI (Trend Momentum Indicator by TradingRiot()) → Quantifies slope + mean crossover strength, providing actionable momentum confirmation (bullish / bearish support / divergence).
Bias Dashboard → Displays VWAP bias, numerical score, and dynamic color feedback for at-a-glance trade orientation.
Usage Context
Designed for professionals trading 15 m execution inside 1 h / 4 h context. Ideal for VWAP-cPOC location setups, reversion / continuation scalps, and orderflow confirmation using cumulative delta behavior.
🔧 Modules such as RSI / AO are pre-wired and easily activated for full Trading Blueprint confluence mapping.

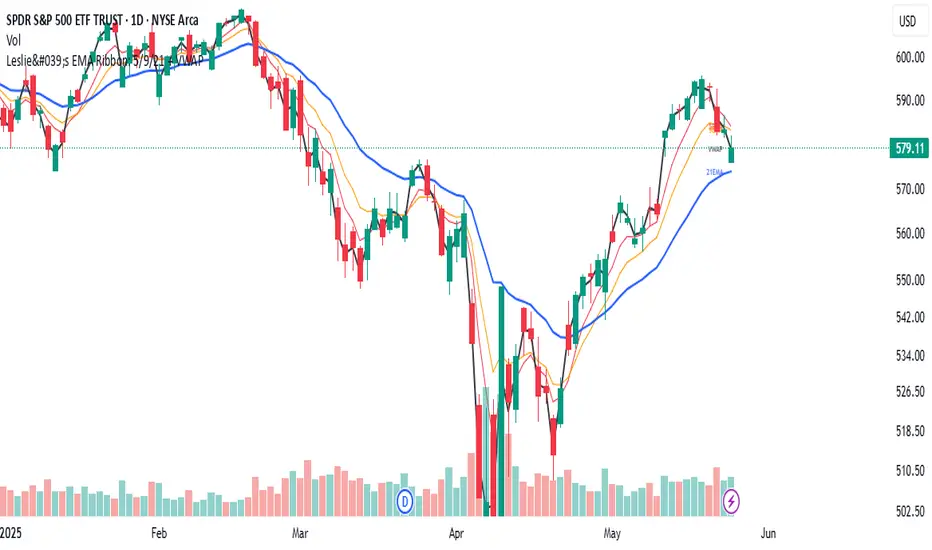
Leslie's EMA Ribbon: 5/9/21 + VWAPEMA + VWAP Crossover Indicator with Alerts
This script blends three Exponential Moving Averages (5, 9, 21) with VWAP to identify momentum shifts and volume-confirmed trend signals. It’s optimized for the Daily timeframe, but also adaptable to shorter-term trading.
🔍 Why this combination?
EMAs provide fast and reliable trend signals:
- 5/9 EMA crossover → short-term shifts (more frequent)
- 9/21 EMA crossover → swing confirmation (less noise)
- VWAP adds volume context used by institutions for fair value tracking.
- 9EMA crossing VWAP confirms price action supported by volume.
Together, these tools offer a multi-layered view of market momentum — combining speed, confirmation, and conviction.
⚙️ Features:
Clean plots with dynamic labels on latest bar
Adjustable line weights for clarity
Alerts included for all crossovers:
- 5EMA / 9EMA
- 9EMA / 21EMA
- 9EMA / VWAP
✅ How to Use:
- Best on the Daily timeframe
- Use 5/9 as early signals, 9/21 for trend filtering, and 9/VWAP for volume-backed setups
- Turn on alerts to stay informed of key shifts without staring at charts
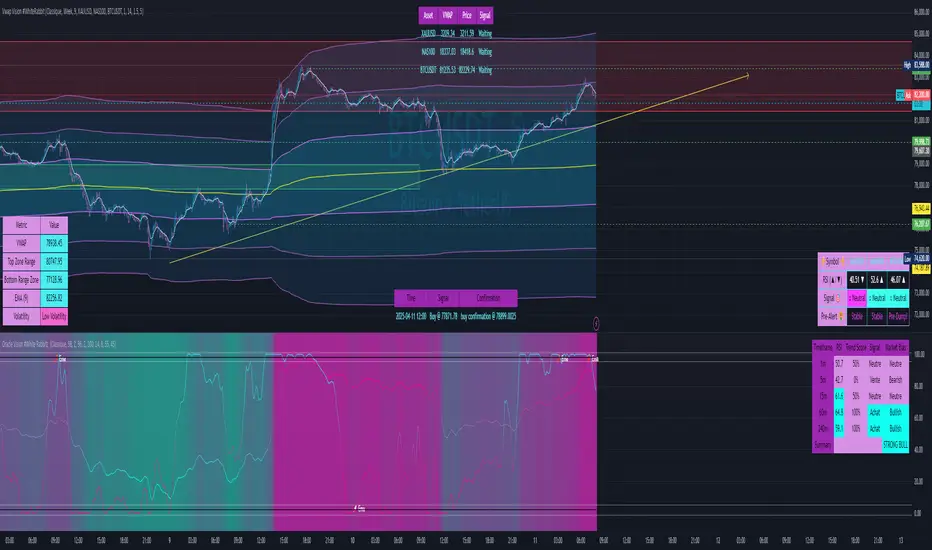
Vwap Vision #WhiteRabbitVWAP Vision #WhiteRabbit
This Pine Script (version 5) script implements a comprehensive trading indicator called "VWAP Vision #WhiteRabbit," designed for analyzing price movements using the Volume-Weighted Average Price (VWAP) along with multiple customizable features, including adjustable color themes for better visual appeal.
Features:
Customizable Color Themes:
Choose from four distinct themes: Classic, Dark Mode, Fluo, and Phil, enhancing the visual layout to match user preferences.
VWAP Calculation:
Uses standard VWAP calculations based on selected anchor periods (Session, Week, Month, etc.) to help identify price trends.
Band Settings:
Multiple bands are calculated based on standard deviations or percentages, with customization options to configure buy/sell zones and liquidity levels.
Buy/Sell Signals:
Generates clear buy and sell signals based on price interactions with the calculated bands and the exponential moving average (EMA).
Real-time Data Display:
Displays real-time signals and VWAP values for selected trading instruments, including XAUUSD, NAS100, and BTCUSDT, along with related alerts for trading opportunities.
Volatility Analysis:
Incorporates volatility metrics using the Average True Range (ATR) to assess market conditions and inform trading decisions.
Enhanced Table Displays:
Provides tables for clear visualization of trading signals, real-time data, and performance metrics.
This script is perfect for traders looking to enhance their analysis and gain insights for making informed trading decisions across various market conditions.