MY_TRENDThe MY_TREND strategy is designed to work with cryptocurrencies and stocks.
The optimal working timeframe is 1 - 4 hours.
The search for trading zones and main entry points is based on the Donchian channel using the author's filtering by pinning.
To avoid manipulations in the market, the algorithm monitors the level of the price relative to the global trend and thus filters out a large part of the false signals.
If the price fixes above the trend line, we expect an upward movement, and if it fixes below, we expect a downward movement.
In addition, in the settings it is possible to use additional trend entries, as well as aggressive trading.
To do this, in the area of action of the main trend, built on the basis of the Donchian channel, a local trend is formed at the moving average price of the asset.
--------------------------------------------
📗 Algorithm for selecting optimal parameters:
--------------------------------------------
1. Disable the use of takes and stops, and set up the setup (described below) so that the back test readings are positive and have growing dynamics.
Pay attention to the level of drawdown and the percentage of correct trades.
2. Enable the use of a stop line, and select the most optimal stop parameters so that the drawdown level on the back test is acceptable for you.
3. Enable the use of takes and select the most optimal take for your strategy.
4. Select the type of trade (described below) and make sure that the back test readings are acceptable to you.
5. By default, the strategy uses a trading commission of 0.04% (standard for crypto futures), but for stocks it should be set in accordance with the commissions of your broker.
-------------------------------------
💹 SETUP SETTINGS:
-------------------------------------
Setup_length - distance for calculating and evaluating volatility in the Donchian channel.
For an older timeframe, it is better to lower the value, otherwise we may get a delay in the reaction of the trend to the price movement.
Setup_mult - multiplier to smooth out the reaction of the trend in the Donchian channel.
For an older TF, it is better to increase the value in order to avoid false entry signals.
Selecting the type of trade:
BASED - gives trading signals only when the basic trend changes (trading without additional entry signals).
IN_TREND - gives BASED trading signals and additional signals on the underlying trend, using the ADD SMA as a local trend indicator.
AGRESSIVE - gives BASED trading signals and additional signals on the underlying trend, when the price falls below the ADD SMA local trend line.
ADD SMA length - SMA period to form a local trend within the underlying Donchian trend (values in the range of 3-9 should be used to get a fast response).
This setting is relevant for IN_TREND and AGRESSIVE trading types.
-------------------------------------
🟢 TAKE SETTINGS:
-------------------------------------
The strategy has 3 types of take:
ATR - take based on the instrument's volatility value (adjusted by a multiplier).
FIX - take, set as a percentage (set manually).
STDEV - take, based on the calculation of the standard deviation of the price (adjusted by a multiplier and a period).
-------------------------------------
⛔️ STOP SETTINGS:
-------------------------------------
The strategy has 3 types of stops:
ATR - stop based on the instrument's volatility value (adjustable by a multiplier).
FIX - stop specified in percentage (set manually).
TREND - the stop line is equal to the base trend line.
It is possible to turn on the stop line tightening to the level of the price of entry into a position, when the price passes the value of one standard deviation into profit.
-------------------------------------
💡 OTHER USEFUL FEATURES
-------------------------------------
✅ In the strategy, you can enable / disable the use of takes and stop lines.
✅ In the strategy, you can enable / disable the display of the base and local trend lines, and enable the background highlighting of the current trend.
✅ You can choose the direction of trading: long, short or any.
✅ Leverage can be set (x3 by default).
✅ The screen has a compact display of a table with the current strategy settings and the current state (position, takes, stop).
For the convenience of saving your settings, use the standard PrintScreen function.
✅ You can sign the strategy in the Notes field - this is convenient if you place several versions of the MY_TREND strategy on the chart with different settings (for different pairs or for different timeframes).
✅ You can choose the type of alerts - ALERT or BOT.
ALERT - tradingview pop-up trading alerts (you can configure them to be sent to e-mail or to the application).
BOT - trading commands following the Binance/Finandy syntax, designed to be sent to a trading bot using a webhook.
To use alerts, select "Only when the alert() function is called"
✅ 👉 In the strategy settings, each field has hints, to do this, hover over the ⓘ sign
💰 Be sure to follow the risk management when trading!
-------------------------------------
The MY_TREND strategy is private! You can get test access to it for 24 hours.
👉 In order to gain access or ask questions, write to me in private messages or at the contacts indicated in my signature.
-------------------------------------
========================================================================================================
Стратегия MY_TREND предназначена для работы с криптовалютами и акциями.
Оптимальный рабочий таймфрейм 1 - 4 часа.
Поиск торговых зон и основных точек входа производится на базе канала Donchian используя авторскую фильтрацию по закреплению.
Чтобы избежать манипуляций на рынке, алгоритм отслеживает уровень нахождения цены относительно глобального тренда и тем самым фильтрует немалую часть ложных сигналов.
При закреплении цены выше трендовой, мы ожидаем восходящее движение, а при закреплении ниже - нисходящее.
Кроме этого в настройках есть возможность использовать дополнительные входы по тренду, а также агрессивную торговлю.
Для этого в зоне действия основного тренда, построенного на базе канала Donchian, формируется локальный тренд по средней скользящей цены актива.
-----------------------------------------
📗 Алгоритм подбора оптимальных параметров:
-----------------------------------------
1. Отключите использование тейков и стопов, и настройте сетап (ниже подробно описано) так, чтобы показания бэк-теста были положительными и имели растущую динамику.
Обращайте внимание на уровень просадки и процент верных сделок.
2. Включите использование стоп-линии, и подберите наиболее оптимальные параметры стопа так, чтобы уровень просадки на бэк-тесте был для Вас приемлемым.
3. Включите использование тейков и подберите наиболее оптимальный тейк для Вашей стратегии.
4. Выберите тип торговли (ниже описано) и убедитесь в приемлемых для Вас показаниях бэк-теста.
5. По умолчанию в стратегии используется торговая комиссия 0,04% (стандартно для крипто-фьючерсов), но для акций её следует выставить в соответствии с комиссиями Вашего брокера.
-------------------------------------
💹 НАСТРОЙКА СЕТАПА:
-------------------------------------
Setup_length - дистанция для расчета и оценки волатильности в канале Donchian.
Для более старшего ТФ, значение лучше понижать, иначе мы можем получить запаздывание реакции тренда на движение цены.
Setup_mult - множитель, для сглаживания реакции тренда в канале Donchian.
Для более старшего ТФ, значение лучше повышать, чтобы избежать ложных сигналов на вход.
Выбор типа торговли:
BASED - даёт торговые сигналы только при смене базового тренда (торговля без дополнительных сигналов на вход).
IN_TREND - даёт торговые сигналы BASED и дополнительные сигналы по базовому тренду, используя ADD SMA как индикатор локального тренда.
AGRESSIVE - даёт торговые сигналы BASED и дополнительные сигналы по базовому тренду, при просадке цены ниже линии локального тренда ADD SMA.
ADD SMA length - Период SMA для формирования локального тренда внутри базового тренда Donchian (следует использовать значения в диапазоне 3-9, для получения быстрой реакции).
Данная настройка актуальна для типов торговли IN_TREND и AGRESSIVE.
-------------------------------------
🟢 НАСТРОЙКА ТЕЙКОВ:
-------------------------------------
Стратегия имеет 3 типа тейка:
ATR - тейк на базе значения волатильности инструмента (регулируется множителем).
FIX - тейк, заданный в процентах (задаётся вручную).
STDEV - тейк, на базе расчёта стандартного отклонения цены (регулируется множителем и периодом).
-------------------------------------
⛔️ НАСТРОЙКА СТОПА:
-------------------------------------
Стратегия имеет 3 типа стопа:
ATR - стоп на базе значения волатильности инструмента (регулируется множителем).
FIX - стоп, заданный в процентах (задаётся вручную).
TREND - стоп-линия равна базовой линии тренда.
Есть возможность включить подтяжку стоп-линии на уровень цены входа в позицию, при прохождении цены значения одного стандартного отклонения в профит.
-------------------------------------
💡 ПРОЧИЕ ПОЛЕЗНЫЕ ФУНКЦИИ
-------------------------------------
✅ В стратегии можно включить/отключить использование тейков и стоп-линии.
✅ В стратегии можно включить/отключить отображение линии базового и локального тренда, а включить фоновую подкраску текущего тренда.
✅ Можно выбрать направление торговли: лонг, шорт или любое.
✅ Можно установить кредитное торговое плечо (по умолчанию x3).
✅ На экране есть компактное отображение таблицы с текущими настройками стратегии и текущим состоянием (позиция, тейки, стоп).
Для удобства сохранения своих настроек - воспользуйтесь стандартной функцией PrintScreen.
✅ Вы можете подписать стратегию в поле Notes - это удобно, если Вы размещаете на графике несколько версий стратегии MY_TREND с разными настройками (для разных пар или для разных ТФ).
✅ Вы можете выбрать тип оповещений - ALERT или BOT.
ALERT - всплывающие торговые оповещения tradingview (можно настроить их отправку на e-mail или в приложение).
BOT - торговые команды с соблюдением синтаксиса Binance/Finandy, предназначенные для отправки их торговому боту с помощью webhook.
Для использования оповещений выбирайте "Только при вызове функции alert()"
✅ 👉 В настройках стратегии у каждого поля есть подсказки, для этого наведите курсор на знак ⓘ
💰 Обязательно соблюдайте риск-менеджмент при торговле!
-------------------------------------
Стратегия MY_TREND является закрытой! Вы можете получить к ней тестовый доступ на 24 часа.
👉 Для того, чтобы получить доступ или задать вопросы пишите мне в личные сообщения или по контактам, указанным в моей подписи.
-------------------------------------
在脚本中搜索"alert"

Ebb N Flo Trend [Backtester]Ebb n Flo Trend is a trend indicator that makes use of higher time frame High - Low pivots to determine when a trend has changed
In order to reduce over trading, and to reduce fake outs, the script relies on a clever combination of Fib ratio expansions and an averaged candle close
By combining the above strategies, the trend indicator forms a trailing trend indicator
The script determines when the current market condition has crossed over or under the trailing trend, and based on the closing conditions will change the trend of the script signaling a change. If the trend indicator is below the current market and green, the trend is bullish. If the trend is above the market and red, the trend is bearish
The indicator does not repaint, as such, once a signal has been received, the condition has been met on a previous candle and is final
Trend indicator can be used on any markets, for both Long and Short swings, however is best suited for long term trading on certain crypto markets (based on backtesting results). Be on the lookout for pairs with decent volume on reputable exchanges. It is not a holy grail type script for all markets. The key is to find enough to diversify your trades.
As can be seen in the backtester results, the script performs exceptionally well when trading using the 1W higher time frame (selection in the script settings), in the 1D current time frame (selecting the chart time frame)
The script is ideal for the beginner trader that cannot spend hours everyday looking at charts.
The backtesting results are based on allocating 10% of your portfolio to a single trade - this should be determined by your risk appetite.
There are risks associated with any form of investing. Never invest more than you are willing to lose. Past performance is not a guarantee or predictor of future performance. Do your own due diligence before making any investment decisions.
Configuration:
The dropdown in the script selects the time frame for Highs and Lows that the script must consider, and the chart time frame is the time frame of which closing conditions the script should use
Alerts:
The indicator comes with 2 off alerts: open_LONG and open_SHORT, which in itself is self explanatory, however, due to the slow trading nature of the script, alerts are generally not needed
Once you receive access to the trial version, you will also receive a link to a video that will show you exactly how to set up the script
Happy trading

TradingGroundhog - Fundamental Bot Automation - Fractal/Wave -V1PLEASE READ THE DESCRIPTION - AS THE SCRIPT IS USED FOR AUTOMATION AND TRADING PAIR SWITCH THE MECHANISM CAN BE COMPLICATED TO UNDERSTAND
#-- Pairs Switching - No Repaint - Fractals - Wavetrend --
This strategy uses my fractal/wavetrend previous methods in order to buy/sell.
However, it has been designed in order to switch automatically the pairs on which it trades to reduce the loss and risk.
#-- Synopsis --
To do so, the script uses a Daily wavetrend oscillator. The oscillator is used to find uptrend periods.
From it, the number of uptrend days are counted.
#-- Wavetrend --
For exemple, if BTC/EUR goes from downtrend to uptrend, the script will start to count since how many days the market is uptrend.
Then, if BTC/EUR goes from uptrend to downtrend, the counter will be reset to 0.
The script only trades during uptrend periods.
#-- Pairs --
Up to 35 pairs can be used at the same time. The user can enable of disable to trade on certain pairs.
Uptrend days are counted for each one of those pairs. The user can define on how many pairs the script can trade at the same time.
The select which pairs will be trade, the script sort all the enabled pairs based on their uptrend days counters.
#-- Trade organization --
For exemple if we set 5, as the number of maximum pairs to trade on.
Trades will be conducted on the 5 pairs being in uptrend for the longest time.
Therefore, to organize the money placement on each pair, the equity is used.
For 100% of equity, 10% are kept if losing trades occur.
The remaining 90% are divided by the number of maximum pairs to trade on.
If we chose 5, we will have (90/5) 18% of our capital placed in each bot.
#-- Setting it --
As explained before, this script is used for automation.
For exemple, lets say you are interested by 15 pairs with promising evolution and you set the number of maximum pairs to trade on to 5.
You will have to set alerts for the script on each of the 15 pairs.
You will receive alerts for when to buy and sell.
Note that the script has to be set for each of the selected pairs, it is not able to trade on 15 pairs (thus, webpages) if only set on one Tradingview webpage.
#-- Plot--
Once launch, you can see a plot.
The plot represent the Uptrend days counter for 20 pairs. It also project the organization of the ENABLED pairs.
If a pair is part of the one with the highest number of uprend days. It's name will be displayed under the plot in a yellow comment box.
Four other box are projected to the right of the plot:
White comment : All the pairs sorted from highest number of uptrend days to the lowest.
Red comment : Pairs with the lowest number of uptrend days.
Blue comment : Interesting pairs which will may be uptrend for a long time.
Green comment : Actual pairs with active trading (thus, the pairs with the maximum number of uptrend days)
#-- Bot automation --
If you use 3commas or other trading bot platforms, you will have to set as comments the BUY/SELL alerts. <= Which is what I am doing with it.
Doing so make you trade on multiple pairs, automatically.
However, you will need to set as input the 3commas signal.
For the moment, the script will be needed for it.
However, I will soon release a V2 taking as input the 3commas strategy comments.
For the moment, you can set the script in different webpages and follow BUY/SELL orders by eyes of alerts. ;)
#-- Parameters --
*** Parameters have been intensively optimized using 35 cryptocurrency pairsin order to have potent efficiency for each of them. I would recommend to only change the METHOD SETTINGS. For the others, I don't recommend any modifications. If you need precision on the other parameters of if you want to modify them, more informations can be found in my previous scripts and ***
Filtering method :
Used to reduce or not the risks. If you set Wavetrend, less trades will be conducted as the wavetrend filter from will be used. If you choose Fractal, no Wavetrend signals will be used.
(I prefer to use Fractal as I am using 1 or 3 minutes timeframes for the moment.)
Market Pairs : You can select on which markets the script will trade by enabling it's checkbox.
*** Also, for the moment, due to Pinescript limitation, I cannot set as input the number of active pairs. So I set 5, after optimization, as the default number of maximum pairs to trade on. Thus, you should open webpage for each ENABLED pairs and load the script in each on them. 5 Tradingview webpage will always be active. ***
#-- Timeframe --
You can use the script for Short or Long term trading:
For Short term, you will have to use 1 or 3 minutes timeframes, depending on the volatility of the market. (What I am using)
For Long term, you will have to use 5 or 15 minutes timeframes, depending on the volatility of the market.
#-- Strategy abilities and results for more than a month of activity -- *** !!! IMPORTANT SECTION !!! ***
I have simulated the profit for the 21 ACTIVE pairs I selected has been potent with my Fractal strategy. Different maximum number of trading pairs were used in order to find the best one. The script was run for the last 46 or 30 days.
Different timeframe have been used as pairs have different volatility.
*** If you use the script, SET IT UP with the following pairs and the following timeframes. ***
-------------------------------------------------------------------------------------------------------
Parameters | Maximum number of trading pairs
-------------------------------------------------------------------------------------------------------
Timeframe | Pairs | 1 2 3 5 6 10
-------------------------------------------------------------------------------------------------------
3M | SHIB | 0 0.98 3.63 2.17 2.56 2.56
1M | SOL | 0 1.5 1.08 1.26 0 0
3M | XRP | 10.5 4.56 3.29 2.19 1.52 1.52
3M | ETH | 9.94 6.97 4.55 3.45 2.19 2.19
3M | BTC | 1.7 2.32 1.74 1.88 1.33 1.33
3M | DOT | 0 3.5 2.32 2.27 1.99 1.99
1M | DOGE | 0 0 0 3.14 1.93 1.93
1M | LUNA | 0 0 0 0.23 2.35 2.35
3M | AVAX | 8.92 0 0.53 3.63 1.17 1.17
1M | HOT | 0 0 2.12 7.96 4.69 4.69
3M | GRT | 0 -1.09 -0.82 0.25 -0.191 0
1M | LINK | 0 0 0 0 0 0
1M | CHZ | 0 0 0.4 0.85 1.89 1.91
3M | WIN | 0 0 0.52 5.89 2.8 2..8
3M | ENJ | 32.63 15.65 12.55 10.31 5.62 5.62
3M | RUNE | 0 4.68 3.42 -1.18 2.3 2.3
3M | LTC | 0 -0.06 1.1 1.29 3.49 3.49
3M | BTT | 0 0 0 0.85 1.63 1.63
3M | BCH | 0 0 0 1.36 2.36 2.36
3M | WRX | 0.26 4.66 5.36 4.29 3.01 3.01
3M | ETC | -0.92 0 0 3.6 3.31 3.56
-------------------------------------------------------------------------------------------------------
Net profit % | 63.03 43.67 37.24 55.69 45.949 43.61
Number of days | 46 30 30 46 46 46
Net profit % per day | 1.38 1.46 1.25 1.22 1.00 0.95
-------------------------------------------------------------------------------------------------------
*** Therefore, we are around more than 1% per day in each case. ***
#-- Choosing pairs --
I selected the 35 cryptocurrencies which can be exchange with EUR and evaluated the ability of my Fractal script on them. The on which have been ENABLED (true) are the best.
BINANCE:SHIBEUR | true
BINANCE:SOLEUR | true
BINANCE:XRPEUR | true
BINANCE:ETHEUR | true
BINANCE:BTCEUR | true
BINANCE:DOTEUR | true
BINANCE:ENJEUR | true
BINANCE:DOGEEUR | true
BINANCE:LUNAEUR | true
BINANCE:VETEUR | false
BINANCE:BNBEUR | false
BINANCE:AVAXEUR | true
BINANCE:HOTEUR | true
BINANCE:EGLDEUR | false
BINANCE:GRTEUR | true
BINANCE:MATICEUR | false
BINANCE:LINKEUR | true
BINANCE:CHZEUR | true
BINANCE:ICPEUR | false
BINANCE:UNIEUR | false
BINANCE:WINEUR | true
BINANCE:ADAEUR | false
BINANCE:RUNEEUR | true
BINANCE:TRXEUR | false
BINANCE:THETAEUR | false
BINANCE:EOSEUR | false
BINANCE:LTCEUR | true
BINANCE:XLMEUR | false
BINANCE:BTTEUR | true
BINANCE:SXPEUR | false
BINANCE:LAZIOEUR | false
BINANCE:YFIEUR | false
BINANCE:BCHEUR | true
BINANCE:WRXEUR | true
BINANCE:ETCEUR | true

3Commas BotBjorgum 3Commas Bot
A strategy in a box to get you started today
With 3rd party API providers growing in popularity, many are turning to automating their strategies on their favorite assets. With so many options and layers of customization possible, TradingView offers a place no better for young or even experienced coders to build a platform from to meet these needs. 3Commas has offered easy access with straight forward TradingView compatibility. Before long many have their brokers hooked up and are ready to send their alerts (or perhaps they have been trying with mixed success for some time now) only they realize there might just be a little bit more to building a strategy that they are comfortable letting out of their sight to trade their money while they eat, sleep, etc. Many may have ideas for entry criteria they are excited to try, but further questions arise... "What about risk mitigation?" "How can I set stop or limit orders?" "Is there not some basic shell of a strategy that has laid some of this out for me to get me going?"
Well now there is just that. This strategy is meant for those that have begun to delve into the world of algorithmic trading providing a template that offers risk defined positions complete with stops, limit orders, and even trailing stops should one so choose to employ any of these criteria. It provides a framework that is easily manipulated (with some basic working knowledge of pine coding) to encompass ones own ideas and entry criteria, while also providing an already functioning strategy.
The default settings have a basic 1:1 risk to reward ratio, which sets a limit and a stop equal distance from the entry. The entry is a simple MA cross (up for long, down for short). There a variety of MA's to choose from and the user can define the lengths of the averages. The ratio can be adjusted from the menu along with a volatility based adder (ATR) that helps to distance a stop from support or resistance. These values are calculated off the swing low/high of the user defined lookback period. Risk is calculated from position entry to stop, and projected upwards to the limit as a function of the desired risk to reward ratio. Of note: the default settings include 0.05% commissions. Competitive commissions of the leading cryptocurrency exchanges are .1% round trip (one buy and one sell) for market orders. There is also some slippage to allow time for alerts to be sent and orders to fill giving the back test results a more accurate representation of real time conditions. Its recommended to research the going rates for your exchange and set them to default for the strategy you use or build.
To get started a user would:
1) Make a copy of the code and paste in their bot keys in the area provided under the "3Comma Keys" section
- eg. Long bot "start deal" copied from 3commas in to define "Long" etc. (code is commented)
2) Place alert on desired asset with desired settings ensuring to select "Order fills and alert() function calls"
3) Paste webhook into the webhook box and select webhook URL alerts (3rd party provided webhook)
3) Delete contents of alert message box and replace with {{strategy.order.alert_message}} and nothing else
- the codes will be sent to the webhook appropriately as the strategy enters and exits positions. Only 1 alert is needed
settings used for the display image:
1hr chart on BTCUSD
-ATR stop
-Risk adjustment 1.2
-ATR multiplier 1.3
-RnR 0.6
-MAs HEMA/SMA
-MA Length 50/100
-Order size percent of equity
-Trail trigger 60% of target
Experiment with your own settings on your crypto of choice or implement your own code!
Implementing your trailing stop (optional)
Among the options for possible settings is a trailing stop. This stop will ratchet higher once triggered as a function of the Average True Range (ATR). There is a variable level to choose where the user would like to begin trailing the stop during the trade. The level can be assigned with a decimal between 0 and 1 (eg. 0.5 = 50% of the distance between entry and the target which must be exceeded before the trail triggers to begin). This can allow for some dips to occur during the trade possibly keeping you in the trade for longer, while potentially reducing risk of drawdown over time. The default for this setting is 0 meaning unless adjusted, the trail will trigger on entry if the trailing stop exit method is selected. An example can be seen below:
Again, optional as well is the choice to implement a limit order. If one were to select a trailing stop they could choose not to set a limit, which could allow a trail to run further until hit. Drawdowns of this strategy would be foregoing locking gains at highs on target on other trades. This is a trade-off the user can decide on and test. An example of this working in favor can be observed below:
Conclusion
Although a simple strategy is implemented here, the benefits of this script allow a user a starting platform to build their strategies from with built in risk mitigation. This allows the user to sidestep some of the potential difficulties' that can arise while learning Pine and taking on the endeavor of automating their trading strategies. It is meant as an aid, a structure, and an educational piece that can be seen as a "pick-up-and-go" strategy with easy 3Commas compatibility. Additionally, this can help users become more comfortable with strategy alert messages and sending strings in the form of alerts from Pine. As well, FAQs are often littered with questions regarding "strategy.exit" calls, how to implement stops. how to properly set a trailing stop based on ATR, and more. The time this can save an individual to get started is likely of the best "take-aways" here.
Happy trading

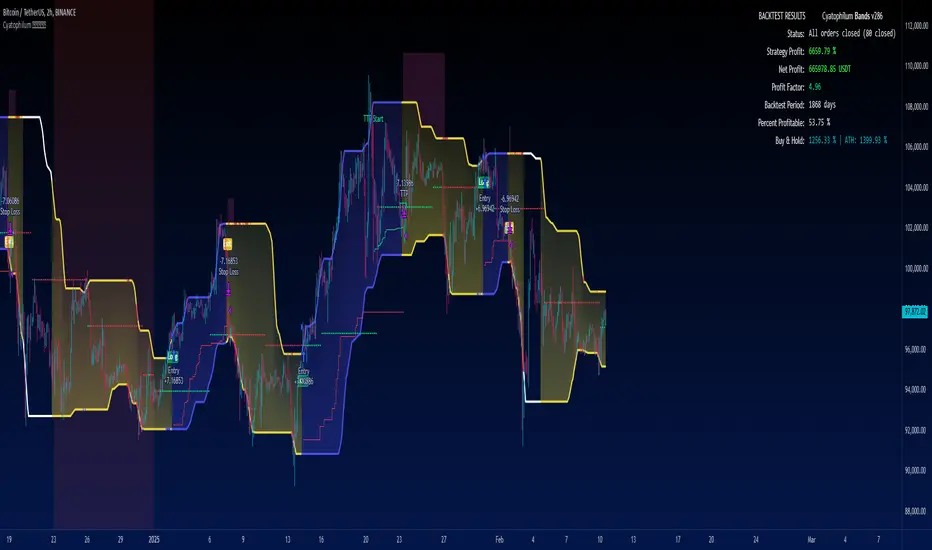
Cyatophilum Bands Definitive Edition█ OVERVIEW
A Swing Trade indicator providing backtest and alerts which can be used as a long, short or reversal strategy.
Its main goal is to catch breakouts and huge moves, and to try and beat the Buy & Hold Return.
█ CONCEPTS
The strategy consists of a unique custom indicator that works like this:
A Smoothed Donchian Channel combined with a consolidation check will trigger an entry.
The entry is then guided by a faster channel used as a trailing stop.
█ HOW TO USE
The most effective way to use this indicator is on high timeframes, from 2H to 1D.
The recommended pairs are trending pairs with consolidation areas. Yes, I'm especially looking at crypto.
The first appproach would be to catch long and short breakouts, and ride the trend using the trailing stop.
Adjust the Bands wisely to trigger entries at the right time.
The second approach is to go longs only, and try to beat the Buy & Hold return.
For this, click "Go long" and use an order size of 100% equity. Then adjust the Bands, trailing stop and chart timeframe.
The Buy & Hold comparator will come handy when backtesting.
█ INDICATOR SETTINGS
Strategy Direction
Choose wether to go long only, short only or both directions.
Bands Configuration
The bands lookback, smoothing and consolidation % are used to change the behavior of the bands. More info in the settings tooltips.
Trailing Stop
The "speed" of the trailing stop can be configured, allowing more or less room for the price to move before exiting.
Volume Condition
In addition to the consolidation condition, you can add a volume check to your entry. Is the volume rising or not? Useful in most scenarios.
Exit Alert Type
If you want to receive alerts during bars or prefer to ignore wicks.
Backtest Settings
This is where you choose the backtest period which is also used to calculate the B&H return.
Graphics
The configuration panel with all the indicator settings backtest info.
The buy & Hold Comparator is an additional panel that turns green when the strategy's return is greater than the Buy & Hold return.
Note: The Strategy Return is the strategy netprofit + the strategy openprofit.
█ ALERTS
Configure your alert messages for all events in the indicator settings.
Then click "Add Alert". In the popup window, select the option "alert() function calls only", give the alert a name and you are good to go!
█ BACKTEST RESULTS
The backtest settings used in this snapshot are the following:
Initial Capital: 10 000$
Order size: 100% equity (It indeed compounds and this is intended since the main goal of the strategy is to compare to Buy & Hold return)
Commission: 0.1%
Slippage : 10 ticks
The Indicator settings used for this are shown in the main chart above.
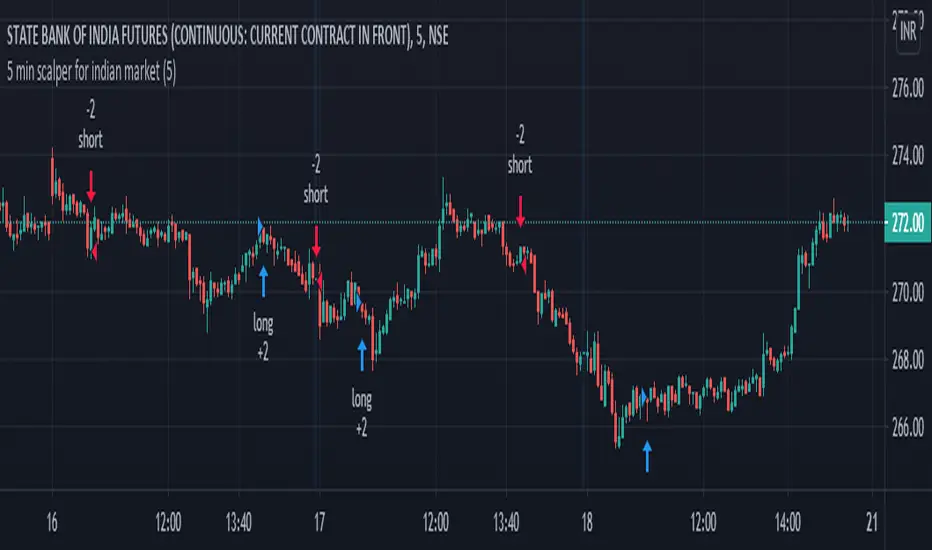
5 min scalper for indian marketHi friends....publishing 5 min scalper for indian market... which shows the movement of price over time and how strong those movements are/will be, regardless of the direction the price moves, up, or down. Indicator specifically useful, as it helps traders and analysts spot points where the market can and will reverse by providing signals long (buy) and short (sell). Show the relative strength of price movements but leave out the directionality of the price movements, best utilized in combination with other technical indicators – such as trend lines and moving averages – which show price trends and directions. Having an alert feature to make aware market players from signals provided by strategy.
It analyz underlying volume and shows buy and sell signal...
U also can modify algo length ..
some tips for new traders to become successful trader
1: always follow risk management...
2: every stock/ forex / crypto has it own cycle.. So pls dont jump from one stock / forex pair to another when u hear some stock / crypto has
made new high or low... Bcs after that consolidation period starts.. During consolidation we can not make more profit as in trending market.. So be patient when u had made some position or tarde in one stock/ pair...
3 : we dont require to trade in every stocks / forex/crypto.. Just one stock and pair trading daily make u profitable beyond ur expection.. Bcs
trading in one stock / forex pair.. make u very comfortable and u may always know its movement... And u also trade in every cycle of this
stock/ pair.. So u also trdae its trend days which made highest profit. We dont know when is trend of any stock... Compare with it
business... Trading is business not one day rich game... Its business... It takes time and u have to do same thing agian and again to become
sucessfull trader for this u can use tradingview alerts. .for that u dont need to seat infrot of ur terminal screen.. u can also do algo trading
by using tradingview alerts
4 : By following risk management and incerase lot size as profit increased... This is the key 🔑 of sucess in stocks / forex / crypto market.
I thinks this tips may help new trader. U can modified according to ur trading style..
You can personal message me if u want to use this strategy
******************if u want to use this indicator u can personal message me********************************************************
HEINKI ASHI SUPERTRENDHi friends....publishing Heikin ashi supertrend strategy... which shows the movement of price over time and how strong those movements are/will be, regardless of the direction the price moves, up, or down. Indicator specifically useful, as it helps traders and analysts spot points where the market can and will reverse by providing signals long (buy) and short (sell). Show the relative strength of price movements but leave out the directionality of the price movements, best utilized in combination with other technical indicators – such as trend lines and moving averages – which show price trends and directions. Having an alert feature to make aware market players from signals provided by strategy.
HA charts are a great way to help those who can be spooked by the chaos of the markets (I'm one!), but they have a big drawback in that the price you see on a HA candle is often significantly different from the real price that you would trade on. This brings issues of unrealistic expectations of profits/losses, and also makes back testing a strategy very difficult. I still wouldn't recommend ever using TradingView's "strategy" tool when using HA charts, but using this indicator you can do accurate back tests.
***************This uses Heikin Ashi Candles as source on normal chart..dont use it on heikin ashi chart*****************************
There is an option for use normal japanes candle supertrend..so we can compare how this heikin ashi prevent false trades.
some tips for new traders to become successful trader
1: always follow risk management...
2: every stock/ forex / crypto has it own cycle.. So pls dont jump from one stock / forex pair to another when u hear some stock / crypto has
made new high or low... Bcs after that consolidation period starts.. During consolidation we can not make more profit as in trending market.. So be patient when u had made some position or tarde in one stock/ pair...
3 : we dont require to trade in every stocks / forex/crypto.. Just one stock and pair trading daily make u profitable beyond ur expection.. Bcs
trading in one stock / forex pair.. make u very comfortable and u may always know its movement... And u also trade in every cycle of this
stock/ pair.. So u also trdae its trend days which made highest profit. We dont know when is trend of any stock... Compare with it
business... Trading is business not one day rich game... Its business... It takes time and u have to do same thing agian and again to become
sucessfull trader for this u can use tradingview alerts. .for that u dont need to seat infrot of ur terminal screen.. u can also do algo trading
by using tradingview alerts
4 : By following risk management and incerase lot size as profit increased... This is the key 🔑 of sucess in stocks / forex / crypto market.
I thinks this tips may help new trader. U can modified according to ur trading style..
You can personal message me if u want to use this strategy
******************if u want to use this indicator u can personal message me********************************************************

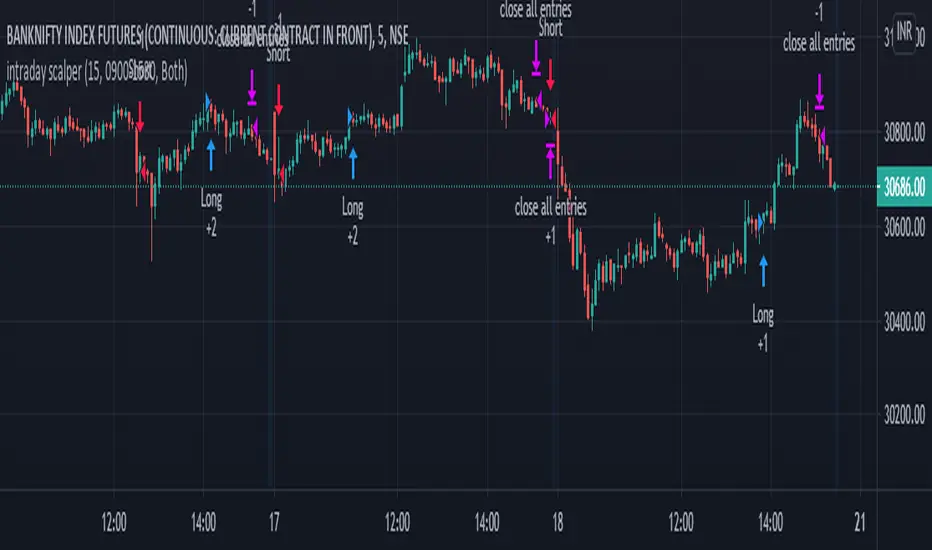
intraday scalper with stopHi friends....publishing intraday scalper which shows the movement of price over time and how strong those movements are/will be, regardless of the direction the price moves, up, or down. Indicator specifically useful, as it helps traders and analysts spot points where the market can and will reverse by providing signals long (buy) and short (sell). Show the relative strength of price movements but leave out the directionality of the price movements, best utilized in combination with other technical indicators – such as trend lines and moving averages – which show price trends and directions. Having an alert feature to make aware market players from signals provided by the indicator.
u can start and close your trades at your define period. Use full for stockmarkets, mcx and forex because all movement occur in new York session....u can set your time to start trading and also for closing. you can also hold position if u want...by changing just close hours at 24..this way u can hold your trade untill next buy/sell signal come..
hope it will help intraday traders
and best of luck to all..
****you can use it any stocks ,forex and crypto**********
some tips for new traders to become sucessful trader
1: always follow risk management...
2: every stock/ forex / crypto has it own cycle.. So pls dont jump from one stock / forex pair to another when u hear some stock / crypto has
made new high or low... Bcs after that consolidation period starts.. During consolidation we can not make more profit as in trending market.. So be patient when u had made some position or tarde in one stock/ pair...
3 : we dont require to trade in every stocks / forex/crypto.. Just one stock and pair trading daily make u profitable beyond ur expection.. Bcs
trading in one stock / forex pair.. make u very comfortable and u may always know its movement... And u also trade in every cycle of this
stock/ pair.. So u also trdae its trend days which made highest profit. We dont know when is trend of any stock... Compare with it
business... Trading is business not one day rich game... Its business... It takes time and u have to do same thing agian and again to become
sucessfull trader for this u can use tradingview alerts. .for that u dont need to seat infrot of ur terminal screen.. u can also do algo trading
by using tradingview alerts
4 : By following risk management and incerase lot size as profit increased... This is the key 🔑 of sucess in stocks / forex / crypto market.
I thinks this tips may help new trader. U can modified according to ur trading style..
You can personal message me if u want to use this strategy
Swing Algo For Allhi friends....publishing Swing Algo For All .. which shows the movement of price over time and how strong those movements are/will be, regardless of the direction the price moves, up, or down. Indicator specifically useful, as it helps traders and analysts spot points where the market can and will reverse by providing signals long (buy) and short (sell). Show the relative strength of price movements but leave out the directionality of the price movements, best utilized in combination with other technical indicators – such as trend lines and moving averages – which show price trends and directions. Having an alert feature to make aware market players from signals provided by the strategy.
There are mainly 3 tyes of swing traders
1 intraday swing trader
2 weekly positional swing trader
3 monthly/yearly positional swing trader
This strategy solves problem of all the type of swing trader. you have to just select type of swing which u want to trade suppose u chose intraday swing it automatically calculate intraday swing high and low and shows buy and sell sign according to it...if it shows buy signal than in lower part it shows plotted line when this line break it automatically generate sell signal and vice versa for sell signal.
same for weekly , monthly and yearly
u can use it in any time frame bcs swing structure are same in any time frame
*********************************************************************************************************
*************** And also use for any stocks, forex and crypto*****************
screenshot on Banknifty weekly swing
some tips for new traders to become successful trader
1: always follow risk management...
2: every stock/ forex / crypto has it own cycle.. So pls dont jump from one stock / forex pair to another when u hear some stock / crypto has
made new high or low... Bcs after that consolidation period starts.. During consolidation we can not make more profit as in trending market.. So be patient when u had made some position or tarde in one stock/ pair...
3 : we dont require to trade in every stocks / forex/crypto.. Just one stock and pair trading daily make u profitable beyond ur expection.. Bcs
trading in one stock / forex pair.. make u very comfortable and u may always know its movement... And u also trade in every cycle of this
stock/ pair.. So u also trdae its trend days which made highest profit. We dont know when is trend of any stock... Compare with it
business... Trading is business not one day rich game... Its business... It takes time and u have to do same thing agian and again to become
sucessfull trader for this u can use tradingview alerts. .for that u dont need to seat infrot of ur terminal screen.. u can also do algo trading
by using tradingview alerts
4 : By following risk management and incerase lot size as profit increased... This is the key 🔑 of sucess in stocks / forex / crypto market.
I thinks this tips may help new trader. U can modified according to ur trading style..
You can personal message me if u want to use this strategy
u can personal message me if u want to use it..

M4x Rainbow strategyReal Grid Trend Multiplier & SMA
"M4x Rainbow" is a Grid Trend Multiplier bot, who is following an adjustable SMA.
"M4x Rainbow" is not bound on FIFO, each trade get's his own exit.
It is set for Pyramiding=0, which can be changed in the "Strategy" line
Fees are set equal to Binance numbers at 0.1%, about...
!!! Pin to existing scale !!!
Or switch the main Indicator off.
Adjustable Settings:
- Profit % per Step (0-1000%)
- SMA lenght (0-4000)
Alerts: (one Alert is one step)
- longRain
- shortRAIN
The coloring of the lines is:
green = linestate is LONG
blue = linestate is WAIT
yellow = linestate is SHORT
!!! Tested only on 1 Minute Chart !!!
Give it a try and let me know.
...have fun ;-)

Trio Strategy w EMA Timing Gate, Early Flip, Clouds and Cross AlMomentum Trio Strategy w EMA Timing Gate, Early Flip, Clouds and Cross Alerts
Short title: Trio EMA Strategy
Concept and Originality
This strategy merges three momentum systems – StochRSI, RSI EMA, and MACD – into one coordinated Trio.
It triggers possible entries only (no exits) when all three align within user-defined windows, with an EMA timing gate for precision and an optional early flip feature if the EMA crosses first.
Optional cooldown and filters reduce false signals.
It also shows green and purple markers when all three momentum indicators cross together, and provides alert notifications on every individual and trio crossover event.
StochRSI-based clouds highlight overbought and oversold areas for quick visual context.
Each part has a defined role:
Trio alignment ensures multi-indicator confirmation.
EMA gate refines timing and enables early trend flips.
Cooldown reduces overtrading.
Filters check price, trend, and volume quality.
Clouds visualize momentum extremes.
Markers show where the Trio crosses.
Alerts notify on all key momentum events.
How It Works
Trio confirmation (core):
StochRSI – percent K and D cross within stochGroupWindow.
RSI – RSI crossing its EMA.
MACD – line crossing signal within macdGroupWindow.
When all three cross up, a green marker appears.
When all three cross down, a purple marker appears.
These mark potential entry points only. Exits are not included.
EMA timing gate:
EMA(5) and EMA(9) define short-term trend.
Longs: EMA(5) greater than EMA(9).
Shorts: EMA(5) less than EMA(9).
Early Flip: when EMA crosses before the trio, a one-time flip can trigger after the chosen cooldown.
Cooldown prevents multiple entries in choppy markets.
Filters include:
Price Filter – restricts entries relative to EMA.
Trend Filter – aligns trades with a longer EMA.
Volume Filter – checks for rising volume.
Overbought and Oversold Clouds:
Red cloud when StochRSI is greater or equal to 80 (overbought).
Green cloud when StochRSI is less or equal to 20 (oversold).
Clouds are for context only, not trade signals.
Alerts trigger on every Trio signal and each individual crossover for StochRSI, RSI, and MACD.
Inputs You Can Tune
RSI, StochRSI, and MACD periods and windows.
EMA gate lengths.
Early-flip toggle and cooldown.
Trio cooldowns.
Filters for price, trend, and volume.
Marker visibility (green and purple).
Overbought or oversold cloud display.
Alert toggles for all cross types.
How To Use
1. Apply to any liquid market such as stocks, crypto, or forex.
2. Choose timeframe.
3. Keep default settings first, then fine-tune windows or cooldowns.
4. Use clouds and markers for entry guidance only. Exits are manual or from another strategy.
5. Enable alerts for real-time notifications of indicator and Trio crosses.
Default Properties Used for Publication (Backtest Transparency)
Initial capital: 100,000 USD – necessary for stock testing so one percent sizing produces realistic order size.
Order size: one percent of equity per trade to keep risk small.
Commission: 0.10 percent per side, realistic for brokers and exchanges.
Slippage: 0.05 percent, equal to roughly one to two ticks on stocks.
Pyramiding: 0.
Execution: on close.
Sample dataset: at least 100 trades across multiple timeframes and markets.
The higher initial capital ensures valid fills for stock testing, while risk stays proportional since position size is percentage based.
Why These Components Work Together
Trio confluence confirms momentum alignment.
EMA gate refines entry timing and allows early reversals.
Cooldown and filters reduce false triggers.
Markers confirm when all three indicators cross together.
Clouds and alerts improve awareness and reaction speed.
The result is a robust entry-only framework that adapts to many markets.
Notes and Limitations
Focused on entry detection only. Exits are manual or external.
For educational use only, not financial advice.
Always test with realistic slippage, fees, and several symbols.
Past results do not guarantee future performance.
Attribution
All logic and structure are original to this publication.
Common Pine functions follow official Pine documentation.

Intellect TBTS V02 [Strategy]📌 Intellect V01 TBO – Trend Breakout Options Strategy
Intellect V01 TBO is an intraday trend-breakout strategy designed for index traders who follow Nifty, BankNifty, and FinNifty.
It identifies trend shifts using structural pivots, adaptive trendlines, and volatility-adjusted breakout zones.
The strategy provides automatic Long/Short signals, optional stop-loss and target projections, and allows users to generate alert messages that include index-option strike information.
🔍 How the Strategy Works
1. Pivot-Based Structure
The script identifies short-term high and low pivots using a user-defined period.
These pivots become anchor points for constructing directional trendlines.
2. Dynamic Trendline Projection
For each pivot, the script builds:
A projected trendline
Two offset lines above/below
A volatility band based on ATR
These help detect potential breakout zones.
3. Breakout Signal Logic
A trade signal is generated when price crosses the projected trendline:
Long Signal – detected when price breaks above a pivot-derived trendline.
Short Signal – detected when price breaks below a pivot-derived trendline.
Users may optionally restrict entries to a specific time window.
🎯 Stop-Loss & Target Zones
When a trade is active:
SL and TP levels are set using ATR-based volatility distance
Levels appear visually on the chart if enabled
Exits occur automatically when TP/SL is hit
The strategy also closes open trades near the end of the session (default 3:10 PM)
These levels are for visual and backtesting support only.
📝 Index Option Strike Calculation (For Alert Text Only)
The strategy can dynamically compute:
ATM strike (with optional bias)
Correct expiry day for Nifty (weekly) and BankNifty/FinNifty (monthly Tuesday)
CE strike for Long signals
PE strike for Short signals
This strike information is only included in alert text for users who configure external automation.
It does not affect backtesting results inside TradingView.
⏱️ Time Window Filter (Optional)
Users may define:
Start time
End time
Outside this window, no new trades are generated.
🎛️ User Adjustable Inputs
Pivot lookback period
Trendline style and extension
Display of target/stop-loss
Expiry selection mode
Strike-bias
Lot size (for alert formatting only)
Time filter settings
🔔 Alert Messages
Alerts include:
Direction (Long/Short)
Strike details
Option type (CE/PE)
Quantity
A formatted JSON message
TradingView does not execute these orders.
Users are responsible for managing external automation independently.
⚠️ Important Notes
This script does not integrate with any broker by default.
It does not place trades automatically; alerts only send text.
Backtests simulate index movement, not live option pricing.
We recommend using realistic slippage and commission settings.
✔️ This strategy is intended for educational and analytical use. Adjust settings as needed.
✅ 2. CLEAN CHART BEFORE PUBLISHING
To avoid moderator flags:
Do This Before Publishing:
✔ Remove all manual drawings
✔ Hide any other indicators on the chart
✔ Use light or clean background
✔ Keep only signals/SL/TP from your script
If you leave extra drawings, moderators may hide the script again.
✅ 3. FINAL PUBLISHING CHECKLIST
Before you click Publish, verify:
✔ Description matches the one above
✔ No broker names anywhere
✔ No "algo trading" or "automation" advertising
✔ Backtest settings are realistic
Commission enabled
Slippage > 1
Reasonable lot assumption
✔ Chart is clean
✔ Script is set to “Strategy” and compiles without warnings

Strategy with Reference Lines📊 Strategy with Reference Lines
Description:
This strategy uses a contrarian approach based on the analysis of the previous candle to identify entry and exit points. The strategy draws horizontal reference lines at important levels of the previous candle and generates buy/sell signals based on the candle's direction.
Key Features:
🔹 Multi-Timeframe Analysis: Configurable for 1H, 2H, 3H, 4H, 6H, 12H, and 1D
🔹 Reference Lines: High, low, close, and midpoint (50%) of the previous candle
🔹 Visual Signals: Labels with prices and actions (BUY/SELL/TP)
🔹 Optional Trading: Enable/disable automatic order execution
🔹 Complete System: Automatic entry, Take Profit, and Stop Loss
🔹 Alerts: Notifications when a new candle is detected
Strategy Logic:
When the previous candle is POSITIVE:
Signal: 🔴 SELL at the previous candle's close
Take Profit: 🎯 Midpoint (50%) of the previous candle
Stop Loss: 🔴 High of the previous candle
When the previous candle is NEGATIVE:
Signal: 🟢 BUY at the previous candle's close
Take Profit: 🎯 Midpoint (50%) of the previous candle
Stop Loss: 🟢 Low of the previous candle
Visual Elements:
Green Line: High of the previous candle (when positive)
Red Line: Low of the previous candle (when negative)
Yellow Line: Close of the previous candle (always present)
Blue Line: Midpoint (50%) of the previous candle (always present)
Labels: Prices and actions with emojis for easy identification
Settings:
Timeframe: Default 4H (configurable)
Auto Trading: Disabled by default (safety)
Alerts: Include entry prices, TP, and SL
Recommended Usage:
✅ Visual Analysis: Use with trading disabled for analysis
✅ Backtesting: Enable trading to test historically
✅ Swing Trading: Ideal for 4H or higher timeframes
✅ Risk Management: Automatic SL and TP for protection
Risk Disclaimer:
This strategy is for educational and analysis purposes only. Always test in a simulation environment before using with real capital. Trading involves significant risks and may result in losses.

AlgoIndex - All Stages (AM & Mid-Day Long/Short)Scope (read first)
ES1! on 5-minute only. The strategy backtests ES fills; alerts can post JSON messages to a Webhook URL you configure. Exits are target-based with ITTC - if ES touches target intra-bar, an exit alert is sent immediately. No fixed ES stop-loss. Positions can also exit at scheduled time-based safety closes (session end, holiday/half-day, or expiration end). You can always close manually.
What this is
One intraday engine with four session presets (“Stages”). Stages only change session windows, trade side, and a few risk/confirmation governors—the core logic is the same. Single invite-only listing; not a multi-post suite.
How it trades
Opening Range (OR): Each Stage begins with a short OR at its session start; that Stage won’t take entries until its OR closes.
VWAP alignment: Trade with flow. Price must align with VWAP (simple pass/fail; optional gap offset).
Real breakouts only: A composite “impulse” check looks for volume expansion, recent momentum, ATR-scaled range, body/range quality, and a clean OR break (or a gap-aware extension).
Entry & target: Entries occur on the signal bar’s close; targets are set in underlying (ES) units.
ITTC (close on touch): If ES touches target intra-bar, ITTC sends a one-shot exit.
Adds (preset by Stage): S1/S2/S3 allow up to two adds on defined ES retraces; S4 disables adds. Adds use a fixed scale-out policy handled internally—no user input required.
Time-based safety closes: At the configured session end (and on holiday/half-day or expiration when applicable), any open position is closed. These are time exits, not price stops.
Why traders use it
A progressive filter for intraday continuity: OR context → VWAP alignment → authentic breakout (impulse) → ITTC to sync ES triggers with options execution. Stage-governed adds keep scaled positions coherent from open to close.
Stages (session templates; one engine)
S1 — 09:30–11:20 NY, Long-only. Standard impulse; adds ON.
S2 — 09:30–11:30 NY, Short-only. Tighter breakout standard; adds ON.
S3 — 11:15–15:15 NY, Long-only. Trade-protection ON; slightly lower underlying target; adds ON.
S4 — 11:30–14:30 NY, Short-only. Alternative trigger governor; slightly lower underlying target; adds OFF.
You can replicate any Stage via session times, side, and thresholds; presets exist for convenience and auditability.
Public inputs (what you can adjust)
Contracts (order size)
TP (Underlying) and TP (Options)
Trade Limiter (toggle) + Max profitable trades per session
Session settings: Exchange Day Session times, optional Custom Time Zone, Session 1 times, optional Session 2, and day-of-week checkboxes
Visual overlays (display-only): VWAP, Prior-Day High/Low, Session High/Low, Round Numbers, Bias Banner, Trade Markers
Display: Inputs in status line
Alerts (how to use)
Create an alert on this strategy and select “Any alert() function call.” (Optional) add a Webhook URL you control to receive the JSON the script sends. Leave Message empty.
Backtest vs options (read carefully)
Backtests show ES fills on 5-minute bars; options pricing (IV, DTE, spreads, partial fills) isn’t simulated. Because live execution uses options, ES PnL is a directional proxy only.
Evaluate quality via: trade count (target ≥100), win rate, average time-in-trade, MAE/MFE, and holding-time distribution. Do not read ES $ PnL as expected options returns—actual options outcomes depend on strike/DTE, IV regime, spreads, and execution.
Defaults used in this publication (match these before interpreting results)
Dataset: last 12–24 months of ES1! 5-minute RTH (to ensure ≥100 trades)
Initial capital: $25,000
Commission: $1.00 per order per contract (≈ $2 round-trip)
Slippage: 1 tick
Order size: 1 contract; pyramiding only for Stage-governed adds
No fixed ES stop-loss; exits are target-based with ITTC and scheduled safety closes
Operating notes
ES1! symbol only; 5-minute resolution only
You can run multiple Stages in parallel via separate tabs/alerts; if you want a single net position across Stages, enforce it in your own tooling (e.g., ignore new orders while a position is open)
Use a clean chart when publishing (only this strategy active)
Keep results separate by using four TradingView tabs (one per Stage)
Disclosures
Educational research tool, not financial advice. Past or hypothetical performance does not guarantee future results. Trading involves risk, including the risk of loss. Test thoroughly and use at your own discretion.

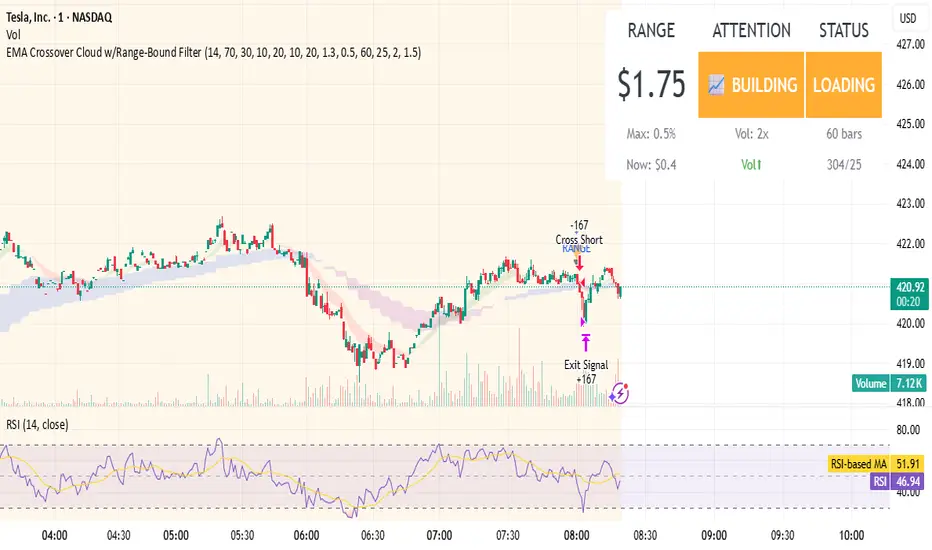
EMA Crossover Cloud w/Range-Bound FilterA focused 1-minute EMA crossover trading strategy designed to identify high-probability momentum trades while filtering out low-volatility consolidation periods that typically result in whipsaw losses. Features intelligent range-bound detection and progressive market attention alerts to help traders manage focus and avoid overtrading during unfavorable conditions.
Key Features:
EMA Crossover Signals: 10/20 EMA crossovers with volume surge confirmation (1.3x 20-bar average)
Range-Bound Filter: Automatically detects when price is consolidating in tight ranges (0.5% threshold) and blocks trading signals during these periods
Progressive Consolidation Stages: Visual alerts progress through Range Bound (red) → Coiling (yellow) → Loading (orange) → Trending (green) to indicate market compression and potential breakout timing
Market Attention Gauge: Helps manage focus between active trading and other activities with states: Active (watch close), Building (check frequently), Quiet (check occasionally), Dead (handle other business)
Smart RSI Exits: Cloud-based and RSI extreme level exits with conservative stop losses
Dual Mode Operation: Separate settings allow full backtesting performance while providing visual stay-out warnings for manual trading
How to Use:
Entry Signals: Trade aqua up-triangles (long) and orange down-triangles (short) when they appear with volume confirmation
Stay-Out Warnings: Ignore gray "RANGE" triangles - these indicate crossovers during range-bound periods that should be avoided
Monitor Top-Right Display:
Range: Current 60-bar dollar range
Attention: Market activity level for focus management
Status: Consolidation stage (trade green/yellow, avoid red, prepare for orange)
Position Sizing: Default 167 shares per signal, optimized for the crossover frequency
Alerts: Enable consolidation stage alerts and market attention alerts for automated notifications
Recommended Settings:
Timeframe: 1-minute charts
Symbol: Optimized for volatile stocks like TSLA
"Apply Filter to Backtest": Keep OFF for realistic backtesting, ON to see filtered results
Risk Management:
The strategy includes built-in overtrading protection by identifying and blocking trades during low-volatility periods. The progressive consolidation alerts help identify when markets are "loading" for significant moves, allowing traders to position appropriately for higher-probability setups.
Master Arb Recipes – 3 Commas signal Bot integration Master Arb Recipes – 3 Commas signal Bot integration
Purpose
A systematic arbitrage/accumulation framework with pre-tuned “recipes” for BTC/ETH/XRP/SUI/SOL plus a fully manual mode. It automates signal generation for external execution bots (via alert() JSON), while showing on-chart panels for goals, active parameters, DCA position, and P&L/ROI/CAGR. Backtests simulate market orders with optional slippage and TradingView commissions.
Key ideas
Entries: Intrabar trigger when price drops by the recipe’s Entry drop % from the previous close.
Exits: Profit-taking when price rises by the recipe’s Exit rise % (optionally requiring price above average cost).
DCA accounting: Tracks running quantity, average cost, realized (cash) P&L, and unrealized (coin) P&L.
Capital planning: “ReqCap” column estimates capital = Entry $ × Allowed entries (UI only; does not affect orders).
Alerts (live only): Sends minimal Custom Signal JSON for enter_long / exit_long to your execution bot.
What’s included on chart
Top-Right: Strategy Goals Table
Describes the objective for each preset. Auto-filters by the chart’s base (optional).
Bottom-Left: Active Recipe Panel (with 3C UI column)
Shows the active preset (or custom) with: timeframe, Sell-Above-Cost state, Entry/Exit %, Exit-as-%-of-Entry, min bars between entries, once-per-bar gate, and 3Commas UI guidance for optional filters and per-order dollars.
Top-Left: DCA Panel
Current base quantity, average cost, and realized P&L.
Bottom-Right: P&L + ROI/CAGR Panel
Cash P&L (realized), Coin P&L (unrealized), Total P&L, ROI since first fill, and annualized CAGR. Displays denominators for both StartCap (strategy.initial_capital) and ReqCap (planning).
Presets
BTC: STH1_D, LTH1_6H, LTH2_D, LTH3_W, LTH4_6H
ETH: STH1_D, STH2_D, LTH1_D
XRP: STH1_D, STH2_6H, LTH1_6H, LTH2_1H
SUI: STH1_D, STH2_D, STH3_D
SOL: STH1_D, LTH1_D
Each preset sets Entry drop %, Exit rise %, default Entry $, Exit-as-%-of-Entry, Sell-Above-Cost flag, and a reference timeframe (display only). Custom mode lets you define these manually.
Inputs you’ll use
3Commas Custom Signal: secret, bot_uuid, max_lag_sec.
Start Window: Exact date/time + timezone to begin trading/signals.
Entry/Exit Parameters: Entry drop %, Exit rise %, Sell Above Avg Cost toggle, Exit as % of Entry.
Capital Planning: Allowed entries (for ReqCap), Entry $ override (panel only).
Execution/Sim: Simulated slippage %, once-per-bar gate, minimum bars between entries, TradingView commission.
Panels: Toggles + positions for each table.
Alert / Bot integration
Alerts fire only in realtime (barstate.isrealtime) on order submission.
Create one alert on this script using “Any alert() function call”.
Payload (Custom Signal style) includes:
secret, bot_uuid, max_lag, timestamp, trigger_price, tv_exchange, tv_instrument, action where action ∈ {enter_long, exit_long}.
Sizing: This script does not include per-order sizing in the JSON; size in your bot UI. The on-chart Entry $ / Exit $ values are for planning/backtest display.
3Commas optional filter mapping (shown in the panel’s “3C UI” column):
Entry filters:
Same order: set to –EntryDrop% (ON)
From average entry: set to –EntryDrop% (ON)
Exit filters:
If Sell Above Cost = ON → From average entry +ExitRise% (ON); Same order OFF
If Sell Above Cost = OFF → Same order +ExitRise% (ON); From average entry OFF
Per-order volume: Use your bot’s UI. Panel shows the dollars you planned (Entry $ and Exit $).
Backtest notes & limitations
Uses calc_on_every_tick=true and intrabar checks against the previous close for entry drops; historical behavior won’t perfectly match exchange microstructure.
process_orders_on_close=false; fills are simulated at bar prices with your slippage setting and TV commission.
Alerts and webhook timing depend on TradingView + broker/exchange latencies; use max_lag_sec accordingly.
Required Capital (ReqCap) is for planning only and does not reserve funds or constrain orders.
Recommended markets/timeframes
Crypto spot or futures charts that trade 24/7. Preset labels (D/6H/1H/W) are reference rhythms for volatility; the script runs on any timeframe but results will vary.
Change log (04092025)
Added 3C UI guidance column in Active Recipe panel (dynamic % per recipe).
Restored Goals (top-right) and P&L/ROI/CAGR (bottom-right with StartCap & ReqCap).
Minor UI clarifications; trading logic unchanged.
Disclaimer
This script is for research and education. It is not financial advice and makes no performance promises. Backtests are hypothetical and subject to substantial limitations. Markets involve risk; you can lose capital. Test on paper first and deploy at your own discretion. Licensed under the Mozilla Public License 2.0.

Trend MasterOverview
The Strategy is a trend-following trading system designed for forex, stocks, or other markets on TradingView. It uses pivot points to identify support and resistance levels, combined with a 200-period Exponential Moving Average (EMA) to filter trades. The strategy enters long or short positions based on trend reversals during specific trading sessions (London or New York). It incorporates robust risk management, including position sizing based on risk percentage or fixed amount, trailing stop-losses, breakeven moves, and weekly/monthly profit/loss limits to prevent overtrading.
This script is ideal for traders who want a semi-automated approach with visual aids like colored session backgrounds, support/resistance lines, and a performance dashboard. It supports backtesting from a custom start date and can limit trades to one per session for discipline. Alerts are built-in for entries, exits, and stop-loss adjustments, making it compatible with automated trading bots.
Key Benefits:
Trend Reversal Detection: Spots higher highs/lows and lower highs/lows to confirm trend changes.
Session Filtering: Trades only during high-liquidity sessions to avoid choppy markets.
Risk Control: Automatically calculates position sizes to risk only a set percentage or dollar amount per trade.
Performance Tracking: Displays a table of weekly or monthly P&L (profit and loss) with color-coded heatmaps for easy review.
Customizable: Adjust trade direction, risk levels, take-profit ratios, and more via inputs.
The strategy uses a 1:1.2 risk-reward ratio by default but can be tweaked.
How It Works
Trend Identification:
The script calculates pivot highs and lows using left (4) and right (2) bars to detect swing points.
It identifies patterns like Higher Highs (HH), Higher Lows (HL), Lower Highs (LH), and Lower Lows (LL) to determine the trend direction (uptrend if above resistance, downtrend if below support).
Support (green dotted lines) and resistance (red dotted lines) are drawn dynamically and update on trend changes.
Bars are colored blue (uptrend) or black (downtrend) for visual clarity.
Entry Signals:
Long Entry: Price closes above the 200 EMA, trend shifts from down to up (e.g., breaking resistance), during an active session (London or NY), and no trade has been taken that session (if enabled).
Short Entry: Price closes below the 200 EMA, trend shifts from up to down (e.g., breaking support), during an active session, and no prior trade that session.
Trades can be restricted to "Long Only," "Short Only," or "Both."
Entries are filtered by a start date (e.g., from January 2022) and optional month-specific testing.
Position Sizing and Risk:
Risk per trade: Either a fixed dollar amount (e.g., $500) or percentage of equity (e.g., 1%).
Quantity is calculated as: Risk Amount / (Entry Price - Stop-Loss Price).
This ensures you never risk more than intended, regardless of market volatility.
Stop-Loss (SL) and Take-Profit (TP):
SL for Longs: Set below the recent support level, adjustable by a "reduce value" (e.g., tighten by 0-90%) and gap (e.g., add a buffer).
SL for Shorts: Set above the recent resistance level, with similar adjustments.
TP: Based on risk-reward ratio (default 1.2:1), so if SL is 100 pips away, TP is 120 pips in profit.
Visual boxes show SL (red) and TP (green) on the chart for the next 4 bars after entry.
Trade Management:
Trailing SL: Automatically moves SL to the new support (longs) or resistance (shorts) if it tightens the stop without increasing risk.
Breakeven Move: If enabled, SL moves to entry price once profit reaches a set ratio of initial risk (default 1:1). For example, if risk was 1%, SL moves to breakeven at 1% profit.
One Trade Per Session: Prevents multiple entries in the same London or NY session to avoid overtrading.
Sessions include optional weekend inclusion and are highlighted (blue for London, green for NY).
Risk Limits (Weekly/Monthly):
Monitors P&L for the current week or month.
Stops trading if losses hit a limit (e.g., -3%) or profits reach a target (e.g., +7%).
Resets at the start of each new week/month.
Alerts notify when limits are hit.
Exits:
Trades exit at TP, SL, or manually via alerts.
No time-based exits; relies on price action.
Performance Dashboard:
A customizable table (position, size, colors) shows P&L percentages for each week/month in a grid.
Rows = Years, Columns = Weeks (1-52) or Months (1-12).
Color scaling: Green for profits (darker for bigger wins), red for losses (darker for bigger losses).
Yearly totals in the last column.
Helps visualize strategy performance over time without manual calculations.
Input Parameters Explained
Here's a breakdown of the main inputs for easy customization:
Trade Direction: "Both" (default), "Long Only," or "Short Only" – Controls allowed trade types.
Test Only Selected Month: If true, backtests only the specified month from the start year.
Start Year/Month: Sets the backtest start date (default: Jan 2022).
Include Weekends: If true, sessions can include weekends (rarely useful for forex).
Only One Trade Per Session: Limits to one entry per London/NY session (default: true).
Risk Management Time Frame: "Weekly" or "Monthly" – For P&L limits.
Enable Limits: Toggle weekly/monthly stop trading on loss/profit thresholds.
Loss Limit (%)/Profit Target (%): Stops trading if P&L hits these (e.g., -3% loss or +7% profit).
London/New York Session: Enable/disable, with time ranges (e.g., London: 0800-1300 UTC).
Left/Right Bars: For pivot detection (default: 4 left, 2 right) – Higher values smooth signals.
Support/Resistance: Toggle lines, colors, style, width.
Change Bar Color: Colors bars based on trend.
TP RR: Take-profit risk-reward (default: 1.2).
Stoploss Reduce Value: Tightens SL (negative values widen it, 0-0.9 range).
Stoploss Gap: Adds a buffer to SL (e.g., 0.1% away from support).
Move to Breakeven: Enables SL move to entry at a profit ratio (default: true, 1:1).
Use Risk Amount $: If true, risks fixed $ (e.g., 500); else, % of equity (default: 1%).
EMA 3: The slow EMA period (default: 200) for trend filter.
Performance Display: Toggle table, location (e.g., Bottom Right), size, colors, scaling for heatmaps.
Setup and Usage Tips
Add to Chart: Copy the script into TradingView's Pine Editor, compile, and add to your chart.
Backtesting: Use the Strategy Tester tab. Adjust inputs and test on historical data.
Live Trading: Connect alerts to a broker or bot (e.g., via webhook). The script sends JSON-formatted alerts for entry, exit, SL moves, and limits.
Best Markets: Works well on crypto pairs like SOLUSD or RUNEUSD on 4H timeframes.
Risk Warning: This is not financial advice. Always use demo accounts first. Past performance doesn't guarantee future results. Commission is set to 0.05% by default – adjust for your broker.
Customization: Experiment with EMA length or RR ratio for your style.

Breackout V8 MomentumBreakout V6 Strategy with Fibonacci TPs
Description
Developed by Coton, this automated trading tool is designed to identify and capitalize on breakouts from consolidation zones, supported by momentum indicators. It leverages technical indicators to detect significant price movements and enters positions with take-profits based on Fibonacci levels and a trailing stop to protect profits. Optimized for crypto trading , it operates in Scalping (1m) or Intraday (5m) modes.
Indicators Used
Volatility Bands : Identify price compression and expansion zones to detect consolidations and breakouts.
Momentum Indicators : Measure the strength and direction of price movements to confirm breakouts.
Volume Indicators : Validate breakouts with significant increases in trading activity.
Dynamic Levels : Define entry and exit points based on adaptive calculations.
Features
Breakout Detection : Identifies exits from consolidation zones with quality filters.
Fibonacci Take-Profits : Profit targets calculated using extension levels to maximize gains.
Trailing Stop : Protects profits by dynamically adjusting the stop-loss based on volatility.
Visualization : Displays consolidation zones, entry levels, stop-losses, and take-profits on the chart.
Alerts : Notifications for confirmed and ongoing breakouts with a minimum risk/reward ratio.
Table : Shows the strategy status and estimated leverage in real-time.
Input Parameters
Trading Mode: Scalping (1m) or Intraday (5m) (default: Intraday)
Fibonacci Level for TP: 1.618 (adjustable 0.5-5.0)
Minimum RR for Alerts: 1.2 (filters alerts)
Alerts
Confirmed Breakout (validated movement with quality criteria).
Ongoing Breakout (tracked with minimum risk/reward ratio, every 5 candles).
Disclaimers
Not financial advice; test in demo mode.
Past performance is not indicative of future results.
High risk in crypto trading; use proper risk management (1-2% per trade).
Commission (0.1%) may impact results; adjust for your broker.
Contact
Coton for questions or improvements.

MACD Liquidity Tracker Strategy [Quant Trading]MACD Liquidity Tracker Strategy
Overview
The MACD Liquidity Tracker Strategy is an enhanced trading system that transforms the traditional MACD indicator into a comprehensive momentum-based strategy with advanced visual signals and risk management. This strategy builds upon the original MACD Liquidity Tracker System indicator by TheNeWSystemLqtyTrckr , converting it into a fully automated trading strategy with improved parameters and additional features.
What Makes This Strategy Original
This strategy significantly enhances the basic MACD approach by introducing:
Four distinct system types for different market conditions and trading styles
Advanced color-coded histogram visualization with four dynamic colors showing momentum strength and direction
Integrated trend filtering using 9 different moving average types
Comprehensive risk management with customizable stop-loss and take-profit levels
Multiple alert systems for entry signals, exits, and trend conditions
Flexible signal display options with customizable entry markers
How It Works
Core MACD Calculation
The strategy uses a fully customizable MACD configuration with traditional default parameters:
Fast MA : 12 periods (customizable, minimum 1, no maximum limit)
Slow MA : 26 periods (customizable, minimum 1, no maximum limit)
Signal Line : 9 periods (customizable, now properly implemented and used)
Cryptocurrency Optimization : The strategy's flexible parameter system allows for significant optimization across different crypto assets. Traditional MACD settings (12/26/9) often generate excessive noise and false signals in volatile crypto markets. By using slower, more smoothed parameters, traders can capture meaningful momentum shifts while filtering out market noise.
Example - DOGE Optimization (45/80/290 settings) :
• Performance : Optimized parameters yielding exceptional backtesting results with 29,800% PnL
• Why it works : DOGE's high volatility and social sentiment-driven price action benefits from heavily smoothed indicators
• Timeframes : Particularly effective on 30-minute and 4-hour charts for swing trading
• Logic : The very slow parameters filter out noise and capture only the most significant trend changes
Other Optimizable Cryptocurrencies : This parameter flexibility makes the strategy highly effective for major altcoins including SUI, SEI, LINK, Solana (SOL) , and many others. Each crypto asset can benefit from custom parameter tuning based on its unique volatility profile and trading characteristics.
Four Trading System Types
1. Normal System (Default)
Long signals : When MACD line is above the signal line
Short signals : When MACD line is below the signal line
Best for : Swing trading and capturing longer-term trends in stable markets
Logic : Traditional MACD crossover approach using the signal line
2. Fast System
Long signals : Bright Blue OR Dark Magenta (transparent) histogram colors
Short signals : Dark Blue (transparent) OR Bright Magenta histogram colors
Best for : Scalping and high-volatility markets (crypto, forex)
Logic : Leverages early momentum shifts based on histogram color changes
3. Safe System
Long signals : Only Bright Blue histogram color (strongest bullish momentum)
Short signals : All other colors (Dark Blue, Bright Magenta, Dark Magenta)
Best for : Risk-averse traders and choppy markets
Logic : Prioritizes only the strongest bullish signals while treating everything else as bearish
4. Crossover System
Long signals : MACD line crosses above signal line
Short signals : MACD line crosses below signal line
Best for : Precise timing entries with traditional MACD methodology
Logic : Pure crossover signals for more precise entry timing
Color-Coded Histogram Logic
The strategy uses four distinct colors to visualize momentum:
🔹 Bright Blue : MACD > 0 and rising (strong bullish momentum)
🔹 Dark Blue (Transparent) : MACD > 0 but falling (weakening bullish momentum)
🔹 Bright Magenta : MACD < 0 and falling (strong bearish momentum)
🔹 Dark Magenta (Transparent) : MACD < 0 but rising (weakening bearish momentum)
Trend Filter Integration
The strategy includes an advanced trend filter using 9 different moving average types:
SMA (Simple Moving Average)
EMA (Exponential Moving Average) - Default
WMA (Weighted Moving Average)
HMA (Hull Moving Average)
RMA (Running Moving Average)
LSMA (Least Squares Moving Average)
DEMA (Double Exponential Moving Average)
TEMA (Triple Exponential Moving Average)
VIDYA (Variable Index Dynamic Average)
Default Settings : 50-period EMA for trend identification
Visual Signal System
Entry Markers : Blue triangles (▲) below candles for long entries, Magenta triangles (▼) above candles for short entries
Candle Coloring : Price candles change color based on active signals (Blue = Long, Magenta = Short)
Signal Text : Optional "Long" or "Short" text inside entry triangles (toggleable)
Trend MA : Gray line plotted on main chart for trend reference
Parameter Optimization Examples
DOGE Trading Success (Optimized Parameters) :
Using 45/80/290 MACD settings with 50-period EMA trend filter has shown exceptional results on DOGE:
Performance : Backtesting results showing 29,800% PnL demonstrate the power of proper parameter optimization
Reasoning : DOGE's meme-driven volatility and social sentiment spikes create significant noise with traditional MACD settings
Solution : Very slow parameters (45/80/290) filter out social media-driven price spikes while capturing only major momentum shifts
Optimal Timeframes : 30-minute and 4-hour charts for swing trading opportunities
Result : Exceptionally clean signals with minimal false entries during DOGE's characteristic pump-and-dump cycles
Multi-Crypto Adaptability :
The same optimization principles apply to other major cryptocurrencies:
SUI : Benefits from smoothed parameters due to newer coin volatility patterns
SEI : Requires adjustment for its unique DeFi-related price movements
LINK : Oracle news events create price spikes that benefit from noise filtering
Solana (SOL) : Network congestion events and ecosystem developments need smoothed detection
General Rule : Higher volatility coins typically benefit from very slow MACD parameters (40-50 / 70-90 / 250-300 ranges)
Key Input Parameters
System Type : Choose between Fast, Normal, Safe, or Crossover (Default: Normal)
MACD Fast MA : 12 periods default (no maximum limit, consider 40-50 for crypto optimization)
MACD Slow MA : 26 periods default (no maximum limit, consider 70-90 for crypto optimization)
MACD Signal MA : 9 periods default (now properly utilized, consider 250-300 for crypto optimization)
Trend MA Type : EMA default (9 options available)
Trend MA Length : 50 periods default (no maximum limit)
Signal Display : Both, Long Only, Short Only, or None
Show Signal Text : True/False toggle for entry marker text
Trading Applications
Recommended Use Cases
Momentum Trading : Capitalize on strong directional moves using the color-coded system
Trend Following : Combine MACD signals with trend MA filter for higher probability trades
Scalping : Use "Fast" system type for quick entries in volatile markets
Swing Trading : Use "Normal" or "Safe" system types for longer-term positions
Cryptocurrency Trading : Optimize parameters for individual crypto assets (e.g., 45/80/290 for DOGE, custom settings for SUI, SEI, LINK, SOL)
Market Suitability
Volatile Markets : Forex, crypto, indices (recommend "Fast" system or smoothed parameters)
Stable Markets : Stocks, ETFs (recommend "Normal" or "Safe" system)
All Timeframes : Effective from 1-minute charts to daily charts
Crypto Optimization : Each major cryptocurrency (DOGE, SUI, SEI, LINK, SOL, etc.) can benefit from custom parameter tuning. Consider slower MACD parameters for noise reduction in volatile crypto markets
Alert System
The strategy provides comprehensive alerts for:
Entry Signals : Long and short entry triangle appearances
Exit Signals : Position exit notifications
Color Changes : Individual histogram color alerts
Trend Conditions : Price above/below trend MA alerts
Strategy Parameters
Default Settings
Initial Capital : $1,000
Position Size : 100% of equity
Commission : 0.1%
Slippage : 3 points
Date Range : January 1, 2018 to December 31, 2069
Risk Management (Optional)
Stop Loss : Disabled by default (customizable percentage-based)
Take Profit : Disabled by default (customizable percentage-based)
Short Trades : Disabled by default (can be enabled)
Important Notes and Limitations
Backtesting Considerations
Uses realistic commission (0.1%) and slippage (3 points)
Default position sizing uses 100% equity - adjust based on risk tolerance
Stop-loss and take-profit are disabled by default to show raw strategy performance
Strategy does not use lookahead bias or future data
Risk Warnings
Past performance does not guarantee future results
MACD-based strategies may produce false signals in ranging markets
Consider combining with additional confluences like support/resistance levels
Test thoroughly on demo accounts before live trading
Adjust position sizing based on your risk management requirements
Technical Limitations
Strategy does not work on non-standard chart types (Heikin Ashi, Renko, etc.)
Signals are based on close prices and may not reflect intraday price action
Multiple rapid signals in volatile conditions may result in overtrading
Credits and Attribution
This strategy is based on the original "MACD Liquidity Tracker System" indicator created by TheNeWSystemLqtyTrckr . This strategy version includes significant enhancements:
Complete strategy implementation with entry/exit logic
Addition of the "Crossover" system type
Proper implementation and utilization of the MACD signal line
Enhanced risk management features
Improved parameter flexibility with no artificial maximum limits
Additional alert systems for comprehensive trade management
The original indicator's core color logic and visual system have been preserved while expanding functionality for automated trading applications.

G-Bot v3Overview:
G-Bot is an invite-only Pine Script tailored for traders seeking a precise, automated breakout strategy. This closed-source script integrates with 3Commas via API to execute trades seamlessly, combining classic indicators with proprietary logic to identify high-probability breakouts. G-Bot stands out by filtering market noise through a unique confluence of signals, offering adaptive risk management, and employing advanced alert deduplication to ensure reliable automation. Its purpose-built design delivers actionable signals for traders prioritizing consistency and efficiency in trending markets.
What It Does and How It Works:
G-Bot generates trade signals by evaluating four key market dimensions—trend, price action, momentum, and volume—on each 60-minute bar. The script’s core components and their roles are:
Trend Detection (EMAs): Confirms trend direction by checking if the 5-period EMA is above (bullish) or below (bearish) the 6-period EMA, with the price positioned accordingly (above the 5-period EMA for longs, below for shorts). The tight EMA pairing is optimized for the 60-minute timeframe to capture sustained trends while minimizing lag.
Price Action Trigger (Swing Highs/Lows): Identifies breakouts when the price crosses above the previous swing high (for longs) or below the previous swing low (for shorts), using a period lookback to focus on recent price pivots. This ensures entries align with significant market moves.
Momentum Filter (RSI): Validates breakouts by requiring RSI to fall within moderated ranges. These ranges avoid overbought/oversold extremes, prioritizing entries with balanced momentum to enhance trade reliability.
Volume Confirmation (3-period SMA): Requires volume to exceed its 3-period SMA, confirming that breakouts are driven by strong market participation, reducing the risk of false moves.
Risk Management (14-period ATR): Calculates stop-loss distances (ATR) and trailing stops (ATR and ATR-point offset) to align trades with current volatility, protecting capital and locking in profits.
These components work together to create a disciplined system: the EMAs establish trend context, swing breaks confirm price momentum, RSI filters for optimal entry timing, and volume ensures market conviction. This confluence minimizes false signals, a critical advantage for hourly breakout trading.
Why It’s Original and Valuable:
G-Bot’s value lies in its meticulous integration of standard indicators into a non-standard, automation-focused system. Its unique features include:
Curated Signal Confluence: Unlike generic breakout scripts that rely on single-indicator triggers (e.g., EMA crossovers), G-Bot requires simultaneous alignment of trend, price action, momentum, and volume. This multi-layered approach, reduces noise and prioritizes high-conviction setups, addressing a common flaw in simpler strategies.
Proprietary Alert Deduplication: G-Bot employs a custom mechanism to prevent redundant alerts, using a 1-second minimum gap and bar-index tracking. This ensures signals are actionable and compatible with 3Commas’ high-frequency automation, a feature not found in typical Pine Scripts.
Adaptive Position Sizing: The script calculates trade sizes based on user inputs (1-5% equity risk, max USD cap, equity threshold) and ATR-derived stop distances, ensuring positions reflect both account size and market conditions. This dynamic approach enhances risk control beyond static sizing methods.
3Commas API Optimization: G-Bot generates JSON-formatted alerts with precise position sizing and exit instructions, enabling seamless integration with 3Commas bots. This level of automation, paired with detailed Telegram alerts for monitoring, streamlines the trading process.
Visual Clarity: On-chart visuals—green triangles for long entries, red triangles for shorts, orange/teal lines for swing levels, yellow circles for price crosses—provide immediate insight into signal triggers, allowing traders to validate setups without accessing the code.
G-Bot is not a repackaging of public code but a specialized tool that transforms familiar indicators into a robust, automated breakout system. Its originality lies in the synergy of its components, proprietary alert handling, and trader-centric automation, justifying its invite-only status.
How to Use:
Setup: Apply G-Bot to BITGET’s BTCUSDT.P chart on a 60-minute timeframe.
3Commas Configuration: Enter your 3Commas API Secret Key and Bot UUID in the script’s input settings to enable webhook integration.
Risk Parameters: Adjust Risk % (1-5%), Max Risk ($), and Equity Threshold ($) to align position sizing with your account and risk tolerance.
Webhook Setup: Configure 3Commas to receive JSON alerts for automated trade execution. Optionally, connect Telegram for detailed signal notifications.
Monitoring: Use on-chart visuals to track signals:
Green triangles (below bars) mark long entries; red triangles (above bars) mark shorts.
Orange lines show swing highs; teal lines show swing lows.
Yellow circles indicate price crosses; purple crosses highlight volume confirmation.
Testing: Backtest G-Bot in a demo environment to validate performance and ensure compatibility with your trading strategy.
Setup Notes : G-Bot is a single, self-contained script for BTCUSDT.P on 60-minute charts, with all features accessible via user inputs. No additional scripts or passwords are required, ensuring compliance with TradingView’s single-publication rule.
Disclaimer: Trading involves significant risks, and past performance is not indicative of future results. Thoroughly test G-Bot in a demo environment before deploying it in live markets.
Full setup support will be provided

Flux Charts - S&D Automation💎 GENERAL OVERVIEW
The MTF Supply & Demand Zones (S&D) Automation is a powerful and versatile tool designed to help traders rigorously test their trading strategies against historical market data. With various advanced settings, traders can fine-tune their strategies, assess performance, and identify key improvements before deploying in live trading environments. This tool offers a wide range of configurable settings, explained within this write-up.
Features of the new S&D Automation:
Step By Step : Configure your strategy step by step, which will allow you to have OR & AND logic in your strategies.
Highly Configurable : Offers multiple parameters for fine-tuning trade entry and exit conditions.
Multi-Timeframe Analysis : Allows traders to analyze multiple timeframes simultaneously for enhanced accuracy.
Provides advanced stop-loss, take-profit, and break-even settings.
Incorporates Supply & Demand Zone conditions, with settings like Sensitivity, Zone Invalidation, Minimum Zone Width & Minimum Zone Length settings for refined strategy execution.
🚩 UNIQUENESS
The S&D Automation stands out from conventional backtesting tools due to its unparalleled flexibility, precision, and advanced trading logic integration. Key factors that make it unique include:
✅ Comprehensive Strategy Customization – Unlike traditional backtesters that offer basic entry and exit conditions, S&D Automation provides a highly detailed parameter set, allowing traders to fine-tune their strategies with precision.
✅ Multi-Timeframe Supply & Demand Zones – This is the first-ever tool that allows traders to backtest Supply & Demand zones on multiple timeframes.
✅ Customizable Take-Profit Conditions – Offers various methods to set take-profit exits, including using core features from Supply & Demand Zones, and fixed exits like ATR, % change or price change, enabling traders to tailor their exit strategies to specific market behaviors.
✅ Customizable Stop-Loss Conditions – Provides several ways to set up stop losses, including using concepts from Supply & Demand Zones and trailing stops or fixed exits like ATR, % change or price change, allowing for dynamic risk management tailored to individual strategies.
✅ Integration of External Indicators – Allows the inclusion of other indicators or data sources from TradingView for creating strategy conditions, enabling traders to enhance their strategies with additional insights and data points.
By integrating these advanced features, S&D Automation ensures that traders can rigorously test and optimize their strategies with great accuracy and efficiency.
📌 HOW DOES IT WORK ?
The first setting you will want to set it the pyramiding setting. This setting controls the number of simultaneous trades in the same direction allowed in the strategy. For example, if you set it to 1, only one trade can be active in any time, and the second trade will not be entered unless the first one is exited. If it is set to 2, the script will handle both of them at the same time. Note that you should enter the same value to this pyramiding setting, and the pyramiding setting in the "Properties" tab of the script for this to work.
You can enable and set a backtesting window that will limit the entries to between the start date & end date.
Then, you can enter your desired settings for Supply & Demand Zones. You can also enable and set up to 3 timeframes, which you can use later on when customizing your strategies enter / exit conditions.
Entry Conditions
From the "Long Conditions" or the "Short Conditions" groups, you can set your position entry conditions. For settings like "initial capital" or "order size", you can open the "Properties" tab, where these are handled.
The S&D Automation can use the following conditions for entry conditions :
1. Demand Zone
Detection: Triggered when a Demand Zone forms or is detected
Retest: Triggered when price retests a Demand Zone. A retest is confirmed when a candle enters a Demand Zone and closes outside of it.
2nd Retest: Triggered when price retests a Demand Zone for the second time. A retest is confirmed when a candle enters a Demand Zone and closes outside of it.
3rd Retest: Triggered when price retests a Demand Zone for the third time. A retest is confirmed when a candle enters a Demand Zone and closes outside of it.
Retracement: Triggered when price touches a Demand Zone
Break: Triggered when a Demand Zone is invalidated by candle close or wick, depending on the user's input.
2. Supply Zone
Detection: Triggered when a Supply Zone forms or is detected
Retest: Triggered when price retests a Supply Zone. A retest is confirmed when a candle enters a Supply Zone and closes outside of it.
2nd Retest: Triggered when price retests a Supply Zone for the second time. A retest is confirmed when a candle enters a Supply Zone and closes outside of it.
3rd Retest: Triggered when price retests a Supply Zone for the third time. A retest is confirmed when a candle enters a Supply Zone and closes outside of it.
Retracement: Triggered when price touches a Supply Zone
Break: Triggered when a Supply Zone is invalidated by candle close or wick, depending on the user's input.
3. Any Zone
Detection: Triggered when any Supply or Demand Zone forms or is detected
Retest: Triggered when price retests any Supply or Demand Zone. A retest is confirmed when a candle enters any Supply or Demand Zone and closes outside of it.
2nd Retest: Triggered when price retests any Supply or Demand Zone for the second time. A retest is confirmed when a candle enters any Supply or Demand Zone and closes outside of it.
3rd Retest: Triggered when price retests any Supply or Demand Zone for the third time. A retest is confirmed when a candle enters any Supply or Demand Zone and closes outside of it.
Retracement: Triggered when price touches any Supply or Demand Zone
Break: Triggered when any Supply or Demand Zone is invalidated by candle close or wick, depending on the user's input.
🕒 TIMEFRAME CONDITIONS
The S&D Automation supports Multi-Timeframe (MTF) features, just like the Supply & Demand indicator. When setting an entry condition, you can also choose the timeframe.
To set up MTF conditions, navigate to the 'Timeframes' section in the settings, select your desired timeframes, and enable them. You can choose up to three timeframes.
Once you've selected your timeframes, you can use them in your strategy. When setting long and short entry/exit conditions, you can choose from Timeframe 1, Timeframe 2, or Timeframe 3.
External Conditions
Users can use external indicators on the chart to set entry conditions.
The second dropdown in the external condition settings allows you to choose a conditional operator to compare external outputs. Available options include:
Less Than or Equal To: <=
Less Than: <
Equal To: =
Greater Than: >
Greater Than or Equal To: >=
The position entry conditions work like this ;
Each side has 5 S&D Zone conditions and 1 Source condition. Each condition can be enabled or disabled using the checkbox on the left side of them.
The next selection is the alert type, which you can select between "Detection", "Retest", "Retracement" or "Break".
You can select which timeframe this condition should work on from Timeframe 1, 2, or 3. If you select "Any Timeframe", the condition will work for all timeframes.
Lastly select the step of this condition from 1 to 6.
The Source Condition
The last condition on each side is a source condition that is different from the others. Using this condition, you can create your own logic using other indicators' outputs on your chart. For example, suppose that you have an EMA indicator in your chart. You can have the source condition to something like "EMA > high".
The Step System
Each condition has a step number, and conditions are in topological order based on them.
The conditions are executed step by step. This means the condition with step 2 cannot be executed before the condition with step 1 is executed.
Conditions with the same step numbers have "OR" logic. This means that if you have 2 conditions with step 3, the condition with step 4 can trigger after only one of the step 3 conditions is executed.
➕ OTHER ENTRY FEATURES
The S&D Automation allows traders to choose when to execute trades and when not to execute trades.
1. Only Take Trades
This setting lets users specify the time period when their strategy can open or execute trades.
2. Don't Take Trades
This setting lets users specify time periods when their strategy can't open or execute trades.
↩️ EXIT CONDITIONS
1. Exit on Opposite Signal
When enabled, a long position will close when short entry conditions are met, and a short position will close when long entry conditions are met.
2. Exit on Session End
When enabled, positions will be closed at the end of the trading session.
📈 TAKE PROFIT CONDITIONS
There are several methods available for setting take profit exits and conditions.
1. Entry Condition TP
Users can use entry conditions as triggers for take-profit exits. This setting can be found under the long and short exit conditions.
2. Fixed TP
Users can set a fixed TP for exits. This setting can be found under the long and short exit conditions. Users can choose between the following:
Price: This method triggers a TP exit when price reaches a specified level. For example, if you set the Price TP to 10 and buy NASDAQ:TSLA at $190, the trade will automatically exit when the price reaches $200 ($190 + $10).
Ticks: This method triggers a TP exit when price moves a specified number of ticks.
Percentage (%): This method triggers a TP exit when price moves a specified percentage.
ATR: This method triggers a TP exit based on a specified multiple of the Average True Range (ATR).
📉 STOP LOSS CONDITIONS
There are several methods available for setting stop-loss exits and conditions.
1. Entry Condition SL
Users can use entry conditions as triggers for stop-loss exits. This setting can be found under the long and short exit conditions.
2. Fixed SL
Users can set a fixed SL for exits. This setting can be found under the long and short exit conditions. Users can choose between the following:
Price: This method triggers a SL exit when price reaches a specified level. For example, if you set the Price SL to 10 and buy NASDAQ:TSLA at $200, the trade will automatically exit when the price reaches $190 ($200 - $10).
Ticks: This method triggers a SL exit when price moves a specified number of ticks.
Percentage (%): This method triggers a SL exit when price moves a specified percentage.
ATR: This method triggers a SL exit based on a specified multiple of the Average True Range (ATR).
3. Trailing Stop
An explanation & example for the trailing stop feature is present on the write-up within the next section.
Exit conditions have the same logic of constructing conditions like the entry ones. You can construct a Take-Profit Condition & a Stop-Loss Condition. Note that the Take-Profit condition will only work if the position is in profit, regardless of if it's triggered or not. The same applies for the Stop-Loss condition, meaning that it will only work if the position is in loss.
You can also set a Fixed TP & Fixed SL based on the price movement after the position is entered. You have options like "Price", "Ticks", "%", or "Average True Range". For example, you can set a Fixed TP like "5%", and the position will be entered once it moves 5% up in a long position.
Trailing Stop
For the Fixed SL, you also have a "Trailing" stop option, for which you can set its activation level as well. The Trailing stop activation level and its value are expressed in ticks. Check this scenario for an example :
We have a ticker with a tick value of $1. Our Trailing Stop is set to 10 ticks, and the activation level is set to 30 ticks.
We buy 1 contract when the price is $100.
When the price becomes $110, we are in $10 (10 ticks) profit and the trailing stop is now activated.
The current price our stop's on is $110 - $30 (30 ticks), which is the level of $80.
The trailing stop will only move if the price moves up the highest high the price has been after we entered the position.
Let's suppose that price moves up $40 right after our trailing stop is activated. The price will now be $150, and our trailing stop will sit on $150 - $30 (30 ticks) = $120.
If the price is down the $120 level, our stop loss will be triggered.
There is also a "Hard SL" option designed for a backup stop-loss when trailing stops are enabled. You can enable & set this option and if the price goes down before our trailing stop even activates, the position will be exited.
You can also move stop-loss to the break-even (entry price of the position) after a certain profit is achieved using the last setting of the exit conditions. Note that for this to work, you must have a Fixed SL set-up.
➕ OTHER EXIT FEATURES
1. Move Stop Loss to Breakeven
This setting allows the strategy to automatically move the SL to Breakeven (BE) when the position is in profit by a certain amount. Users can choose between the following:
Price: This method moves the SL to BE when price reaches a specified level.
Ticks: This method moves the SL to BE when price moves a specified number of ticks.
Percentage (%): This method moves the SL to BE when price moves a specified percentage.
ATR: This method moves the SL to BE when price moves a specified multiple of the Average True Range (ATR).
Example Entry Scenario
To give an example , check this scenario; out conditions are :
LONG CONDITIONS
Demand Zone Detection, Step 1
Supply Zone Retest, Step 2
Demand Zone Break, Step 2
open > close, Step 3
First, the strategy needs to detect a Demand Zone Detection in order to start working.
After it's detected, now it's looking for either a Supply Zone Retest, or a Demand Zone Break to proceed to the next step, the reason for this is that they both have the same step number.
After one of them is detected, the strategy will consistently check candlesticks for the condition open > close. If a bullish candlestick occurs, a long position will be entered.
⏰ ALERTS
This indicator uses TradingView's strategy alert system. All entries and exits will be sent as an alert if configured. It's possible to further customize these alerts to your liking. For more information check TradingView's strategy alert customization page : www.tradingview.com
⚙️ SETTINGS
1. Backtesting Settings
Pyramiding: Controls the number of simultaneous trades allowed in the strategy. This setting must have the same value that is entered on the script's properties tab on the settings pane.
Enable Custom Backtesting Period: Restricts backtesting to a specific date range.
Start & End Time Configuration: Define precise start and end dates for historical analysis.
2. General Configuration
Detection Method: There are two detection methods you can choose from for identifying Supply & Demand Zones. Both methods aim to identify key areas where price is likely to react, but they do so using different approaches. Traders can choose the method that aligns with their trading style and time horizon.
Sensitivity: The Sensitivity setting allows traders to adjust how aggressively the script identifies supply and demand zones when using the Momentum Detection Method. This setting directly impacts the threshold for detecting zones when using the momentum detection method.
Zone Invalidation: The Zone Invalidation setting determines how supply and demand zones are invalidated.
Wick -> A zone is invalidated if a candle’s wick goes below a demand zone or above a supply zone.
Close -> A zone is invalidated if a candle closes below a demand zone or above a supply zone.
Zone Visibility Range: The Zone Visibility Range setting controls how far from the current price supply and demand zones are displayed on the chart. It helps traders focus on relevant zones while avoiding clutter from distant or less impactful areas.
Minimum Zone Width: The Minimum Zone Width setting defines the smallest size a supply or demand zone must have to be displayed on the chart. It uses the Average True Range (ATR) as a reference to ensure zones are proportionate to current market volatility.
Minimum Zone Length: The Minimum Zone Length setting determines the minimum number of bars a supply or demand zone must span to be displayed on the chart. This setting helps filter out short-lived or insignificant zones, ensuring only meaningful areas of supply or demand are highlighted.
3. Multi-Timeframe Analysis
Enable Up to Three Timeframes: Select and analyze trades across multiple timeframes.
4. Entry Conditions for Long & Short Trades
Multiple Conditions (1-6): Configure up to six independent conditions per trade direction.
Condition Types: Options include Detection, Retest, 2nd Retest, 3rd Retest, Retracement, and Break.
Timeframe Specification: Choose between "Any Timeframe", "Timeframe 1", "Timeframe 2", or "Timeframe 3".
Trade Execution Filters: Restrict trades within specific trading sessions.
5. Exit Conditions for Long & Short Trades
Exit on Opposite Signal: Automatically exit trades upon opposite trade conditions.
Exit on Session End: Closes all positions at the end of the trading session.
Multiple Take-Profit (TP) and Stop-Loss (SL) Configurations:
TP/SL based on % move, ATR, Ticks, or Fixed Price.
Hard SL option for additional risk control.
Move SL to BE (Break Even) after a certain profit threshold.

Flux Charts - PAT Automation💎 GENERAL OVERVIEW
The PAT Automation is a powerful and versatile tool designed to help traders rigorously test their trading strategies against historical market data. With an array of advanced settings, traders can fine-tune their strategies, assess performance, and identify key improvements before deploying in live trading environments. This backtester offers a wide range of configurable settings, explained within this write-up.
Features of the PAT Automation:
Step By Step : Configure your strategy step by step, which will allow you to have OR & AND logic in your strategies.
Highly Configurable : Offers multiple parameters for fine-tuning trade entry and exit conditions.
Multi-Timeframe Analysis : Allows traders to analyze multiple timeframes simultaneously for enhanced accuracy.
Provides advanced stop-loss, take-profit, and break-even settings.
Incorporates volume-based conditions, liquidity grabs , order blocks , market structures and fair value gaps for refined strategy execution.
🚩 UNIQUENESS
The PAT Automation stands out from conventional backtesting tools due to its unparalleled flexibility, precision, and advanced trading logic integration. Key factors that make it unique include:
✅ Comprehensive Strategy Customization – Unlike traditional backtesters that offer basic entry and exit conditions, PAT Automation provides a highly detailed parameter set, allowing traders to fine-tune their strategies with precision.
✅ Multi-Timeframe Price Action Features – This is the first-ever tool that allows traders to backtest price action with multi-timeframe features such as Fair Value Gaps (FVGs), Inversion Fair Value Gaps (IFVGs), Order Blocks & Breaker Blocks.
✅ Customizable Take-Profit Conditions – Offers various methods to set take-profit exits, including using core features from price action, and fixed exits like ATR, % change or price change, enabling traders to tailor their exit strategies to specific market behaviors.
✅ Customizable Stop-Loss Conditions – Provides several ways to set up stop losses, including using concepts from price action and trailing stops or fixed exits like ATR, % change or price change, allowing for dynamic risk management tailored to individual strategies.
✅ Integration of External Indicators – Allows the inclusion of other indicators or data sources from TradingView for creating strategy conditions, enabling traders to enhance their strategies with additional insights and data points.
By integrating these advanced features, PAT Automation ensures that traders can rigorously test and optimize their strategies with great accuracy and efficiency.
📌 HOW DOES IT WORK?
The first setting you will want to set it the pyramiding setting. This setting controls the number of simultaneous trades in the same direction allowed in the strategy. For example, if you set it to 1, only one trade can be active in any time, and the second trade will not be entered unless the first one is exited. If it is set to 2, the script will handle both of them at the same time. Note that you should enter the same value to this pyramiding setting, and the pyramiding setting in the "Properties" tab of the script for this to work.
For deep backtesting, you can set "Max Distance To Last Bar" to "Unlimited". If you encounter any memory issues, try decreasing this setting to a lower value.
You can enable and set a backtesting window that will limit the entries to between the start date & end date.
Then, you can enter your desired settings to Price Action features like FVGs, IFVGs, Order Blocks, Breaker Blocks, Liquidity Grabs, Market Structures, EQH & EQL and Volume Imbalances. You can also enable and set up to 3 timeframes, which you can use later on when customizing your strategies enter / exit conditions.
Entry Conditions
From the "Long Conditions" or the "Short Conditions" groups, you can set your position entry conditions. For settings like "initial capital" or "order size", you can open the "Properties" tab, where these are handled.
The PAT Automation can use the following conditions for entry conditions :
1. Order Block (OB)
Detection: Triggered when an Order Block forms or is detected
Retest: Triggered when price retests an Order Block. A retest is confirmed when a candle enters an Order Block and closes outside of it.
Retracement: Triggered when price touches an Order Block
Break: Triggered when an Order Block is invalidated by candle close or wick, depending on the user's input.
2. Breaker Block (BB)
Detection: Triggered when a Breaker Block forms or is detected
Retest: Triggered when price retests a Breaker Block. A retest is confirmed when a candle enters a Breaker Block and closes outside of it.
Retracement: Triggered when price touches a Breaker Block
Break: Triggered when a Breaker Block is invalidated by candle close or wick, depending on the user's input.
3. Fair Value Gap (FVG)
Detection: Triggered when an FVG forms or is detected
Retest: Triggered when price retests an FVG. A retest is confirmed when a candle enters an FVG and closes outside of it.
Retracement: Triggered when price touches an FVG
Break: Triggered when an FVG is invalidated by candle close or wick, depending on the user's input.
4. Inversion Fair Value Gap (IFVG)
Detection: Triggered when an IFVG forms or is detected
Retest: Triggered when price retests an IFVG. A retest is confirmed when a candle enters an IFVG and closes outside of it.
Retracement: Triggered when price touches an IFVG
Break: Triggered when an IFVG is invalidated by candle close or wick, depending on the user's input.
5. Break of Structure (BOS)
Detection: Triggered when a BOS forms or is detected
6. Change of Character (CHoCH)
Detection: Triggered when a CHoCH forms or is detected
7. Change of Character Plus (CHoCH+)
Detection: Triggered when a CHoCH+ forms or is detected
8. Volume Imbalance (VI)
Detection: Triggered when a Volume Imbalance forms or is detected
9. Equal High (EQH)
Detection: Triggered when an EQH is detected
10. Equal Low (EQL)
Detection: Triggered when an EQL is detected
11. Buyside Liquidity Grab
Detection: Triggered when a liquidity grab occurs at Buyside Liquidity (BSL).
12. Sellside Liquidity Grab
Detection: Triggered when a liquidity grab occurs at Sellside Liquidity (SSL).
🕒 TIMEFRAME CONDITIONS
The PAT Automation supports Multi-Timeframe (MTF) features, just like the Price Action Toolkit. When setting an entry condition, you can also choose the timeframe.
To set up MTF conditions, navigate to the 'Timeframes' section in the settings, select your desired timeframes, and enable them. You can choose up to three timeframes.
Once you've selected your timeframes, you can use them in your strategy. When setting long and short entry / exit conditions, you can choose from Timeframe 1, Timeframe 2, or Timeframe 3.
External Conditions
Users can use external indicators on the chart to set entry conditions.
The second dropdown in the external condition settings allows you to choose a conditional operator to compare external outputs. Available options include:
Less Than or Equal To: <=
Less Than: <
Equal To: =
Greater Than: >
Greater Than or Equal To: >=
The position entry conditions work like this ;
Each side has 5 Price Action conditions and 1 Source condition. Each condition can be enabled or disabled using the checkbox on the left side.
For Price Action Conditions, you can set a direction: "Any", "Bullish" or "Bearish".
Then a Price Action Feature, like "FVG" or "Order Block".
The last part of our constructed condition is the alert type, which you can select between "Detection", "Retest", "Retracement" or "Break".
Now you should have a constructed condition, which should look like "Bullish Order Block Retest".
You can select which timeframe should this condition work on from Timeframe 1, 2 or 3. If you select "Any Timeframe", the condition will work for all timeframes.
Lastly select the step of this condition from 1 to 6.
The Source Condition
The last condition on each side is a source condition that is different from the others. Using this condition, you can create your own logic using other indicators' outputs on your chart. For example, suppose that you have an EMA indicator in your chart. You can have the source condition to something like "EMA > high".
The Step System
Each condition has a step number, and conditions are in topological order based on them.
The conditions are executed step by step. This means the condition with step 2 cannot be executed before the condition with step 1 is executed.
Conditions with the same step numbers have "OR" logic. This means that if you have 2 conditions with step 3, the condition with step 4 can trigger after only one of the step 3 conditions is executed.
➕ OTHER ENTRY FEATURES
The PAT Automation allows traders to choose when to execute trades and when not to execute trades.
1. Only Take Trades
This setting lets users specify the time period when their strategy can open or execute trades.
2. Don't Take Trades
This setting lets users specify time periods when their strategy can't open or execute trades.
↩️ EXIT CONDITIONS
1. Exit on Opposite Signal
When enabled, a long position will close when short entry conditions are met, and a short position will close when long entry conditions are met.
2. Exit on Session End
When enabled, positions will be closed at the end of the trading session.
📈 TAKE PROFIT CONDITIONS
There are several methods available for setting take profit exits and conditions.
1. Entry Condition TP
Users can use entry conditions as triggers for take-profit exits. This setting can be found under the long and short exit conditions.
2. Fixed TP
Users can set a fixed TP for exits. This setting can be found under the long and short exit conditions. Users can choose between the following:
Price: This method triggers a TP exit when price reaches a specified level. For example, if you set the Price TP to 10 and buy NASDAQ:TSLA at $190, the trade will automatically exit when the price reaches $200 ($190 + $10).
Ticks: This method triggers a TP exit when price moves a specified number of ticks.
Percentage (%): This method triggers a TP exit when price moves a specified percentage.
ATR: This method triggers a TP exit based on a specified multiple of the Average True Range (ATR).
📉 STOP LOSS CONDITIONS
There are several methods available for setting stop-loss exits and conditions.
1. Entry Condition SL
Users can use entry conditions as triggers for stop-loss exits. This setting can be found under the long and short exit conditions.
2. Fixed SL
Users can set a fixed SL for exits. This setting can be found under the long and short exit conditions. Users can choose between the following:
Price: This method triggers a SL exit when price reaches a specified level. For example, if you set the Price SL to 10 and buy NASDAQ:TSLA at $200, the trade will automatically exit when the price reaches $190 ($200 - $10).
Ticks: This method triggers a SL exit when price moves a specified number of ticks.
Percentage (%): This method triggers a SL exit when price moves a specified percentage.
ATR: This method triggers a SL exit based on a specified multiple of the Average True Range (ATR).
3. Trailing Stop
An explanation & example for the trailing stop feature is present on the write-up within the next section.
Exit conditions have the same logic of constructing conditions like the entry ones. You can construct a Take-Profit Condition & a Stop-Loss Condition. Note that the Take-Profit condition will only work if the position is in profit, regardless of if it's triggered or not. The same applies for the Stop-Loss condition, meaning that it will only work if the position is in loss.
You can also set a Fixed TP & Fixed SL based on the price movement after the position is entered. You have options like "Price", "Ticks", "%", or "Average True Range". For example, you can set a Fixed TP like "5%", and the position will be entered once it moves 5% up in a long position.
Trailing Stop
For the Fixed SL, you also have a "Trailing" stop option, which you can set it's activation level as well. The Trailing stop activation level and it's value are expressed in ticks. Check this scenerio for an example :
We have a ticker with a tick value of $1. Our Trailing Stop is set to 10 ticks and activation level is set to 30 ticks.
We buy 1 contract when the price is $100.
When the price becomes $110, we are in $10 (10 ticks) profit and the trailing stop is now activated.
The current price our stop's on is $110 - $30 (30 ticks), which is the level of $80.
The trailing stop will only move if the price moves up the highest high the price has been after we entered the position.
Let's suppose that price moves up $40 right after our trailing stop is activated. The price will now be $150, and our trailing stop will sit on $150 - $30 (30 ticks) = $120.
If the price is down the $120 level, our stop loss will be triggered.
There is also a "Hard SL" option designed for a backup stop-loss when trailing stops are enabled. You can enable & set this option and if the price goes down before our trailing stop even activates, the position will be exited.
You can also move stop-loss to the break-even (entry price of the position) after a certain profit is achieved using the last setting of the exit conditions. Note that for this to work, you will need to have a Fixed SL set-up.
➕ OTHER EXIT FEATURES
1. Move Stop Loss to Breakeven
This setting allows the strategy to automatically move the SL to Breakeven (BE) when the position is in profit by a certain amount. Users can choose between the following:
Price: This method moves the SL to BE when price reaches a specified level.
Ticks: This method moves the SL to BE when price moves a specified number of ticks.
Percentage (%): This method moves the SL to BE when price moves a specified percentage.
ATR: This method moves the SL to BE when price moves a specified multiple of the Average True Range (ATR).
Example Entry Scenario
To give an example , check this scenario; out conditions are :
LONG CONDITIONS
Bullish Order Block Detection, Step 1
Bullish CHoCH Detection, Step 2
Bullish Volume Imbalance Detection, Step 2
Bullish IFVG Retest, Step 3
First, the strategy needs to detect a Bullish Order Block in order to start working.
After it's detected, now it's looking for either a CHoCH, or a Volume Imbalance to proceed to the next step, the reason for this is that they both have the same step number.
After one of them is detected, the strategy will consistently check all IFVGs for a retest. If the retest occurs, a long position will be entered.
⏰ ALERTS
This indicator uses TradingView's strategy alert system. All entries and exits will be sent as an alert if configured. It's possible to further customize these alerts to your liking. For more information check TradingView's strategy alert customization page: www.tradingview.com
⚙️ SETTINGS
1. Backtesting Settings
Pyramiding: Controls the number of simultaneous trades allowed in the strategy. This setting must have the same value that is entered on the script's properties tab on the settings pane.
Max Distance to Last Bar: Determines the depth of historical data used to prevent memory overload.
Enable Custom Backtesting Period: Restricts backtesting to a specific date range.
Start & End Time Configuration: Define precise start and end dates for historical analysis.
2. Fair Value Gaps Settings
Zone Invalidation: Select between "Wick" and "Close" invalidation.
Filtering: Choose between "Average Range" and "Volume Threshold".
FVG Sensitivity: Ranges from Extreme to Low to detect FVGs with varying strictness.
Allow Gaps: Enables analysis on tickers that have different open-close price gaps.
3. Inversion Fair Value Gaps Settings
Zone Invalidation: Choose between "Wick" and "Close".
4. Order Block Settings
Swing Length: Adjusts the minimum number of bars required for OB formation.
Zone Invalidation Method: Select between "Wick" and "Close".
5. Breaker Block Settings
Zone Invalidation: Set invalidation method as "Wick" or "Close".
6. Liquidity Grabs Settings
Pivot Length: Adjusts the number of bars used to detect liquidity grabs.
Wick-Body Ratio: Defines the proportion of wick-to-body size for liquidity grab detection.
7. Multi-Timeframe Analysis
Enable Up to Three Timeframes: Select and analyze trades across multiple timeframes.
8. Market Structures
Swing Length: Defines the number of bars required for structure shifts.
Includes BOS, CHoCH, CHoCH+ Detection.
9. Equal Highs & Lows
ATR Multiplier: Defines the sensitivity of equal highs/lows detection.
10. Volume Imbalances
Gap Size Sensitivity: Ranges from "Ultra" to "Low".
Disable Overnight Gaps: Filters out volume imbalances occurring due to overnight gaps.
11. Entry Conditions for Long & Short Trades
Multiple Conditions (1-6): Configure up to six independent conditions per trade direction.
Condition Types: Options include Detection, Retest, Retracement, and Break.
Timeframe Specification: Choose between "Any Timeframe", "Timeframe 1", "Timeframe 2", or "Timeframe 3".
Trade Execution Filters: Restrict trades within specific trading sessions.
12. Exit Conditions for Long & Short Trades
Exit on Opposite Signal: Automatically exit trades upon opposite trade conditions.
Exit on Session End: Closes all positions at the end of the trading session.
Multiple Take-Profit (TP) and Stop-Loss (SL) Configurations:
TP/SL based on % move, ATR, Ticks, or Fixed Price.
Hard SL option for additional risk control.
Move SL to BE (Break Even) after a certain profit threshold.

Flux Charts - SFX Automation💎 GENERAL OVERVIEW
The SFX Automation is a powerful and versatile tool designed to help traders rigorously test their trading strategies against historical market data. With various advanced settings, traders can fine-tune their strategies, assess performance, and identify key improvements before deploying in live trading environments. This tool offers a wide range of configurable settings, explained within this write-up.
Features of the new SFX Automation :
Step By Step : Configure your strategy step by step, which will allow you to have OR & AND logic in your strategies.
Highly Configurable : Offers multiple parameters for fine-tuning trade entry and exit conditions.
Multi-Timeframe Analysis : Allows traders to analyze multiple timeframes simultaneously for enhanced accuracy.
Provides advanced stop-loss, take-profit, and break-even settings.
Incorporates Buy & Sell signals, with settings like Signal Sensitivity, Strength, Time Weighting, Dynamic TP & SL Methods and more for refined strategy execution.
🚩 UNIQUENESS
The SFX Automation stands out from conventional backtesting tools due to its unparalleled flexibility, precision, and advanced trading logic integration. Key factors that make it unique include:
✅ Comprehensive Strategy Customization – Unlike traditional backtesters that offer basic entry and exit conditions, SFX Automation provides a highly detailed parameter set, allowing traders to fine-tune their strategies with precision.
✅ Multi-Timeframe Signals – This is the first-ever tool that allows traders to backtest Buy & Sell Signals on multiple timeframes.
✅ Customizable Take-Profit Conditions – Offers various methods to set take-profit exits, including using core features from SFX Algo, and dynamic exits like signal rating upgrades/downgrades, enabling traders to tailor their exit strategies to specific market behaviors.
✅ Customizable Stop-Loss Conditions – Provides several ways to set up stop losses, including using concepts from SFX Algo and trailing stops or dynamic exits like signal rating upgrades/downgrades, allowing for dynamic risk management tailored to individual strategies.
✅ Integration of External Indicators – Allows the inclusion of other indicators or data sources from TradingView for creating strategy conditions, enabling traders to enhance their strategies with additional insights and data points.
By integrating these advanced features, SFX Automation ensures that traders can rigorously test and optimize their strategies with great accuracy and efficiency.
📌 HOW DOES IT WORK ?
The first setting you will want to set it the pyramiding setting. This setting controls the number of simultaneous trades in the same direction allowed in the strategy. For example, if you set it to 1, only one trade can be active in any time, and the second trade will not be entered unless the first one is exited. If it is set to 2, the script will handle both of them at the same time. Note that you should enter the same value to this pyramiding setting, and the pyramiding setting in the "Properties" tab of the script for this to work.
You can enable and set a backtesting window that will limit the entries to between the start date & end date.
Entry Conditions
From the "Long Conditions" or the "Short Conditions" groups, you can set your position entry conditions. For settings like "initial capital" or "order size", you can open the "Properties" tab, where these are handled.
The SFX Algo can use the following conditions for entry conditions :
1. Buy Signal (Any, or 1-5 ☆)
This condition is triggered when a Buy Signal occurs. Other timeframes are supported with this condition.
2. Buy | TP (1, 2 or 3)
This condition is triggered when a TP signal of any Buy signal occurs.
3. Buy | SL
This condition is triggered when a SL signal of any Buy signal occurs.
4. Buy | Rating Upgrade
This condition is triggered when the rating of a buy signal is increased.
5. Buy | Rating Downgrade
This condition is triggered when the rating of a buy signal is decreased.
6. Sell Signal (Any, or 1-5 ☆)
This condition is triggered when a Sell Signal occurs. Other timeframes are supported with this condition.
7. Sell | TP (1, 2 or 3)
This condition is triggered when a TP signal of any Sell signal occurs.
8. Sell | SL
This condition is triggered when a SL signal of any Sell signal occurs.
9. Sell | Rating Upgrade
This condition is triggered when the rating of a sell signal is increased.
10. Sell | Rating Downgrade
This condition is triggered when the rating of a sell signal is decreased.
11. Retracement Wave Retest (Bullish or Bearish)
A retest on the Retracement Wave occurs when the price temporarily moves against the prevailing trend, touching or entering the wave before continuing in the original trend direction. This retest serves as a confirmation that the wave is acting as dynamic support or resistance.
12. Retracement Wave Retracement (Bullish or Bearish)
A retracement on the Retracement Wave occurs when the price touches the wave, the condition is triggered immediately.
13. Volatility Bands Retest (Bullish or Bearish)
A retest of Volatility Bands occurs when the price initially moves beyond the bands, then pulls back to "retest" the band it just broke through before continuing its move. This can provide traders with confirmation of a breakout or signal a potential reversal.
14. Volatility Bands Retracement (Bullish or Bearish)
A retracement on the Volatility Bands occur when the price touches the band, the condition is triggered immediately.
🕒 TIMEFRAME CONDITIONS
The SFX Automation supports Multi-Timeframe (MTF) features for Buy & Sell signals. When setting an entry condition, you can also choose the timeframe.
External Conditions
Users can use external indicators on the chart to set entry conditions.
The second dropdown in the external condition settings allows you to choose a conditional operator to compare external outputs. Available options include:
Less Than or Equal To: <=
Less Than: <
Equal To: =
Greater Than: >
Greater Than or Equal To: >=
The position entry conditions work like this ;
Each side has 3 SFX Algo conditions and 2 Source conditions. Each condition can be enabled or disabled using the checkbox on the left side of them.
You can select which timeframe this condition should work on for Buy & Sell signals. If you select "Chart", the condition will work for the chart's current timeframe.
Lastly select the step of this condition from 1 to 6.
The Source Condition
The last condition on each side is a source condition that is different from the others. Using this condition, you can create your own logic using other indicators' outputs on your chart. For example, suppose that you have an EMA indicator in your chart. You can have the source condition to something like "EMA > high".
The Step System
Each condition has a step number, and conditions are in topological order based on them.
The conditions are executed step by step. This means the condition with step 2 cannot be executed before the condition with step 1 is executed.
Conditions with the same step numbers have "OR" logic. This means that if you have 2 conditions with step 3, the condition with step 4 can trigger after only one of the step 3 conditions is executed.
➕ OTHER ENTRY FEATURES
The SFX Automation allows traders to choose when to execute trades and when not to execute trades.
1. Only Take Trades
This setting lets users specify the time period when their strategy can open or execute trades.
2. Don't Take Trades
This setting lets users specify time periods when their strategy can't open or execute trades.
↩️ EXIT CONDITIONS
1. Exit on Opposite Signal
When enabled, a long position will close when short entry conditions are met, and a short position will close when long entry conditions are met.
2. Exit on Session End
When enabled, positions will be closed at the end of the trading session.
📈 TAKE PROFIT CONDITIONS
There are several methods available for setting take profit exits and conditions.
1. Entry Condition TP
Users can use entry conditions as triggers for take profit exits. This setting can be found under the long and short exit conditions.
2. Fixed TP
Users can set a fixed TP for exits. This setting can be found under the long and short exit conditions. Users can choose between the following:
Price: This method triggers a TP exit when price reaches a specified level. For example, if you set the Price TP to 10 and buy NASDAQ:TSLA at $190, the trade will automatically exit when the price reaches $200 ($190 + $10).
Ticks: This method triggers a TP exit when price moves a specified number of ticks.
Percentage (%): This method triggers a TP exit when price moves a specified percentage.
ATR: This method triggers a TP exit based on a specified multiple of the Average True Range (ATR).
🧩EXIT PERCENTAGES
For each 3 dynamic take-profit conditions, you can set the amount of the position to exit in terms of percentage. It's important to make sure that the total of the exit percentages are 100%.
📉 STOP LOSS CONDITIONS
There are several methods available for setting stop-loss exits and conditions.
1. Entry Condition SL
Users can use entry conditions as triggers for stop-loss exits. This setting can be found under the long and short exit conditions.
2. Fixed SL
Users can set a fixed SL for exits. This setting can be found under the long and short exit conditions. Users can choose between the following:
Price: This method triggers a SL exit when price reaches a specified level. For example, if you set the Price SL to 10 and buy NASDAQ:TSLA at $200, the trade will automatically exit when the price reaches $190 ($200 - $10).
Ticks: This method triggers a SL exit when price moves a specified number of ticks.
Percentage (%): This method triggers a SL exit when price moves a specified percentage.
ATR: This method triggers a SL exit based on a specified multiple of the Average True Range (ATR).
3. Trailing Stop
An explanation & example for the trailing stop feature is present on the write-up within the next section.
Exit conditions have the same logic of constructing conditions like the entry ones. You can construct a Take-Profit Condition & a Stop-Loss Condition. Note that the Take-Profit condition will only work if the position is in profit, regardless of if it's triggered or not. The same applies for the Stop-Loss condition, meaning that it will only work if the position is in loss.
You can also set a Fixed TP & Fixed SL based on the price movement after the position is entered. You have options like "Price", "Ticks", "%", or "Average True Range". For example, you can set a Fixed TP like "5%", and the position will be entered once it moves 5% up in a long position.
Trailing Stop
For the Fixed SL, you also have a "Trailing" stop option, which you can set it's activation level as well. The Trailing stop activation level and it's value are expressed in ticks. Check this scenerio for an example :
We have a ticker with a tick value of $1. Our Trailing Stop is set to 10 ticks, and the activation level is set to 30 ticks.
We buy 1 contract when the price is $100.
When the price becomes $110, we are in $10 (10 ticks) profit and the trailing stop is now activated.
The current price our stop's on is $110 - $30 (30 ticks), which is the level of $80.
The trailing stop will only move if the price moves up the highest high the price has been after we entered the position.
Let's suppose that price moves up $40 right after our trailing stop is activated. The price will now be $150, and our trailing stop will sit on $150 - $30 (30 ticks) = $120.
If the price is down the $120 level, our stop loss will be triggered.
There is also a "Hard SL" option designed for a backup stop-loss when trailing stops are enabled. You can enable & set this option and if the price goes down before our trailing stop even activates, the position will be exited.
You can also move stop-loss to the break-even (entry price of the position) after a certain profit is achieved using the last setting of the exit conditions. Note that for this to work, you will need to have a Fixed SL setup.
➕ OTHER EXIT FEATURES
1. Move Stop Loss to Breakeven
This setting allows the strategy to automatically move the SL to Breakeven (BE) when the position is in profit by a certain amount. Users can choose between the following:
Price: This method moves the SL to BE when price reaches a specified level.
Ticks: This method moves the SL to BE when price moves a specified number of ticks.
Percentage (%): This method moves the SL to BE when price moves a specified percentage.
ATR: This method moves the SL to BE when price moves a specified multiple of the Average True Range (ATR).
Example Entry Scenario
To give an example , check this scenario; out conditions are :
LONG CONDITIONS
Buy Signal Any☆, Step 1
Bullish R. Wave Retest, Step 2
Bullish V. Bands Retest, Step 2
open > close, Step 3
First, the strategy needs to detect a Buy Signal with any star rating in order to start working.
After it's detected, now it's looking for either a Bullish R. Wave Retest, or a Bullish V. Bands Retest to proceed to the next step, the reason for this is that they both have the same step number.
After one of them is detected, the strategy will consistently check candlesticks for the condition open > close. If a bullish candlestick occurs, a long position will be entered.
⏰ ALERTS
This indicator uses TradingView's strategy alert system. All entries and exits will be sent as an alert if configured. It's possible to further customize these alerts to your liking. For more information, check TradingView's strategy alert customization page: www.tradingview.com
⚙️ SETTINGS
1. Backtesting Settings
Pyramiding: Controls the number of simultaneous trades allowed in the strategy. This setting must have the same value that is entered on the script's properties tab on the settings pane.
Enable Custom Backtesting Period: Restricts backtesting to a specific date range.
Start & End Time Configuration: Define precise start and end dates for historical analysis.
2. Algorithm Settings
Sensitivity: The sensitivity setting is a key parameter that influences the number of signals the SFX Algo generates. By adjusting this parameter, you can control the frequency of signals produced by the algorithm.
Signal Strength: The Signal Strength setting filters signals based on their quality, allowing traders to focus on the most reliable opportunities. This feature helps traders balance the quantity and reliability of the algorithm’s signals to suit their trading strategy.
Time Weighting: The Time Weighting setting determines how the SFX Algo evaluates historical market data to generate signals.
a) Recent Trends
Focuses on the most recent movements for short-term analysis. This setting is good for scalpers and intraday traders who need to react quickly to market changes.
b) Mixed Trends
Balances recent and historical price movements for a comprehensive market view. This setting is well-suited for swing traders and those who want to capture medium-term opportunities by combining the benefits of short-term responsiveness with the reliability of long-term trends.
c) Long-term Trends
Relies on extended historical market data to identify broader market trends, making it an excellent choice for traders focused on long-term strategies.
Minimum Star Rating: The Minimum Star Rating setting allows you to filter signals based on their strength, showing only those that meet or exceed your chosen threshold. For instance, setting the minimum star rating to 3 ensures you only receive signals with a rating of 3 stars or higher.
3. Take Profit / Stop Loss Methods
Key Levels
The Key Levels method uses pivot points to set take profit and stop-loss levels. The TP and SL levels are shown when a new signal is generated.
Volatility Bands
This TP/SL method uses the Volatility Bands overlay to set dynamic TP and SL levels. These levels are not predetermined so they will not be shown in advance when a signal is generated.
Signal Rating
Sets take profit and stop-loss levels based on changes in a signal's rating strength. These levels are not predetermined so they will not be shown in advance when a signal is generated.
Auto Stop-Loss
The auto method can only be applied to the SL. The auto method allows the algorithm to detect SL automatically when a momentum shift is detected. You can adjust the risk tolerance of the Auto SL by adjusting the ‘Auto Risk Tolerance’ setting. You can choose between Low, Medium, and High. A high-risk tolerance will result in stop losses being triggered less often.
4. Entry Conditions for Long & Short Trades
Multiple Conditions (1-6): Configure up to six independent conditions per trade direction.
Timeframe Specification: Choose between timeframes for Buy & Sell signals.
Trade Execution Filters: Restrict trades within specific trading sessions.
5. Exit Conditions for Long & Short Trades
Exit on Opposite Signal: Automatically exit trades upon opposite trade conditions.
Exit on Session End: Closes all positions at the end of the trading session.
Multiple Take-Profit (TP) and Stop-Loss (SL) Configurations:
TP/SL based on % move, ATR, Ticks, or Fixed Price.
Hard SL option for additional risk control.
Move SL to BE (Break Even) after a certain profit threshold.
