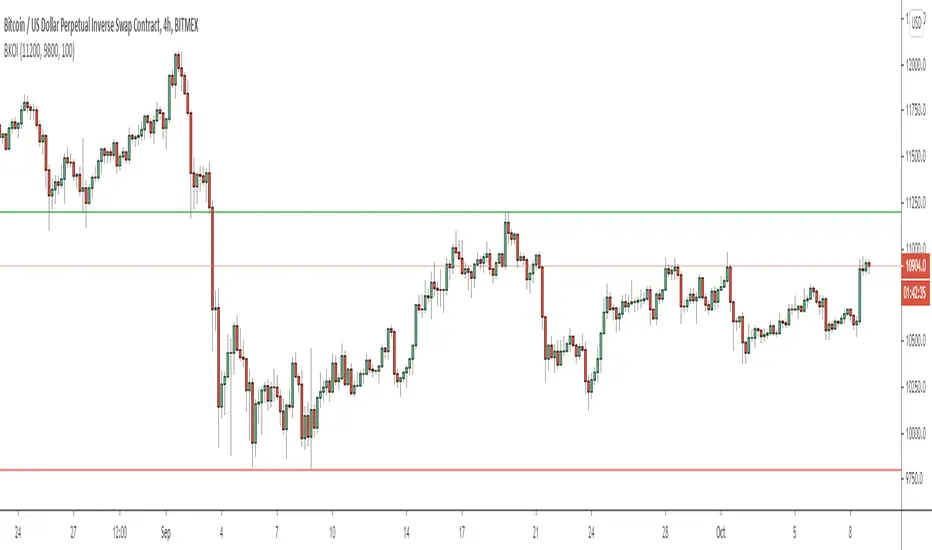
Breakout IndicatorThis script allows you to set breakout alerts.
An alert will be triggered only when price breaks and closes beyond the specified prices. You will get an alert on the first candle that closes beyond the levels you set.
在脚本中搜索"alert"
WaveTrend with Crosses and Alerts - Jab ZootaLazy bear created this script. I added alertconditions to send alerts on crossovers.

CM_Ultimate_MA_MTF_V2 with Alert Long and Short Hello All,
Here is a scirpt of ChrisMoody modified with the alerts of purchases and sales.
I just have a problem with automation. At the bottom of my script my alerts "Buy1" and "Sell2" give alerts constantly and I wish to have a single alert before the order is completed. Before "Sell1" or Buy2 ".
I found the function "barstate.isfirst" that could possibly work?
Does anyone have an idea ? :)

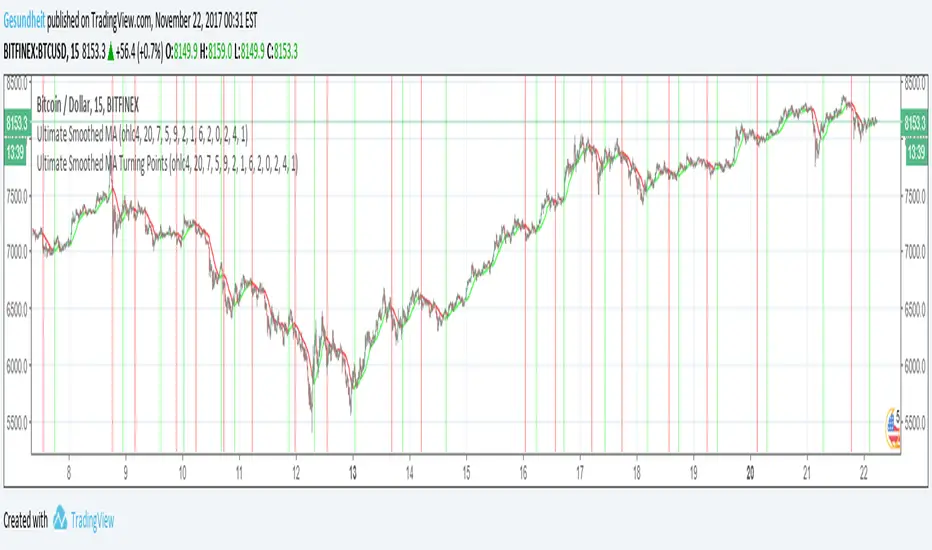
Ultimate Smoothed MA Turning PointsCompanion script to "Ultimate Smoothed MA" , details in that description.
Adapted from Chris Moody's "Ultimate Moving Average-Multi-TimeFrame-7 MA Types"
If you'd like to receive alerts on turning points, the conditions in line 96 and 97 can be used for alertcondition.
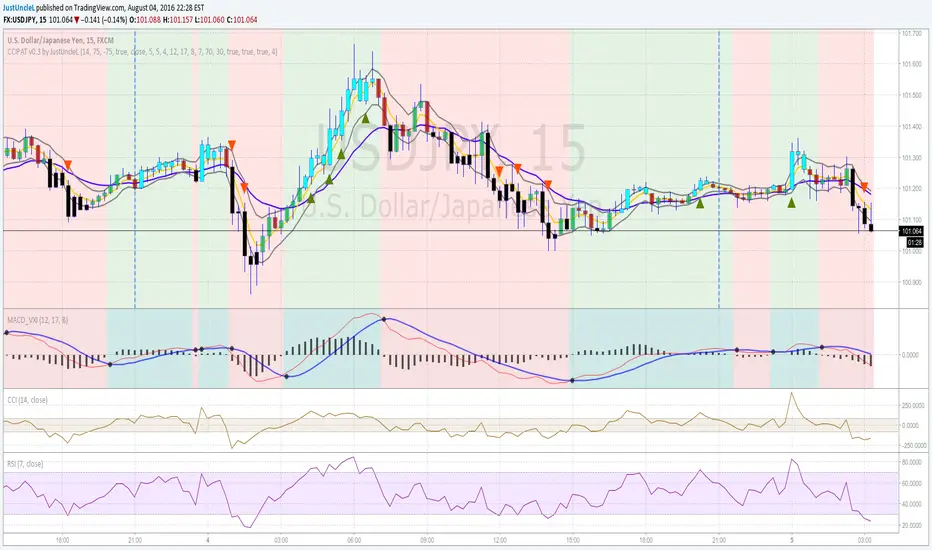
Price Action Trading System v0.3 by JustUncleLThis is an updated and improved version of my "Price Action Trading strategy". I have added two extra optional filters, one is a trend direction filter based on the MACD slow EMA(17), blue line, and the other is a RSI(7) filter which works similarly to CCI(14) but slightly different dynamics (thank you to gianfranco60 for the suggestion). Also made a couple of corrections:
- input for lenLower minval=1 should be maxval=-1
- one bar pullback did not reset trigger, missing some alerts
Some Notes about usage:
- this is an alert indicator not a signal generator, each alert is a strong trend continuance candidate,
but should be treated on it's own merits by looking at chart dynamics and market conditions.
- will work well on trending markets only.
- works best on the first alert after MACD cross over.
- don't take trades when MACD and signal are close together.
- don't trade when channel and slow MA are flat or close together or
chopper (yellow and blue MA cross over quickly over short period).
[AutoView] Trailing Stop Back Testing and alerts + TP and TSThe number one request since the creation of autoview was to have alerts triggered for Take Profit, Stop Loss and Trailing Stops. Finally, we've figured it out, and as an additional bonus, this allows us to back test trailing stops in the strategy tester.
YouTube Video about this script and setup: bit.ly
This script contains 2 things people have been asking for, multiple time frames and of course, a trailing stop that can be both back tested and setup for alerts.
This strategy itself seems to perform better without the use of the Trailing Stop, so play around and monitor it before actually trying to trade it live.
View all the trades being tracked in a Google Sheets here: bit.ly
To learn more about back testing strategies, automation and AutoView join our free slack group via slack.crypto.pink
Referral Tax:
This requires 4 alerts, so you are going to have to upgrade to PRO. It'd be greatly appreciated if you signed up using our referral link.
bit.ly
1Broker
bit.ly
okcoin
bit.ly

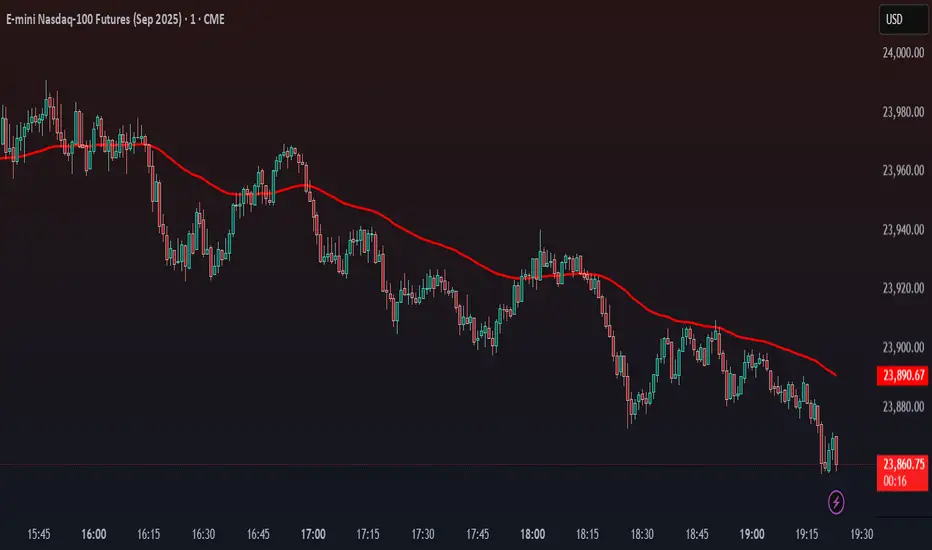
SMT + CVD (NQ vs ES) w/ AlertsSMT + CVD (NQ vs ES) w/ Alerts
This tool combines Smart Money Technique (SMT) and Cumulative Volume Delta (CVD) to highlight high-probability inflection points on NQ (primary) versus ES (secondary).
How it works
SMT condition: the primary breaks its most recent swing (High for bearish / Low for bullish) while the secondary does not break the corresponding swing within a small retest window.
CVD confirmation: at the same time, the primary’s CVD shows divergence (higher price but lower/equal CVD for shorts, lower price but higher/equal CVD for longs).
When both align, the script plots a marker/label and draws a line from the primary swing to the signal bar. Alerts are fired.
Signals & Alerts
Labels: “SMT+CVD DOWN/UP” on the signal bar.
Lines: connects the primary swing → signal bar so you can see the structure that produced the signal.
Alert names: “SMT+CVD Bearish” and “SMT+CVD Bullish.”
Inputs
Primary / Secondary symbols: defaults NQ & ES (you can change them).
Resolution: use chart timeframe or specify one.
Swing Left/Right Bars: pivot detection depth (higher = larger swings).
Break Window Bars: how many bars the secondary has to not break for SMT to be valid.
CVD Up/Down By: Close vs Previous Close (default) or Close vs Open.
Anchor CVD Daily: resets CVD at session/day start.
CVD Smoothing (EMA): smooths the CVD line (optional show).
FAST Pivots (no future bars): left-only swing detection so signals appear sooner and behave well in Replay/live.
Require Secondary Pivot: if ON, SMT checks wait for a confirmed secondary swing; if OFF, signals can appear while the secondary swing is still forming (useful for Replay/testing).
Show CVD line: optional, may compress price scale.
Non-repaint notes
With FAST Pivots ON, swings are detected with no future bars (minimal latency = leftBars).
With FAST Pivots OFF, standard pivots require rightBars future bars to confirm the swing (classic, but naturally delayed).
Tips
For intraday futures, keep leftBars/rightBars small (e.g., 3/3) and Break Window 1–3.
In Replay, enable FAST Pivots and consider disabling Require Secondary Pivot if you want signals to appear as soon as the primary breaks.
Combine with session filters, execution rules, or liquidity zones for context.

Price Above PDH - Complete Multi-Confirmation Alert
Cashapp $jmoskyhigh
Initial Breakout: Must have ALL confirmations to even start counting
During Hold Period: If ANY confirmation fails at ANY bar, the counter RESETS to zero
Must Re-qualify: If confirmations fail, must cross PDH again with all confirmations to restart
Alert Only Fires: When ALL confirmations are continuously met for the ENTIRE hold period
3. Visual Feedback:
Green background: Above PDH + ALL confirmations present
Red background: Above PDH but MISSING one or more confirmations
Red X above bar: Shows when a confirmation is lost during breakout (counter resets)
Green triangle with "✓ ALL": Alert triggered after full confirmation period
4. Example Scenario:
Scenario 1 - SUCCESS:
Bar 1: Price crosses PDH, Volume spike, MA bullish, Above VWAP → Counter = 1
Bar 2: Still above PDH, ALL confirmations still met → Counter = 2
Bar 3: Still above PDH, ALL confirmations still met → Counter = 3
Bar 4: Still above PDH, ALL confirmations still met → Counter = 4
Bar 5: Still above PDH, ALL confirmations still met → Counter = 5 → ALERT!
Scenario 2 - FAILURE (resets):
Bar 1: Price crosses PDH, Volume spike, MA bullish, Above VWAP → Counter = 1
Bar 2: Still above PDH, ALL confirmations still met → Counter = 2
Bar 3: Still above PDH, but volume drops below threshold → RESET Counter = 0
Bar 4: Still above PDH, ALL confirmations back → Counter = 1 (starts over)
5. Info Panel:
Shows which specific confirmations are failing
"OFF" displayed for disabled confirmations
Big "ALL CONFIRMED" row shows overall status
Warning message if confirmations are lost during breakout
This ensures you only get alerts when the setup is truly strong with ALL confirmations maintained throughout the entire hold period! 🎯

Ichimoku Cloud Indicator [TradingFinder] Kinko Hyo Cross Alerts🔵 Introduction
The Ichimoku Cloud (Ichimoku Kinko Hyo) is one of the most powerful and complete trading indicators in technical analysis. Originally developed by Japanese journalist Goichi Hosoda, the Ichimoku system combines multiple tools in one indicator, providing traders with instant insights into trend direction, support and resistance levels, and momentum. Unlike simple moving averages (SMA – Simple Moving Average), the Ichimoku Cloud (Kumo – Cloud) integrates dynamic elements that help traders forecast potential price action with greater clarity.
The Ichimoku Indicator (Ichimoku Signal System) is widely used across global markets, from Forex trading (FX – Foreign Exchange) to stocks, indices, and even cryptocurrencies. Its popularity comes from its ability to generate clear buy signals and sell signals based on the interaction of its components: Tenkan Sen (Conversion Line), Kijun Sen (Base Line), Senkou Span A, Senkou Span B, and Chikou Span (Lagging Line). When combined, these lines create the Ichimoku Cloud, which visually represents the balance between price action and market structure.
Ichimoku Cloud Lines Formulas :
Conversion Line (Tenkan Sen / Conversion Line) : Average of the highest high and lowest low over the past 9 periods => (9-PH + 9-PL) ÷ 2
Base Line (Kijun Sen / Base Line) : Average of the highest high and lowest low over the past 26 periods => (26-PH + 26-PL) ÷ 2
Leading Span A (Senkou Span A / Leading Span A) : Average of the Conversion Line and Base Line, plotted 26 periods ahead => (Tenkan Sen + Kijun Sen) ÷ 2
Leading Span B (Senkou Span B / Leading Span B) : Average of the highest high and lowest low over the past 52 periods, plotted 26 periods ahead => (52-PH + 52-PL) ÷ 2
Lagging Span (Chikou Span / Lagging Span) : Current closing price, plotted 26 periods behind.
One of the biggest advantages of the Ichimoku Trading Strategy (Ichimoku Cloud Trading System) is that it allows traders to identify the market condition at a glance. When the price is above the Kumo (Cloud), it indicates a bullish trend (uptrend). When the price is below the Kumo, the market is in a bearish trend (downtrend). And when the price is inside the cloud, the market is ranging (sideways trend). This simplicity and visual clarity make Ichimoku an essential indicator for both beginner traders and professional analysts.
The Ichimoku Cloud Indicator (Ichimoku Technical Analysis Tool) continues to be one of the most reliable charting methods. Traders often consider it superior to basic moving averages (MA – Moving Average) or exponential moving averages (EMA – Exponential Moving Average), because it not only shows trend direction but also highlights potential future support and resistance levels. With its unique combination of trend analysis, price forecasting, and trading signals, Ichimoku remains a core strategy in modern trading systems.
🔵 How to Use
The Ichimoku Cloud is more than just a set of lines; it’s a complete trading system that helps traders identify trends, momentum, and key support and resistance levels. By combining its five lines Conversion Line, Base Line, Leading Span A, Leading Span B, and Lagging Span traders can develop clear buy and sell strategies.
🟣 Identifying Trend Direction
Bullish Trend (Uptrend) : Price is above the cloud (Kumo), and the cloud is green. Leading Span A is above Leading Span B, signaling strong upward momentum.
Bearish Trend (Downtrend) : Price is below the cloud, and the cloud is red. Leading Span A is below Leading Span B, confirming a downward momentum.
Ranging / Sideways Market : Price is inside the cloud, indicating indecision and consolidation. Traders often avoid opening strong positions during these periods.
🟣 Buy Strategies
Conversion/Base Line Crossover : A buy signal occurs when the Conversion Line (Tenkan Sen) crosses above the Base Line (Kijun Sen). The signal is strongest when this crossover happens above the cloud.
Price Above Base Line : If the price moves above the Base Line while in an uptrend, it confirms bullish momentum and provides a favorable entry point.
Cloud Support Pullback : During a pullback in an uptrend, the price may touch or slightly enter the cloud. Traders can use the cloud as a dynamic support zone for buying opportunities.
Lagging Span Confirmation : Ensure the Lagging Span (Chikou Span) is above the price of 26 periods ago to confirm the strength of the bullish trend.
🟣 Sell Strategies
Conversion/Base Line Crossover : A sell signal is generated when the Conversion Line (Tenkan Sen) crosses below the Base Line (Kijun Sen). This signal is strongest when it occurs below the cloud.
Price Below Base Line : If the price falls below the Base Line in a downtrend, it confirms bearish momentum and strengthens the sell setup.
Cloud Resistance Pullback : During a bounce in a downtrend, the cloud acts as a resistance zone. Traders can enter sell positions when price approaches or touches the cloud from below.
Lagging Span Confirmation : The Lagging Span should be below the price of 26 periods ago, confirming downward momentum.
🟣 Cloud Breakout Signals
A strong buy occurs when the price breaks above the cloud from below, signaling a potential trend reversal.
A strong sell occurs when the price breaks below the cloud from above, indicating a shift toward a bearish trend.
🟣 Combining Signals for Stronger Entries
For higher probability trades, combine multiple signals : trend direction (cloud color and position), crossovers (Tenkan/Kijun), and Lagging Span position.
Avoid trading against the overall trend. For example, avoid buying when price is below a red cloud or selling when price is above a green cloud.
🔵 Setting
Tenkan Sen Period : Lookback period for Conversion Line (default: 9).
Kijun Sen Period : Lookback period for Base Line (default: 26).
Span B Period : Lookback period for Leading Span B, forms one Cloud boundary (default: 52).
Shift Lines : Periods forward for Cloud / backward for Lagging Span (default: 26).
Cross Tenkan/Kijun Alert : Alert on Conversion/Base Line crossover.
Cross Price/Tenkan Alert : Alert when price crosses Tenkan Sen.
Cross Price/Kijun Alert : Alert when price crosses Kijun Sen
🔵 Conclusion
The Ichimoku Cloud (Ichimoku Kinko Hyo) is much more than a simple indicator it is a complete trading system that combines trend detection, momentum analysis, and support/resistance identification in one view. By interpreting the position of price relative to the cloud, the interaction between Tenkan Sen (Conversion Line) and Kijun Sen (Base Line), the leading spans (Senkou Span A and B), and the Chikou Span (Lagging Line), traders can identify potential buy and sell opportunities with higher confidence.
The main advantage of the Ichimoku Cloud is its ability to provide a “one-look equilibrium” snapshot of the market. It highlights bullish trends when the price is above the cloud, bearish conditions when the price is below it, and indecision or transition when the price is inside the cloud. Crossovers, cloud breakouts, and confirmations by the Chikou Span strengthen the trading signals.
However, traders should keep in mind the limitations of the Ichimoku system. It is based on historical data and should not be used in isolation. Combining it with other tools such as RSI, volume analysis, or candlestick patterns can significantly improve accuracy and reduce false signals.

Stalonte EMA - Stable Long-Term EMA with AlertsStalonte EMA - The Adaptive & Stable EMA - Almost Eternal
Here's why you will love "Stalonte":
The Stalonte (Stable Long-Term EMA) is a highly versatile trend-following tool. Unlike standard EMAs with fixed periods, it uses a configurable smoothing constant (alpha), allowing traders to dial in the exact level of responsiveness and stability they need. Finding the "sweet spot" (e.g., alpha ~0.03) creates a uniquely effective moving average: it is smooth enough to filter out noise and identify safe, high-probability trends, yet responsive enough to provide actionable signals without extreme lag. It includes alerts for crossovers and retests.
Pros and Cons of the Stalonte EMA
Pros:
Unparalleled Adaptability: This is its greatest strength. The alpha input lets you seamlessly transform the indicator from an ultra-slow "trend-revealer" (low alpha) into a highly effective and "safe" trend-following tool (medium alpha, e.g., 0.03), all the way to a more reactive one.
Optimized for Safety & Signal Quality: As you astutely pointed out, with the proper setting (like 0.03), it finds the perfect balance. It provides a smoother path than a standard 20-50 period EMA, which reduces whipsaws and false breakouts, leading to safer, higher-confidence signals.
Superior Trend Visualization: It gives a cleaner and more intuitive representation of the market's direction than many conventional moving averages, making it easier to "see" the trend and stick with it.
Objective Dynamic Support/Resistance: The line created with a medium alpha setting acts as a powerful dynamic support in uptrends and resistance in downtrends, offering excellent areas for entries on retests with integrated alerts.
Cons:
Requires Calibration: The only "con" is that its performance is not plug-and-play; it requires the user to find their optimal alpha value for their specific trading style and the instrument they are trading. This demands a period of testing and customization, which a standard 50-period EMA does not.
Conceptual Hurdle: For traders only familiar with period-based EMAs, the concept of a "smoothing constant" can be initially confusing compared to simply setting a "length."
In summary:
The Stalonte EMA is not a laggy relic. It is a highly sophisticated and adaptable tool. Its design allows for precise tuning, enabling a trader to discover a setting that offers a superior blend of stability and responsiveness—a "sweet spot" that provides safer and often more effective signals than many traditional moving averages. Thank you for pushing for a more accurate and fair assessment.
Use Case Example:
You can combine it with classical EMAs to find the perfect entry.
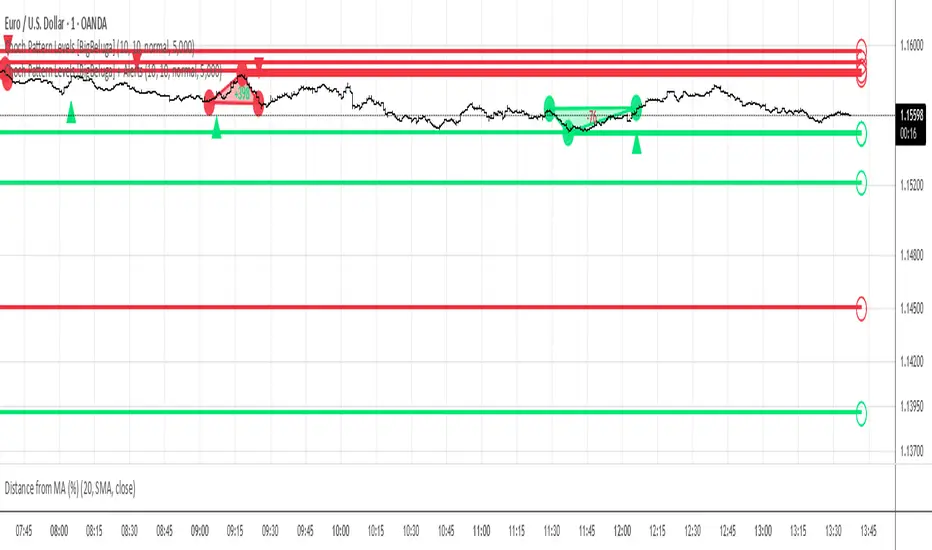
Choch Pattern Levels [BigBeluga] + AlertsThis version of Choch Pattern Levels includes built-in alert conditions for both ChoCh Up and ChoCh Down patterns. You can now set TradingView alerts directly when either pattern occurs, with optional visual markers (triangles) plotted on the chart.
Based on the original script by BigBeluga, licensed under CC BY-NC-SA 4.0. This is a modified version with alert conditions added.
SMA50 - Relleno + AlertasThis is about the 50 SMA and its relationship to price. When the price is above the 50 SMA, it is colored green, indicating a bullish trend. If the price is below the 50 SMA, it is colored red, indicating a bearish trend. It also has alerts when the trend crosses the 50 SMA.

VWAP Combo: Bands + MACD + Volume + AlertsBands: These are dynamic bands using a 20-period standard deviation and 1.5× width by default. Adjust lookback or bandMultiplier to tighten or widen.
Candle Colors: Green = MACD bullish, Red = bearish.
Volume Spike: Orange triangle when volume > 1.5× average.
Alerts: Fire on breakout, bounce, or combo confirmation.

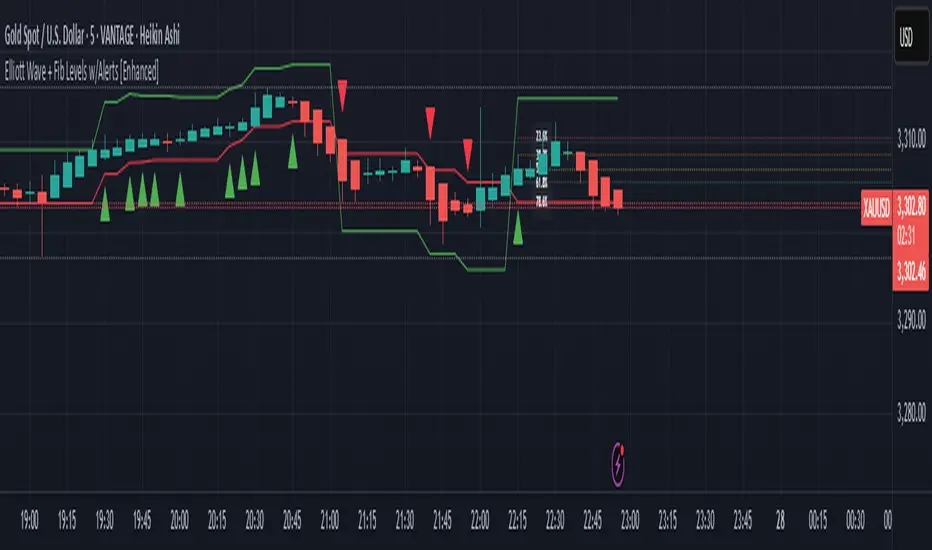
Elliott Wave + Fib Levels w/Alerts [Enhanced]Elliott Wave + Fibonacci Levels with Alerts
This powerful TradingView indicator combines Elliott Wave detection with customizable Fibonacci retracement levels to help identify key price zones and potential trade opportunities. It automatically detects bullish and bearish waves based on recent highs and lows, with an optional EMA filter to improve trend accuracy.
Key features include:
Dynamic detection of Elliott Waves based on configurable wave length.
Visualization of Fibonacci retracement levels on detected waves, with customizable percentage levels and optional labels for clarity.
ATR-based automatic calculation of stop loss and take profit levels with adjustable multipliers.
Real-time alerts triggered on new wave formations, indicating bullish or bearish setups with precise entry price details.
Clean plotting of entry signals, stop loss, and take profit zones directly on the chart.
User-friendly input controls to tailor the indicator to your trading style, including options to toggle EMA filtering, Fibonacci level display, and alert activation.
Ideal for traders looking to combine classic wave analysis with Fibonacci support/resistance levels and actionable trade alerts, this indicator streamlines technical analysis and trade management in one easy-to-use tool.
RSI Crossover Signal Companion - Alerts + Visuals🔷 RSI Crossover Signal Companion — Alerts + Visuals
The Relative Strength Index (RSI) is a momentum oscillator that measures the speed and change of recent price movements. It helps traders identify overbought or oversold conditions, possible trend reversals, and momentum strength.
This utility builds on TradingView’s classic Relative Strength Index (RSI) by adding real-time alerts and triangle markers when the RSI crosses its own moving average — a common technique for early momentum detection.
It is designed as a lightweight, visual companion tool for traders using RSI/MA crossover logic in manual or semi-automated strategies.
🔍 Features
✅ Preserves the full original RSI layout, including:
• Gradient fill and overbought/oversold zones
• Standard RSI input settings (length, source, etc.)
• MA smoothing options with user-defined type and length
🔺 Adds visual triangle markers:
🔼 Up triangle when RSI crosses above its MA
🔽 Down triangle when RSI crosses below its MA
📢 Built-in alerts for RSI/MA crosses:
“RSI Crossed Above MA”
“RSI Crossed Below MA”
📈 How to Use
This script is ideal for:
• Spotting early momentum shifts
• Confirming entries or exits in other systems (price action, trendlines, breakouts)
• Building alert-based automation (webhooks, bots, etc.)
Popular use cases:
• Combine with trend indicators like MA200 or MA12
• Use in confluence with price structure and divergence
• Validate breakout moves with momentum confirmation
⚙️ Customization
RSI length, MA length, MA type, and source are fully adjustable
Triangle marker size, shape, and color can be edited under Style
Alerts are pre-built and ready for use

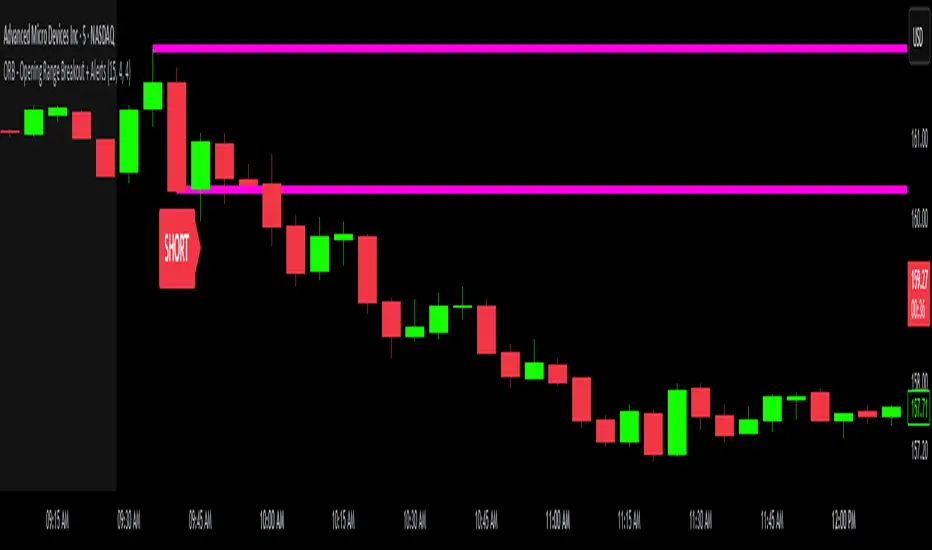
ORB - Opening Range Breakout + AlertsThe only ORB indicator you'll ever need.
- Flexible Range: Tailor the opening range (e.g., 5m, 15m, 30m) to your trading style.
- Key Levels: Auto-plots striking pink/purple support/resistance lines post-range for clear trade setups.
- Breakout Alerts: Reliable LONG/SHORT signals on 5m chart for confirmed breakouts; enable/disable as needed.
- Personalized Design: Customize line color and thickness for optimal visibility.
A friendly reminder that no tool or indicator guarantees success. Integrate this into a robust trading plan.
ICT iFVG Detector and Alert [by ote618]Description
This script detects ICT - fair value gaps (FVG) formed by price gaps between Candle 1 and Candle 3, then monitors the next 5 candles for an inverse fair value gap (iFVG).
What It Detects
Bullish FVG: When Candle 1 high is below Candle 3 low (BISI)
Bearish FVG: When Candle 1 low is above Candle 3 high (SIBI)
Once an FVG is detected, the script checks the next 5 candles:
A Bullish FVG becomes a Bearish IFVG if price closes below Candle 1 high
A Bearish FVG becomes a Bullish IFVG if price closes above Candle 1 low
Only the first bar that validates the FVG triggers the transition to an IFVG.
Visual Output
A shaded rectangle is plotted to mark the original FVG zone (from Candle 1 to Candle 3)
Color-coded:
Red for Bearish IFVG (validated Bullish IG)
Green for Bullish IFVG (validated Bearish IG)
The rectangle extends from Candle 1 to the validating bar
Alerts
You can receive alerts when an FVG becomes an IFVG:
Configurable to fire only on selected timeframes (1m, 5m, 15m, 60m)
Alerts include the direction and the chart timeframe
Settings
Enable Alerts For Timeframe: Choose which timeframe(s) trigger alerts
This tool helps traders identify inverse FVGs (iFVG), a useful ICT concept.

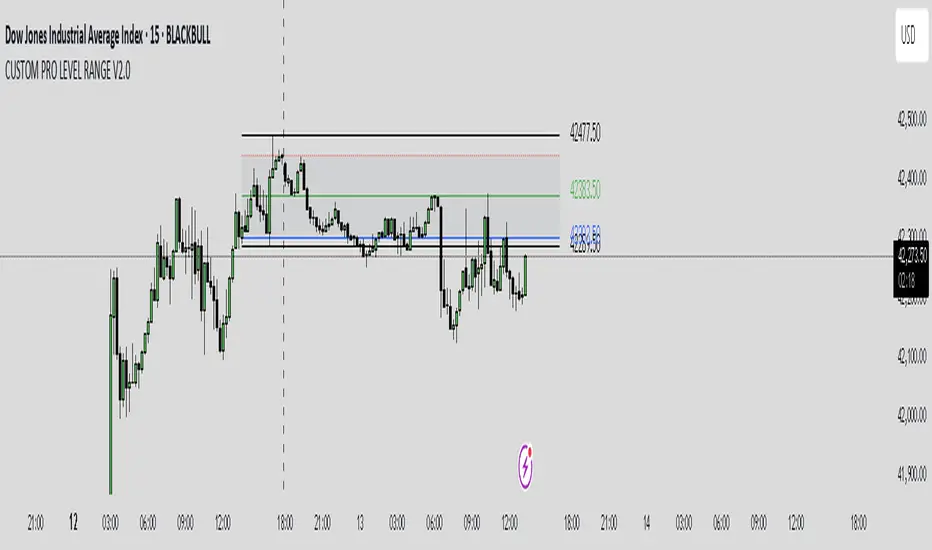
CUSTOM PRO RANGE V2.0 with AlertsCore Functions
Tracks High/Low Ranges
Daily (DR) or Initial (IDR) ranges within custom time windows (e.g., 9:30 AM–4:00 PM).
Optional extended hours (e.g., overnight).
Visual Tools
Draws boxes/lines for range boundaries, midpoints, and opening prices.
Custom colors/styles for clarity.
Smart Alerts
Notifies when price breaks high/low/mid of the range.
Avoids spam with once-per-bar alerts.
Flexible Timeframes
Works for intraday, daily, or even quarterly ranges with minor tweaks.
🎯 Who It Helps
Day Traders: Spot breakouts/reversals.
Swing Traders: Identify key support/resistance.
Analysts: Study price behavior in specific sessions.
Air Gap MTF with alert settingsWhat it shows:
This indicator will show a horizontal line at a price where each EMAs are on on different time frames, which will remove the effort of having to flick through different time frames or look at different chart.
The lines itself will move in real time as price moves and therefore as the EMA values changes so no need to manually adjustment the lines.
How to use it:
The price gap between each of the lines are known as "air gaps", which are essentially zones price can move with less resistance. Therefore bigger the airgap there is more likely more movement in price.
In other words, where lines are can be a resistance (or support) and can expect price stagnation or rejection.
On the chart it is clear to see lines are acting as resistances/supports.
Key settings:
The time frame are fixed to: 30min, 1hr and 4hr. This cannot be changed as of now.
EMA values for each time frame are user changeable in the settings, and up to 4 different values can be chosen for each time frame. Default is 5,12,34 and 50 for each timeframe.
Line colour, thickness and style can be user adjusted. Start point for where line will be drawn can be changed in the settings, either: start of day, user defined start or across the chart. In case of user defined scenario user can input a number that specifies a offset from current candle.
Label colour, font, alignment, text size and text itself can be user adjusted in the settings. Price can be also displayed if user chooses to do so. Position of label (offset from current candle) is user specified and can be adjusted by the user.
Both the lines and labels can be turned off (both and individually), for each lines.
Alert Settings:
Manually, user can set alerts for when price crosses a specific line.
This can be done by:
right click on any of line
choose first option (add alert on...)
On the second option under condition, use the dropdown menu to choose the desired EMA/timeframe to set alert for.
Hit "create" at bottom right of option
----------------------------------------------------------------------
If anything is not clear please let me know!

Volume Candle(alerts)This indicator highlights candles with unusually high trading volume by comparing the current volume to an EMA-based threshold. It helps identify significant volume spikes, which may indicate strong market movements.
Big Volume Detection
Compares the current volume to an EMA of past volume.
A candle is marked as "Big Volume" if the current volume exceeds the EMA by a specified multiple.
Color-Coded Candles
Big Volume & Bullish → Lime Green
Big Volume & Bearish → Red
Regular Bullish → Faded Lime (80% transparent)
Regular Bearish → Faded Red (80% transparent)
Alert System
Big Up or Down Volume → Triggers an alert when high volume occurs.
Big Up Volume → Triggers an alert for high-volume bullish candles.
Big Down Volume → Triggers an alert for high-volume bearish candles.
Customizable Settings
Period → EMA period for volume comparison (Default: 30)
Big Volume Multiple → Volume multiplier threshold for detection (Default: 3)
Use Cases
Spot unusual volume surges before major price moves
Confirm strong buying or selling pressure
Identify potential breakout zones

Hammer and Shooting Star Alerts - FrmRisk2RichesThis custom Pine Script indicator helps traders identify potential reversal signals in the market by detecting the formation of Hammer and Shooting Star candlestick patterns on multiple timeframes. The indicator automatically analyzes the 1-minute, 5-minute, 15-minute, and 30-minute charts, alerting you when a Hammer or Shooting Star candle forms on any of these timeframes.

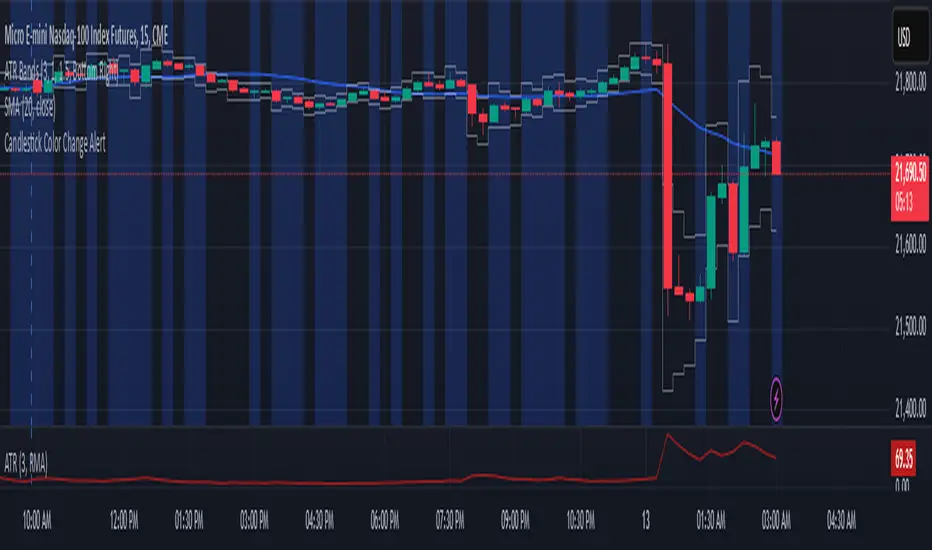
Candlestick Color Change AlertIt is an alert for change of candlestick color.
Identifies Candle Type
A candle is bullish if the closing price is higher than the opening price.
A candle is bearish if the closing price is lower than the opening price.
Detects a Color Change
The script checks if the current candle is bullish while the previous candle was bearish, or vice versa.
If a change is detected, an alert is triggered.
Triggers an Alert
Users receive an alert notification whenever a candlestick color change occurs.
Alerts can be set for popup, email, mobile push, or webhook notifications.
Visual Highlighting (Optional)
The script can also apply a background color (blue) on the chart to visually mark color changes.
Harmonic Patterns Library [TradingFinder]🔵 Introduction
Harmonic patterns blend geometric shapes with Fibonacci numbers, making these numbers fundamental to understanding the patterns.
One person who has done a lot of research on harmonic patterns is Scott Carney.Scott Carney's research on harmonic patterns in technical analysis focuses on precise price structures based on Fibonacci ratios to identify market reversals.
Key patterns include the Gartley, Bat, Butterfly, and Crab, each with specific alignment criteria. These patterns help traders anticipate potential market turning points and make informed trading decisions, enhancing the predictability of technical analysis.
🟣 Understanding 5-Point Harmonic Patterns
In the current library version, you can easily draw and customize most XABCD patterns. These patterns often form M or W shapes, or a combination of both. By calculating the Fibonacci ratios between key points, you can estimate potential price movements.
All five-point patterns share a similar structure, differing only in line lengths and Fibonacci ratios. Learning one pattern simplifies understanding others.
🟣 Exploring the Gartley Pattern
The Gartley pattern appears in both bullish (M shape) and bearish (W shape) forms. In the bullish Gartley, point X is below point D, and point A surpasses point C. Point D marks the start of a strong upward trend, making it an optimal point to place a buy order.
The bearish Gartley mirrors the bullish pattern with inverted Fibonacci ratios. In this scenario, point D indicates the start of a significant price drop. Traders can place sell orders at this point and buy at lower prices for profit in two-way markets.
🟣 Analyzing the Butterfly Pattern
The Butterfly pattern also manifests in bullish (M shape) and bearish (W shape) forms. It resembles the Gartley pattern but with point D lower than point X in the bullish version.
The Butterfly pattern involves deeper price corrections than the Gartley, leading to more significant price fluctuations. Point D in the bullish Butterfly indicates the beginning of a sharp price rise, making it an entry point for buy orders.
The bearish Butterfly has inverted Fibonacci ratios, with point D marking the start of a sharp price decline, ideal for sell orders followed by buying at lower prices in two-way markets.
🟣 Insights into the Bat Pattern
The Bat pattern, appearing in bullish (M shape) and bearish (W shape) forms, is one of the most precise harmonic patterns. It closely resembles the Butterfly and Gartley patterns, differing mainly in Fibonacci levels.
The bearish Bat pattern shares the Fibonacci ratios with the bullish Bat, with an inverted structure. Point D in the bearish Bat marks the start of a significant price drop, suitable for sell orders followed by buying at lower prices for profit.
🟣 The Crab Pattern Explained
The Crab pattern, found in both bullish (M shape) and bearish (W shape) forms, is highly favored by analysts. Discovered in 2000, the Crab pattern features a larger final wave correction compared to other harmonic patterns.
The bearish Crab shares Fibonacci ratios with the bullish version but in an inverted form. Point D in the bearish Crab signifies the start of a sharp price decline, making it an ideal point for sell orders followed by buying at lower prices for profitable trades.
🟣 Understanding the Shark Pattern
The Shark pattern appears in bullish (M shape) and bearish (W shape) forms. It differs from previous patterns as point C in the bullish Shark surpasses point A, with unique level measurements.
The bearish Shark pattern mirrors the Fibonacci ratios of the bullish Shark but is inverted. Point D in the bearish Shark indicates the start of a sharp price drop, ideal for placing sell orders and buying at lower prices to capitalize on the pattern.
🟣 The Cypher Pattern Overview
The Cypher pattern is another that appears in both bullish (M shape) and bearish (W shape) forms. It resembles the Shark pattern, with point C in the bullish Cypher extending beyond point A, and point D forming within the XA line.
The bearish Cypher shares the Fibonacci ratios with the bullish Cypher but in an inverted structure. Point D in the bearish Cypher marks the start of a significant price drop, perfect for sell orders followed by buying at lower prices.
🟣 Introducing the Nen-Star Pattern
The Nen-Star pattern appears in both bullish (M shape) and bearish (W shape) forms. In the bullish Nen-Star, point C extends beyond point A, and point D, the final point, forms outside the XA line, making CD the longest wave.
The bearish Nen-Star has inverted Fibonacci ratios, with point D indicating the start of a significant price drop. Traders can place sell orders at point D and buy at lower prices to profit from this pattern in two-way markets.
The 5-point harmonic patterns, commonly referred to as XABCD patterns, are specific geometric price structures identified in financial markets. These patterns are used by traders to predict potential price movements based on historical price data and Fibonacci retracement levels.
Here are the main 5-point harmonic patterns :
Gartley Pattern
Anti-Gartley Pattern
Bat Pattern
Anti-Bat Pattern
Alternate Bat Pattern
Butterfly Pattern
Anti-Butterfly Pattern
Crab Pattern
Anti-Crab Pattern
Deep Crab Pattern
Shark Pattern
Anti- Shark Pattern
Anti Alternate Shark Pattern
Cypher Pattern
Anti-Cypher Pattern
🔵 How to Use
To add "Order Block Refiner Library", you must first add the following code to your script.
import TFlab/Harmonic_Chart_Pattern_Library_TradingFinder/1 as HP
🟣 Parameters
XABCD(Name, Type, Show, Color, LineWidth, LabelSize, ShVF, FLPC, FLPCPeriod, Pivot, ABXAmin, ABXAmax, BCABmin, BCABmax, CDBCmin, CDBCmax, CDXAmin, CDXAmax) =>
Parameters:
Name (string)
Type (string)
Show (bool)
Color (color)
LineWidth (int)
LabelSize (string)
ShVF (bool)
FLPC (bool)
FLPCPeriod (int)
Pivot (int)
ABXAmin (float)
ABXAmax (float)
BCABmin (float)
BCABmax (float)
CDBCmin (float)
CDBCmax (float)
CDXAmin (float)
CDXAmax (float)
🟣 Genaral Parameters
Name : The name of the pattern.
Type: Enter "Bullish" to draw a Bullish pattern and "Bearish" to draw an Bearish pattern.
Show : Enter "true" to display the template and "false" to not display the template.
Color : Enter the desired color to draw the pattern in this parameter.
LineWidth : You can enter the number 1 or numbers higher than one to adjust the thickness of the drawing lines. This number must be an integer and increases with increasing thickness.
LabelSize : You can adjust the size of the labels by using the "size.auto", "size.tiny", "size.smal", "size.normal", "size.large" or "size.huge" entries.
🟣 Logical Parameters
ShVF : If this parameter is on "true" mode, only patterns will be displayed that they have exact format and no noise can be seen in them. If "false" is, the patterns displayed that maybe are noisy and do not exactly correspond to the original pattern.
FLPC : if Turned on, you can see this ability of patterns when their last pivot is formed. If this feature is off, it will see the patterns as soon as they are formed. The advantage of this option being clear is less formation of fielded patterns, and it is accompanied by the lateest pattern seeing and a sharp reduction in reward to risk.
FLPCPeriod : Using this parameter you can determine that the last pivot is based on Pivot period.
Pivot : You need to determine the period of the zigzag indicator. This factor is the most important parameter in pattern recognition.
ABXAmin : Minimum retracement of "AB" line compared to "XA" line.
ABXAmax : Maximum retracement of "AB" line compared to "XA" line.
BCABmin : Minimum retracement of "BC" line compared to "AB" line.
BCABmax : Maximum retracement of "BC" line compared to "AB" line.
CDBCmin : Minimum retracement of "CD" line compared to "BC" line.
CDBCmax : Maximum retracement of "CD" line compared to "BC" line.
CDXAmin : Minimum retracement of "CD" line compared to "XA" line.
CDXAmax : Maximum retracement of "CD" line compared to "XA" line.
🟣 Function Outputs
This library has two outputs. The first output is related to the alert of the formation of a new pattern. And the second output is related to the formation of the candlestick pattern and you can draw it using the "plotshape" tool.
Candle Confirmation Logic :
Example :
import TFlab/Harmonic_Chart_Pattern_Library_TradingFinder/1 as HP
PP = input.int(3, 'ZigZag Pivot Period')
ShowBull = input.bool(true, 'Show Bullish Pattern')
ShowBear = input.bool(true, 'Show Bearish Pattern')
ColorBull = input.color(#0609bb, 'Color Bullish Pattern')
ColorBear = input.color(#0609bb, 'Color Bearish Pattern')
LineWidth = input.int(1 , 'Width Line')
LabelSize = input.string(size.small , 'Label size' , options = )
ShVF = input.bool(false , 'Show Valid Format')
FLPC = input.bool(false , 'Show Formation Last Pivot Confirm')
FLPCPeriod =input.int(2, 'Period of Formation Last Pivot')
//Call function
= HP.XABCD('Bullish Bat', 'Bullish', ShowBull, ColorBull , LineWidth, LabelSize ,ShVF, FLPC, FLPCPeriod, PP, 0.382, 0.50, 0.382, 0.886, 1.618, 2.618, 0.85, 0.9)
= HP.XABCD('Bearish Bat', 'Bearish', ShowBear, ColorBear , LineWidth, LabelSize ,ShVF, FLPC, FLPCPeriod, PP, 0.382, 0.50, 0.382, 0.886, 1.618, 2.618, 0.85, 0.9)
//Alert
if BearAlert
alert('Bearish Harmonic')
if BullAlert
alert('Bulish Harmonic')
//CandleStick Confirm
plotshape(BearCandleConfirm, style = shape.arrowdown, color = color.red)
plotshape(BullCandleConfirm, style = shape.arrowup, color = color.green, location = location.belowbar )
