NINJA SCALPERNinja Scalper is the next evolution of the Trade Trend Indicator.
I have been trading for over 23 years now and these indicators are based on my trading style risk verse reward. The change in this is to make it more responsive and to integrate with Sword.
The background of this indicator is:
The original Trade Trend Indicator (indicator) has been the brain child of 23 years of trading experience rolled into a simple to understand all market setup alert system based solely on 5 high probability trade set ups with a 6th high risk. The hope is to provide something that is can assist traders in building confidence in their trades with a little assistance from the indicator.
This like any and all indicators is not a be all and end to trading, yes while back tested the indicator has produced fantastic profitable results; past performance is not a guarantee of future but which with human intervention can increase the return result exponentially.
You need to be able to chart simple candle sticks and you need to have an understanding of support and resistance areas to make sense of what you are doing in trading otherwise even this indicator won't help you.
While this may alert buy or sell / long or short entrance these are to be taken as educational points of reference and if you wish to trade you are understanding that you enter and exit at your own risk. Not many indicators will alert you to the possibility of a rogue wave spike / dump or both, this will but everything is perspective of the time frame you are on.
The indicator is designed for the 4hour time frame with trade entry on the 15min and managed on the 30min time frame. Alot can happen within these time frame but as we know not every trader can sit in front of a screen for hours at a time and this let's one trade for swings. Once you have your entry you place your exits and you set your stops. If you wait for the alert to exit you are in a draw down this should never reach that point pay yourself for being right.
The some set ups are simple:
1. Trend change from bearish to bullish buys are dip interim support entries.
2. Trend change from bullish to bearish sells are top interim resistance exits.
3. Blue buy is an entry position for a trade.
4. Blue long is an add position for a trade.
5. Red short is just that a short trade idea. (this is advanced and requires a manual cover target),
6. Green buy is a break out over the next candle to print above (highest risk)
All trades are based on a 5% to 10% of capital entry with no more than 40% ever in 1 trade goal is many consistent trade wins while limiting the losses and size.
Certain set ups such as longs over the Moving Averages but below the cloud can lead to strong rally returns as well as short in a bearish trend just above the Moving Averages can give prolonged selling pressure.
Pay attention to the golden dump line as it rises the closer to the candle it gets the higher the risk of the trade lacking continuation.
None of this is to be taken as investment advice but rather Edutainment and infotainment
#TradeSocially
在脚本中搜索"alert"
Trade Trend IndicatorThe Trade Trend Indicator (indicator) has been the brain child of 23 years of trading experience rolled into a simple to understand all market setup alert system based solely on 5 high probability trade set ups with a 6th high risk. The hope is to provide something that is can assist traders in building confidence in their trades with a little assistance from the indicator.
This like any and all indicators is not a be all and end to trading, yes while back tested the indicator has produced fantastic profitable results; past performance is not a guarantee of future but which with human intervention can increase the return result exponentially.
You need to be able to chart simple candle sticks and you need to have an understanding of support and resistance areas to make sense of what you are doing in trading otherwise even this indicator won't help you.
While this may alert buy or sell / long or short entrance these are to be taken as educational points of reference and if you wish to trade you are understanding that you enter and exit at your own risk. Not many indicators will alert you to the possibility of a rogue wave spike / dump or both, this will but everything is perspective of the time frame you are on.
The indicator is designed for the 4hour time frame with trade entry on the 15min and managed on the 30min time frame. Alot can happen within these time frame but as we know not every trader can sit in front of a screen for hours at a time and this let's one trade for swings. Once you have your entry you place your exits and you set your stops. If you wait for the alert to exit you are in a draw down this should never reach that point pay yourself for being right.
The set ups are simple:
1. Trend change from bearish to bullish buys are dip interim support entries.
2. Trend change from bullish to bearish sells are top interim resistance exits.
3. Blue buy is an entry position for a trade.
4. Blue long is an add position for a trade.
5. Red short is just that a short trade idea. (this is advanced and requires a manual cover target),
6. Green buy is a break out over the next candle to print above (highest risk)
All trades are based on a 5% to 10% of capital entry with no more than 40% ever in 1 trade goal is many consistent trade wins while limiting the losses and size.
Certain set ups such as longs over the Moving Averages but below the cloud can lead to strong rally returns as well as short in a bearish trend just above the Moving Averages can give prolonged selling pressure.
Pay attention to the golden dump line as it rises the closer to the candle it gets the higher the risk of the trade lacking continuation.
None of this is to be taken as investment advice but rather Edutainment and infotainment

That One Indicator (Free) - [Backtester]This Backtester comes with the following indicators:
Bollinger Bands
ADX
Moving Average Trend Confirmation Filter ( EMA , SMA , DEMA , TEMA , WMA , VWMA , SMMA , HullMA, LSMA , ALMA , SSMA, TMA, ZLEMA )
And a few more indicators in the back-end to increase accuracy
This strategy works really well as a scalper on lower Time Frames as well as on higher Time Frames. Besides that you can also trade it on pretty much any coin or asset.
The alerts script is not repainting. We advise to use alerts on “Once Per Bar Close”.
If you’d like to automate this strategy you can do that by using our alerts script with AutoView, ProfitView, ProfitTrailer, CryptoHopper etc.
Alerts are set very clearly as Long and Short to avoid confusion.
Feel free to leave a comment and share it with your friends.

NEILUJ SCALPERIndicateur de scalping pour définir une tendance et tenter d'obtenir de meilleures entrées.
Bien sur le backtest a voir en utilisation réelle....
Test en cours avec la version alerte et deux bots sur Bitmex ETH ET XBT.

Optimized BTC Mean Reversion (RSI 20/65)📈 Optimized BTC Mean Reversion (RSI 20/65)
Optimized BTC Mean Reversion (RSI 20/65) is a rule-based trading strategy designed to capture mean-reversion moves in strong market structures, primarily optimized for Bitcoin, but adaptable to other liquid cryptocurrencies.
The strategy combines RSI extremes, Stochastic momentum, and EMA trend filtering to identify high-probability reversal zones while maintaining strict risk management.
🔍 Strategy Logic
This system focuses on entering trades when price temporarily deviates from equilibrium, while still respecting the broader trend.
✅ Long Conditions
RSI below 20 (oversold)
Stochastic below 25
Price trading above the 200 EMA (or within a controlled deviation)
Designed to buy sharp pullbacks in bullish conditions
❌ Short Conditions
RSI above 65 (overbought)
Stochastic above 75
Price trading below the 200 EMA
Designed to sell relief rallies in bearish conditions
🛡 Risk Management
Fixed Stop Loss: 4%
Fixed Take Profit: 6%
Risk/Reward: 1 : 1.5
No pyramiding (single position at a time)
Full equity position sizing (adjustable)
All exits are predefined at entry, ensuring consistency and emotional discipline.
📊 Indicators Used
200 EMA – Trend direction filter
RSI (14) – Mean-reversion trigger (20 / 65 levels)
Stochastic Oscillator – Momentum confirmation
👁 Visual Features
EMA plotted directly on chart
Real-time Stop Loss, Take Profit, and Entry Price lines
Clear long/short entry markers
Works on all timeframes (optimized for intraday and swing trading)
🔔 Alerts
Long entry alerts
Short entry alerts
(Perfect for automation or discretionary execution)
⚠️ Disclaimer
This strategy is intended for educational and research purposes only. Past performance does not guarantee future results. Always test on a demo account and adjust risk parameters to your own trading plan.

BTR Auto Buy/Sell Trend System
BTR Auto Buy/Sell Trend System — Your New Profit Machine!
Discover the only TradingView system you need to spot powerful trend reversals with precision, confidence, and automation.
Designed for Stocks, Crypto & Commodities, this strategy consistently delivers 60%–80% accuracy in trending markets.
This is not just a script…
👉 It’s your complete plug-and-play trading system.
💡 Why Traders Love This System
✔ Early Trend Identification
Catch major reversals before the crowd.
✔ Non-Repainting Confirmed Signals
All entries are triggered only on candle close, so what you see is what you trade.
✔ Smart ATR + Momentum Engine
Filters bad trades automatically, giving you only high-quality signals.
✔ Works on All Timeframes
From 5-minute scalping to daily swing trading.
✔ Full Auto-Trading Ready
Pre-built JSON alerts for API Algo Trading.
No coding. No setup headache. Just copy → paste → trade.
⚡ How You Make Money With This Strategy
Step 1: Wait for Trend Flip
🔵 BUY when the system flips from bearish → bullish
🔴 SELL when it flips from bullish → bearish
Step 2: Enter on Confirmed Signal
Trade only on the bar after signal closes.
Step 3: Ride the Trend
Let the strategy take the move.
It avoids sideways markets and shines in strong trends.
Step 4: Auto Alerts (Optional)
Turn on Dhan alerts and let the system execute trades automatically.
📈 What You Can Expect (Typical Performance)
✔ 60–80% success rate in trending markets
✔ Works in Stocks, Crypto, Commodities
✔ High accuracy in 15m, 30m, 1H, 4H charts
✔ Avoids most fake breakouts & sideways noise
This system is built for consistency, simplicity, and scalable automation.
⭐ Perfect For:
Beginner traders
Algo traders
Swing traders
Scalpers
Systematic
API users
Anyone who wants clean, high-probability trend signals
⚠ Disclaimer
Trading involves risk. Past results do not guarantee future returns.
Use proper risk management for best results.

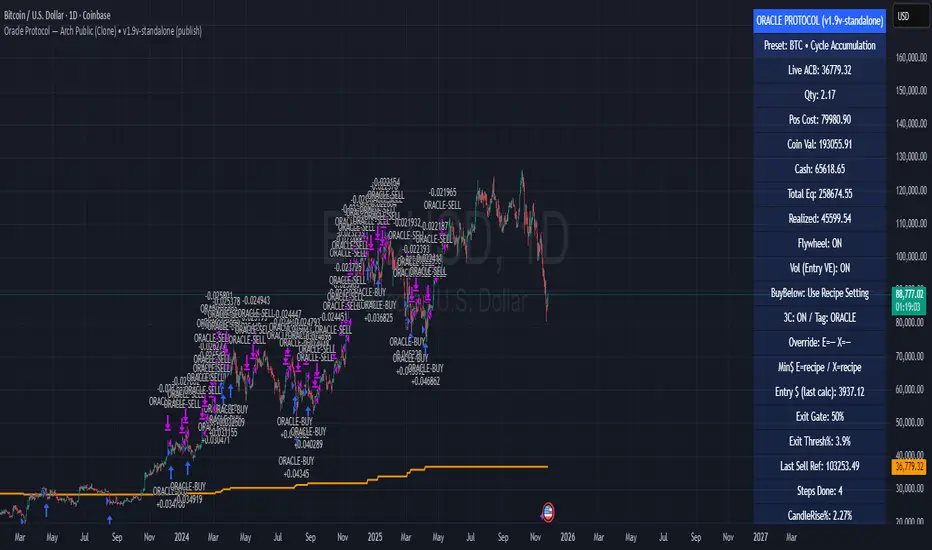
Oracle Protocol — Arch Public (Testing Clone) Oracle Protocol — Arch Public Series (testing clone)
This model implements the Arch Public Oracle structure: a systematic accumulation-and-distribution engine built around a dynamic Accumulation Cost Base (ACB), strict profit-gate exit logic, and a capital-bounded flywheel reinvestment system.
It is designed for transparent execution, deterministic behaviour, and rule-based position management.
Core Function Set
1. Accumulation Framework (ACB-Driven)
The accumulation engine evaluates market movement against defined entry conditions, including:
Percentage-based entry-drop triggers
Optional buy-below-ACB mode
Capital-gated entries tied to available ledger balance
Fixed-dollar and min-dollar entry rules (as seen in Arch public materials)
Automated sizing through flywheel capital
Range-bounded ledger for controlled backtesting input
Each qualifying buy updates the live ACB, maintains the internal ledger, and forms the next reference point for exit evaluation.
No forecasting mechanisms are included.
2. Profit-Gate Exit System
Exits are governed by the standard Arch public approach:
A sealed ACB reference for threshold evaluation
Optional live-ACB visibility
Profit-gate triggers defined per asset class
Candle-confirmation integration (“ProfitGate + Candle” mode)
Distribution only when the smallest active threshold is met
This provides a consistent cadence with published Arch diagrams and PDFs.
3. Once-Per-Rally Governance
After a distribution, the algorithm locks until price retraces below the most recent accumulation base.
Only after re-arming can the next profit gate activate.
This prevents over-frequency selling and aligns with the public-domain Oracle behaviour.
4. Quiet-Bars & Threshold Cluster Control
A volatility-stabilisation layer prevents multiple exits from micro-fluctuations or transient spikes.
This ensures clean execution during fast markets and high volatility.
5. Flywheel Reinvestment
Distribution proceeds automatically return to the capital pool where permitted, creating a closed system of:
Entry sizing
Exit proceeds
Ledger-managed capital state
All sizing respects capital boundaries and does not breach dollar floors or overrides.
6. Automation Hooks and Integration
The script exposes:
3Commas-compatible JSON sizing
Entry/exit signalling via alertcondition()
Deterministic event reporting suitable for external automation
This allows consistent deployment across automated execution environments.
7. Visual Tooling
Optional displays include:
Live ACB line
Exit-guide markers
Capital, state, and ledger panels
Realized/unrealized outcome tracking based on internal logic only
Visual components do not influence execution rules.
Operating Notes
This model is rule-based, deterministic, and non-predictive.
It executes only according to the explicit thresholds, capital limits, and state transitions defined within the script.
No discretionary or forward-looking logic is included.
Trend Pullback System```{"variant":"standard","id":"36492","title":"Trend Pullback System Description"}
Trend Pullback System is a price-action trend continuation model that looks to enter on pullbacks, not breakouts. It’s designed to find high-quality long/short entries inside an already established trend, place the stop at meaningful structure, trail that stop as structure evolves, and warn you when the trade thesis is no longer valid.
Developed by: Mohammed Bedaiwi
---------------------------------
HOW IT WORKS
---------------------------------
1. Trend Detection
• The strategy defines overall bias using moving averages.
• Bullish environment (“uptrend”): price above the slower MA, fast MA above slow MA, and the slow MA is sloping up.
• Bearish environment (“downtrend”): price below the slower MA, fast MA below slow MA, and the slow MA is sloping down.
This prevents trading against chop and focuses on continuation moves in the dominant direction.
2. Pullback + Re-entry Logic
• The script waits for price to pull back into structure (support in an uptrend, resistance in a downtrend), and then push back in the direction of the main trend.
• That “push back” is the setup trigger. We don’t chase the first breakout candle — we buy/sell the retest + resume.
3. Structural Levels (“Diamonds”)
• Green diamond (below bar): bullish pivot low formed while the trend is bullish. This marks defended support.
- Use it as a re-entry zone for longs.
- Use it to trail a stop higher when you’re already long.
- Shorts can take profit here because buyers stepped in.
• Red diamond (above bar): bearish pivot high formed while the trend is bearish. This marks defended resistance.
- Use it as a re-entry zone for shorts.
- Use it to trail a stop lower when you’re already short.
- Longs can take profit here because sellers stepped in.
4. Entry Signals
• BUY arrow (green triangle up under the candle, text like “BUY” / “BUY Zone”):
- LongSetup is true.
- Trend is bullish or turning bullish.
- Price just bounced off recent defended support (green diamond) and reclaimed short-term momentum.
Meaning: enter long here or cover/exit shorts.
• SELL arrow (red triangle down above the candle):
- ShortSetup is true.
- Trend is bearish or turning bearish.
- Price just rolled down from defended resistance (red diamond) and lost short-term momentum.
Meaning: enter short here or take profit on longs.
These are the primary trade entries. They are meant to be actionable.
5. Weak Setups (“W” in yellow)
• Yellow triangle with “W”:
- A possible long/short idea is trying to form, BUT the higher-timeframe confirmation is not fully there yet.
- Think of it as early pressure / early caution, not a full signal.
• You usually watch these areas rather than jumping in immediately.
6. Exit Warning (orange “EXIT” label above a bar)
• The strategy will raise an EXIT marker when you’re in a trade and the *opposite* side just produced a confirmed setup.
- You’re short and a valid longSetup appears → EXIT.
- You’re long and a valid shortSetup appears → EXIT.
• This is basically: “Close or reduce — the other side just took control.”
• It’s not just a trailing stop hit; it’s a regime flip warning.
7. Stop, Target, and Trailing
• On every new setup, the script records:
- Initial stop: recent swing beyond the defended level (below support for longs, above resistance for shorts).
- Initial target: recent opposing swing.
• While you’re in position, if new confirming diamonds print in your favor, the stop can trail toward the new defended level.
• This creates structure-based risk management (not just fixed % or ATR).
8. Reference Levels
• The strategy also plots prior higher-timeframe closes (last week’s close, last month’s close, last year’s close). These can behave as magnets or stall points.
• They’re helpful for take-profit timing and for reading “are we trading above or below last month’s close?”
9. Momentum Panel (hidden by default)
• Internally, the script calculates an SMI-style momentum oscillator with overbought/oversold zones.
• This is optional visual confirmation and does not drive the core entry/exit logic.
---------------------------------
WHAT A TRADE LOOKS LIKE IN REAL PRICE ACTION
---------------------------------
Early warning
• Yellow W + red diamonds + red down arrows = “This is getting weak. Short setups are here.”
• You may also see something like “My Short Entry Id.” That’s where the short side actually engages.
Bearish follow-through, then exhaustion
• Price bleeds down.
• Then the orange EXIT appears.
→ Translation: “If you’re still short, close it. Buyers are stepping in hard. Risk of reversal is now high.”
Regime flip
• Right after EXIT, multiple green BUY arrows fire together (“BUY”, “BUYZone”).
• That’s the true long trigger.
→ This is where you either enter long or flip from short to long.
Expansion leg
• After that flip, price rips up for multiple candles / days / weeks.
• While it runs:
- Green diamonds appear under pullbacks → “dip buy zones / trail stop up here.”
- More BUY arrows show on minor pullbacks → continuation long / scale adds.
Distribution / topping
• Later, you start seeing new yellow W triangles again near local highs. That’s your “careful, this might be topping” warning.
• You finally get a hard red candle, and green diamonds stop stacking.
→ That’s where you tighten risk, scale out, or assume the move is mature.
In plain terms, the model is doing the following for you:
• It puts you short during weakness.
• It tells you when to get OUT of the short.
• It flips you long right as control changes.
• It gives you a structure-based trail the whole way up.
• It warns you again when momentum at the top starts cracking.
That is exactly how the logic was designed.
---------------------------------
QUICK INTERPRETATION CHEAT SHEET
---------------------------------
🔻 Red triangle + “Short Entry” near a red diamond
→ Short entry zone (or take profit on a long).
🟥 Red diamond above bar
→ Sellers defended here. Treat it as resistance. Good place to trail short stops just above that level. Avoid chasing longs straight into it.
🟨 Yellow W
→ Attention only. Early pressure / possible turn. Not fully confirmed.
🟧 EXIT (orange label)
→ The opposite side just printed a real setup. Close the old idea (cover shorts if you’re short, exit longs if you’re long). Thesis invalid.
🟩 Burst of green BUY triangles after EXIT
→ Long entry. Also a “cover shorts now” alert. This is the core money entry in bullish reversals.
💎 Green diamond below bar
→ Bulls defended that level. Good for trailing your long stop up, and good “buy the dip in trend” locations.
📈 Blue / teal MAs stacked and rising
→ Confirmed bullish structure. You’re in trend continuation mode, so dips are opportunities, not automatic exits.
---------------------------------
COLOR / SHAPE KEY
---------------------------------
• Green triangle up (“BUY”, “BUY Zone”):
Long entry / cover shorts / continuation long trigger.
• Red triangle down:
Short entry / take profit on longs / continuation short trigger.
• Orange “EXIT” label:
Opposite side just fired a real setup. The previous trade thesis is now invalid.
• Green diamond below price:
Bullish defended support in an uptrend. Use for dip buys, trailing stops on longs, and objective cover zones for shorts.
• Red diamond above price:
Bearish defended resistance in a downtrend. Use for re-entry shorts, trailing stops on shorts, and objective scale-out zones for longs.
• Yellow “W”:
Weak / early potential setup. Watch it, don’t blindly trust it.
• Moving average bands (fast MA, slow MA, Hull MA):
When stacked and rising, bullish control. When stacked and falling, bearish control.
---------------------------------
INTENT
---------------------------------
This system is built to:
• Trade with momentum, not against it.
• Enter on pullbacks into proven structure, not chase stretched breakouts.
• Automate stop/target logic around actual defended swing levels.
• Warn you when the other side takes over so you don’t give back gains.
Typical usage:
1. In an uptrend, wait for price to pull back, print a green diamond (support proved), then take the first BUY arrow that fires.
2. In a downtrend, wait for a bounce into resistance, print a red diamond (sellers proved), then take the first SELL arrow that fires.
3. Respect EXIT when it appears — that’s the model saying “this trade is done.”
---------------------------------
DISCLAIMER
---------------------------------
This script is for educational and research purposes only. It is not financial advice, investment advice, or a recommendation to buy or sell any security, cryptoasset, or derivative. Markets carry risk. Past performance does not guarantee future results. You are fully responsible for your own decisions, position sizing, risk management, and compliance with all applicable laws and regulations.

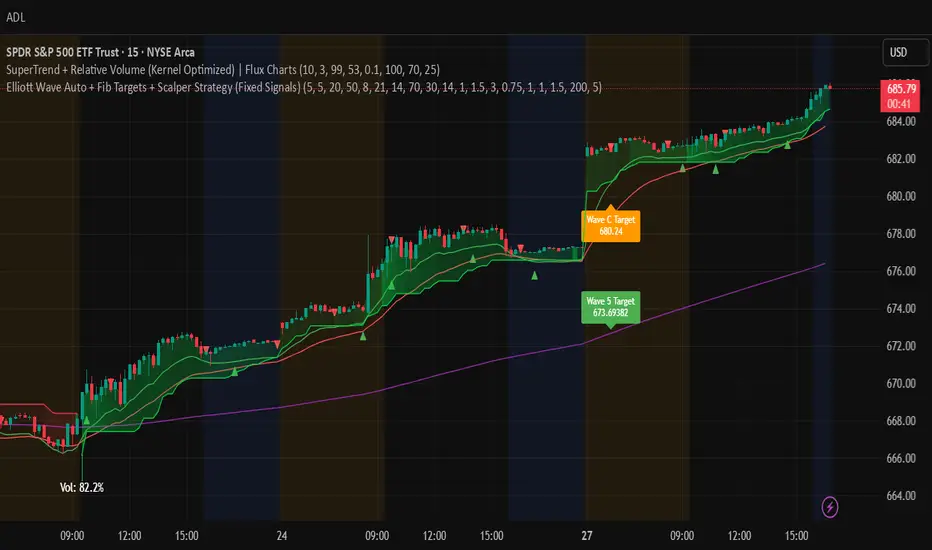
Elliott Wave Auto + Fib Targets + Scalper Strategy (Fixed)// Elliott Wave Auto + Fib Targets + Scalper Strategy
//
// Fixed by expert trader:
// - Replaced table with label-based visualization to avoid 'Column 2 is out of table bounds' error.
// - Uses label.new to display buy/sell signal counts in top-right corner, mimicking table layout.
// - Fixed array.sum() error: Replaced invalid range-based array.sum() with custom sum_array_range() function.
// - Removed barstate usage to fix 'Undeclared identifier barstate' error.
// - Replaced barstate.isconfirmed with true (process every bar).
// - Replaced barstate.isfirstconfirmed with bar_index == 0 (first bar).
// - Replaced strategy.alert with label.new for long/short entry signals (buy/sell markers).
// - Fixed array index out-of-bounds: Protected array.get() calls with size checks.
// - Fixed pyramiding: Set constant pyramiding=4 (max 5 entries); use allow_pyramiding to limit entries.
// - Fixed default_qty_value: Set constant default_qty_value=100.0; use entry_size_pct to scale qty.
// - Replaced alertcondition with labels for Elliott Wave patterns.
// - Fixed partial exits: 50% at TP1 with fixed SL, 50% at TP2 with fixed SL or trailing.
// - Fixed Elliott Wave pivot indexing for alternating H/L check.
// - Ensured proper position sizing and exit logic.
Imbalance No SL📊 Strategy Name: Imbalance No SL
This strategy specially trades on price jumps (true imbalances) in the market, takes advantage of momentum only, and as soon as the opposite signal and profit is received, the trade is closed immediately.
Imbalance No SL strategy specially generates buy and sell signals based on "Imbalance" logic, without any fixed Stop Loss.
🔍 Core Logic
Imbalance Detection
Bullish Imbalance : When the low of the current candle is above the high of the previous candle.
(i.e. a jump type gap occurred in the market – demand is high, price went straight up)
Bearish Imbalance : When the high of the current candle is below the low of the previous candle.
(i.e. the market suddenly fell down)
Creating Visual Box and Label on Signal:
As soon as bullish imbalance is found, green box & IMB BULL label is displayed on the chart.
Bearish has red box & IMB BEAR label.
Trade Entry Logic
BUY on Bullish Imbalance: If there is already a buy or neutral position, then a new “BUY” signal will fire.
SELL on Bearish Imbalance: If already in sell or neutral position, then new “SELL” signal will fire.
You can set quantity/lot size from ‘qty’ input field.
Trade Average Calculation
Buy/Sell maintains average price and their count (so that if averaging is done then correct P&L is calculated).
Trade Exit Logic (Profit Booking/Signal Reverse)
If your buy is going on and bearish imbalance is formed + price is above your average, then buy will be closed (profit condition).
If sell is going on and bullish imbalance is formed + price is below average, then sell will be closed.
Chart Cleaning/Management
Only keep the label and box of the latest signal on the chart, old boxes/labels are automatically deleted.
Alert
You can get alert on bullish or bearish signal (by using alert feature of TradingView).
✅ Simple Explanation for User
This strategy buys or sells directly at the gap (imbalance).
Whenever there is a clear signal of momentum in the market (breakout of the gap), then the trade entry takes place.
When there is an imbalance in the opposite direction and profit is made, the system closes the trade (closes).
There is no fixed stop-loss, risk management is handled by trade averaging/close.
You will know at every point on the visually chart that at which bar the buy, sell and exit took place.
⚠️ What to remember?
If the market is in trend then this script gives very good signals.
In choppy/sideways market, some loss trades can also come because there is no SL.
Big profit or big loss – both depend on the imbalance signal and market speed.

Ultimate Bot v5 (Full Visual + Reversal + Sustained Signals)Ultimate Bot v5 is a powerful, all-in-one Pine Script strategy designed for traders who want both clarity and precision in their charts. It combines classic momentum indicators, volatility filters, and reversal logic to highlight high-probability trade opportunities.
🔹 Key Features
Full Visual Mode – Clean and easy-to-read buy/sell markers with large arrows and labels.
EMA Trend Detection – Fast & slow EMA crossovers for trend direction.
RSI + MACD Confirmation – Confirms entries with momentum & strength checks.
Reversal Alerts – Detects sharp drops or spikes for rebound/reversal plays.
Sustained Signal Mode – Highlights stronger continuation trends, not just short-term flips.
ADX Strength Filter (optional) – Filters out weak/noisy signals during sideways markets.
ATR Dynamic Positioning – Arrows adapt to volatility so they’re always visible.
Custom Alerts – Works with TradingView alerts for buy, sell, and reversal signals.
🔹 Why Use It?
This bot is designed to help traders:
✅ Spot early reversals and potential bounce opportunities
✅ Confirm strong momentum moves with multi-indicator checks
✅ Avoid false signals in choppy markets
✅ Trade with confidence using visual clarity

Estrategia VWAP + RSI + SuperTrend (15m) con AlertasEstrategia para trading de Futuros en temporalidad de 15 minutos

Options Strategy V2.0📈 Options Strategy V2.0 – Intraday Reversal-Resilient Momentum System
Overview:
This strategy is designed specifically for intraday SPY, TSLA, MSFT, etc. options trading (0DTE or 1DTE), using high-probability signals derived from a confluence of technical indicators: EMA crossovers, RSI thresholds, ATR-based risk control, and volume spikes. The strategy aims to capture strong directional moves while avoiding overtrading, thanks to a built-in cooldown logic and optional time/session filters.
⚙️ Core Concept
The strategy executes trades only in the direction of the prevailing trend, determined by short- and long-term Exponential Moving Averages (EMA). Entry signals are generated when the Relative Strength Index (RSI) confirms momentum in the direction of the trend, and volume spikes suggest institutional activity.
To increase adaptability and user control, it includes a highly customizable parameter set for both long and short entries independently.
📌 Key Features
✅ Trend-Following Logic
Long entries are only allowed when EMA(short) > EMA(long)
Short entries are only allowed when EMA(short) < EMA(long)
✅ RSI Confirmation
Long: Requires RSI crossover above a configurable threshold
Short: Requires RSI crossunder below a configurable threshold
Optional rejection filters: Entry blocked above/below specific RSI extremes
✅ Volume Spike Filter
Confirms institutional participation by comparing current volume to an average multiplied by a user-defined factor.
✅ ATR-Based Risk Management
Both Stop Loss (SL) and Take Profit (TP) are dynamically calculated using ATR × a multiplier.
TP/SL ratio is fully configurable.
✅ Cooldown Control
After every trade, the system waits for a set number of bars before allowing new entries.
This prevents overtrading and increases signal quality.
Optionally, cooldown is ignored for reversal trades, ensuring the system can react immediately to a confirmed trend change.
✅ Candle Body Filter (Noise Control)
Avoids trades on candles with too small bodies relative to wicks (often noise or indecision candles).
✅ VWAP Confirmation (Optional)
Ensures price is trading above VWAP for long entries, or below for short entries.
✅ Time & Session Filters
Trades only during regular market hours (09:30–16:00 EST).
No-trade zone (e.g., 14:15–15:45 EST) to avoid low-liquidity traps or late-day whipsaws.
✅ End-of-Day Auto Close
All open positions are force-closed at 15:55 EST, protecting against overnight risk (especially relevant for 0DTE options).
📊 Visual Aids
EMA plots show trend direction
VWAP line provides real-time mean-reversion context
Stop Loss and Take Profit lines appear dynamically with each trade
Alerts notify of entry signals and exit triggers
🔧 Customization Panel
Nearly every element of the strategy can be tailored:
EMA lengths (short and long, for both sides)
RSI thresholds and length
ATR length, SL multiplier, and TP/SL ratio
Volume spike sensitivity
Minimum EMA distance filter
Candle body ratio filter
Session restrictions
Cooldown logic (duration + reversal exception)
This makes the strategy extremely versatile, allowing both conservative and aggressive configurations depending on the trader’s profile and the market context.
📌 Example Use Case: SPY Options (0DTE or 1DTE)
This system was designed and tested specifically for SPY and other intraday options trading, where:
Delta is around 0.50 or higher
Trades are short-lived (often 1–5 candles)
You aim to trade 1–3 signals per day, filtering out weak entries
🚫 Important Notes
It is not a scalping strategy; it relies on confirmed breakouts with trend support
No pyramiding or re-entries without cooldown to preserve risk integrity
Should be used with real-time alerts and manual broker execution
📈 Alerts Included
📈 Long Entry Signal
📉 Short Entry Signal
⚠️ Auto-closed all positions at 15:55 EST
✅ Proven Settings – Real Trades + Backtest Results
The current version of the strategy includes the optimal settings I’ve arrived at through extensive backtesting, as well as 3 months of real trading with consistent profitability. These results reflect real-world execution under live market conditions using 0DTE SPY options, with disciplined trade management and risk control.
🧠 Final Thoughts
Options Strategy V2.0 is a robust, highly tunable intraday strategy that blends momentum, trend-following, and volume confirmation. It is ideal for disciplined traders focused on SPY or other 0DTE/1DTE options, and it includes guardrails to reduce false signals and improve execution timing.
Perfect for those who seek precision, flexibility, and risk-defined setups—not blind automation.

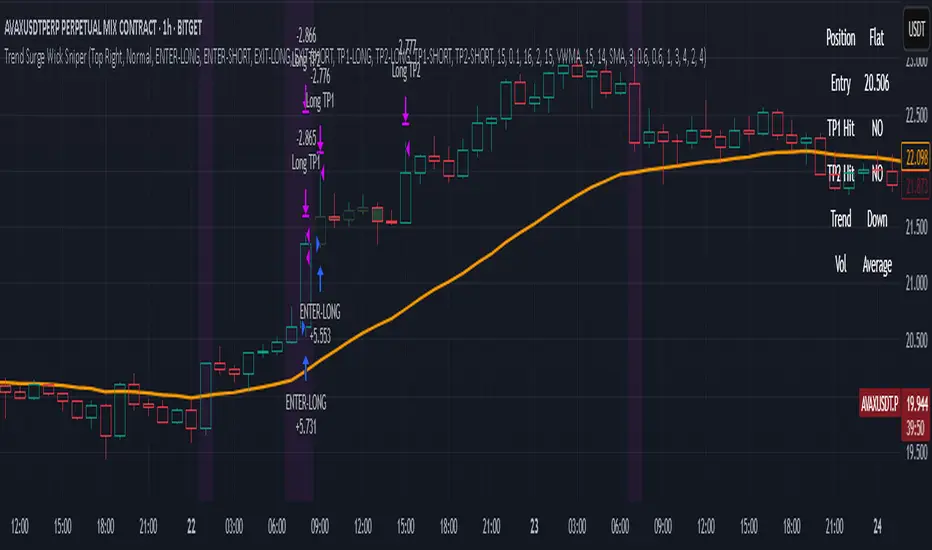
Trend Surge Wick SniperTrend Surge Wick Sniper | Non-Repainting Trend + Momentum Strategy with TP1/TP2 & Dashboard
Trend Surge Wick Sniper is a complete crypto trading strategy designed for high-precision entries, smart exits, and non-repainting execution. It combines trend slope, wick rejection, volume confirmation, and CCI momentum filters into a seamless system that works in real-time conditions — whether you're manual trading or sending alerts to multi-exchange bots.
🧩 System Architecture Overview
This is not just a mashup of indicators — each layer is tightly integrated to filter for confirmed, high-quality setups. Here’s a detailed breakdown:
📈 Trend Logic
1. McGinley Dynamic Baseline
A responsive moving average that adapts to market speed better than EMA or SMA.
Smooths price while staying close to real action, making it ideal for basing alignment or trend context.
2. Gradient Slope Filter (ATR-normalized)
Calculates the difference between current and past McGinley values, divided by ATR for normalization.
If the slope exceeds a configurable threshold, it confirms an active uptrend or downtrend.
Optional loosened sensitivity allows for more frequent but still valid trades.
🚀 Momentum Timing
3. Smoothed CCI (ZLEMA / Hull / VWMA options)
Traditional CCI is enhanced with smoothing for stability.
Signals trades only when momentum is strong and accelerating.
Optional settings let users tune how responsive or smooth they want the CCI behavior to be.
🔒 Entry Filtering & Rejection Logic
4. Wick Trap Detection
Prevents entry during manipulated candles (e.g. stop hunts, wick traps).
Measures wick-to-body ratio against a minimum body size normalized by ATR.
Only trades when the candle shows a clean body and no manipulation.
5. Price Action Filters (Optional)
Long trades require price to break above previous high (or skip this with a toggle).
Short trades require price to break below previous low (or skip this with a toggle).
Ensures you're trading only when price structure confirms the breakout.
6. McGinley Alignment (Optional)
Price must be on the correct side of the McGinley line (above for longs, below for shorts).
Ensures that trades align with baseline trend, preventing early or fading entries.
📊 Volume Logic
7. Volume Spike Detection
Confirms that a real move is underway by requiring volume to exceed a moving average by a user-defined multiplier.
Uses SMA / EMA / VWMA for customizable behavior.
Optional relative volume mode compares volume against typical volume at that same time of day.
8. Volume Trend Filter
Compares fast vs. slow EMA of the volume spike ratio.
Ensures volume is not just spiking, but also increasing overall.
Prevents trades during volume exhaustion or fading participation.
9. Volume Strength Label
Classifies each bar’s volume as: Low, Average, High, or Very High
Shown in the dashboard for context before entries.
🎯 Entry Conditions
An entry occurs when all of the following align:
✅ Trend confirmed via gradient slope
✅ Momentum confirmed via smoothed CCI
✅ No wick trap pattern
✅ Price structure & McGinley alignment (if toggled on)
✅ Volume confirms participation
✅ 1-bar cooldown since last exit
💰 TP1 & TP2 Exit System
TP1 = 50% of position closed using a limit order at a % profit (e.g., 2%)
TP2 = remaining 50% closed at a second profit level (e.g., 4%)
These are set as limit orders at the time of entry and work even on backtest.
Alerts are sent separately for TP1 and TP2 to allow bot handling of staggered exits.
🧠 Trade Logic Controls
✅ process_orders_on_close=true ensures non-repainting behavior
✅ 1-bar cooldown after any exit prevents same-bar reversals
✅ Built-in canEnter condition ensures trades are separated and clean
✅ Alerts use customizable strings for entry/exit/TP1/TP2 — ready for webhook automation
📊 Real-Time On-Chart Dashboard
Toggleable, movable dashboard shows live trading stats:
🔵 Current Position: Long / Short / Flat
🎯 Entry Price
✅ TP1 / TP2 Hit Status
📈 Trend Direction: Up / Down / Flat
🔊 Volume Strength: Low / Average / High / Very High
🎛 Size and corner are adjustable via input settings
⚠️ Designed For:
1H / 4H Crypto Trading
Manual Traders & Webhook-Connected Bots
Scalability across volatile market conditions
Full TradingView backtest compatibility (no repainting / no fake signals)
📌 Notes
You can switch CCI smoothing type, volume MA type, and other filters via the settings panel.
Default TP1/TP2 levels are set to 2% and 4%, but fully customizable.
🛡 Disclaimer
This script is for educational purposes only and not financial advice. Use with backtesting and risk management before live deployment.
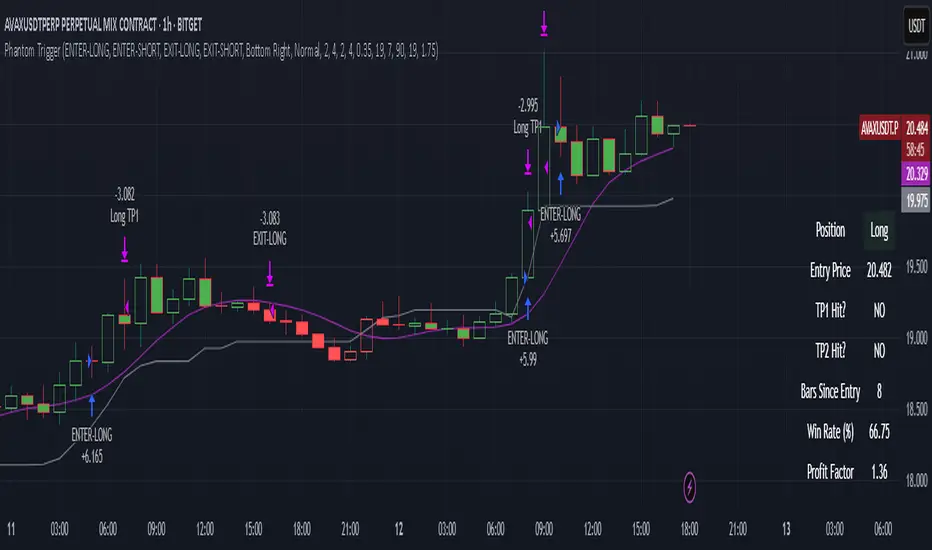
Phantom Trigger Phantom Trigger – Precision Trend Execution with TP1/TP2 and Weak Trend Exits
Phantom Trigger is a professional-grade trend-following strategy designed for crypto and high-volatility assets. It combines advanced trend detection with precise risk-managed exits using a multi-level take-profit system.
🔍 What It Does
Identifies strong directional moves using a multi-stage smoothed trend model
Confirms entries using structure-based logic and volume pressure
Filters trades using bias zones, confirmation levels, and trend acceleration
Automatically manages trades with two-stage take-profits (TP1 and TP2)
Exits early on trend weakness before reversal
Includes a styled real-time dashboard and bar coloring for visual guidance
Sends bot-compatible alerts for multi-exchange automation
⚙️ Core Components
Trend Engine: A smoothed dynamic filter detects real-time trend direction and momentum shifts
Bias Structure: Mid-high/low range-based logic determines if price is favoring bullish or bearish structure
Confirmation Levels: Short- and long-term zone crossovers confirm directional alignment
Volume Filter: Detects volume expansion spikes to validate strong breakout potential
TP1/TP2 Logic: Dynamically sets two profit targets and executes partial and full exits automatically
Weak Trend Exit: Closes positions one bar before reversal using directional filters
🧠 How to Use
Works best on crypto (1H, 4H) and high-volume instruments
Use dashboard stats to monitor position status, PnL, and TP1/TP2 progression
Alerts are pre-labeled and compatible with bots like 3Commas, Wunderbit, etc.
Can be adapted for both scalping and swing trading
📊 Dashboard
The built-in real-time dashboard displays current trade status, entry price, TP1/TP2 progress, win rate, profit factor, and bars since entry. It updates live with every candle and provides a quick-glance overview to support your decision-making during active trades.
🧠 How to Use
Works best on crypto (1H, 4H) and high-volume instruments
Use dashboard stats to monitor position status, PnL, and TP1/TP2 progression
Alerts are pre-labeled and compatible with bots like 3Commas, Wunderbit, etc.
Can be adapted for both scalping and swing trading
⚠️ Disclaimer
This script is for educational purposes only and does not constitute financial advice. Always test strategies thoroughly using demo or backtesting environments before applying to live markets. Past performance is not indicative of future results.
Enhanced Range Filter Strategy with ATR TP/SLBuilt by Omotola
## **Enhanced Range Filter Strategy: A Comprehensive Overview**
### **1. Introduction**
The **Enhanced Range Filter Strategy** is a powerful technical trading system designed to identify high-probability trading opportunities while filtering out market noise. It utilizes **range-based trend filtering**, **momentum confirmation**, and **volatility-based risk management** to generate precise entry and exit signals. This strategy is particularly useful for traders who aim to capitalize on trend-following setups while avoiding choppy, ranging market conditions.
---
### **2. Key Components of the Strategy**
#### **A. Range Filter (Trend Determination)**
- The **Range Filter** smooths price fluctuations and helps identify clear trends.
- It calculates an **adjusted price range** based on a **sampling period** and a **multiplier**, ensuring a dynamic trend-following approach.
- **Uptrends:** When the current price is above the range filter and the trend is strengthening.
- **Downtrends:** When the price falls below the range filter and momentum confirms the move.
#### **B. RSI (Relative Strength Index) as Momentum Confirmation**
- RSI is used to **filter out weak trades** and prevent entries during overbought/oversold conditions.
- **Buy Signals:** RSI is above a certain threshold (e.g., 50) in an uptrend.
- **Sell Signals:** RSI is below a certain threshold (e.g., 50) in a downtrend.
#### **C. ADX (Average Directional Index) for Trend Strength Confirmation**
- ADX ensures that trades are only taken when the trend has **sufficient strength**.
- Avoids trading in low-volatility, ranging markets.
- **Threshold (e.g., 25):** Only trade when ADX is above this value, indicating a strong trend.
#### **D. ATR (Average True Range) for Risk Management**
- **Stop Loss (SL):** Placed **one ATR below** (for long trades) or **one ATR above** (for short trades).
- **Take Profit (TP):** Set at a **3:1 reward-to-risk ratio**, using ATR to determine realistic price targets.
- Ensures volatility-adjusted risk management.
---
### **3. Entry and Exit Conditions**
#### **📈 Buy (Long) Entry Conditions:**
1. **Price is above the Range Filter** → Indicates an uptrend.
2. **Upward trend strength is positive** (confirmed via trend counter).
3. **RSI is above the buy threshold** (e.g., 50, to confirm momentum).
4. **ADX confirms trend strength** (e.g., above 25).
5. **Volatility is supportive** (using ATR analysis).
#### **📉 Sell (Short) Entry Conditions:**
1. **Price is below the Range Filter** → Indicates a downtrend.
2. **Downward trend strength is positive** (confirmed via trend counter).
3. **RSI is below the sell threshold** (e.g., 50, to confirm momentum).
4. **ADX confirms trend strength** (e.g., above 25).
5. **Volatility is supportive** (using ATR analysis).
#### **🚪 Exit Conditions:**
- **Stop Loss (SL):**
- **Long Trades:** 1 ATR below entry price.
- **Short Trades:** 1 ATR above entry price.
- **Take Profit (TP):**
- Set at **3x the risk distance** to achieve a favorable risk-reward ratio.
- **Ranging Market Exit:**
- If ADX falls below the threshold, indicating a weakening trend.
---
### **4. Visualization & Alerts**
- **Colored range filter line** changes based on trend direction.
- **Buy and Sell signals** appear as labels on the chart.
- **Stop Loss and Take Profit levels** are plotted as dashed lines.
- **Gray background highlights ranging markets** where trading is avoided.
- **Alerts trigger on Buy, Sell, and Ranging Market conditions** for automation.
---
### **5. Advantages of the Enhanced Range Filter Strategy**
✅ **Trend-Following with Noise Reduction** → Helps avoid false signals by filtering out weak trends.
✅ **Momentum Confirmation with RSI & ADX** → Ensures that only strong, valid trades are executed.
✅ **Volatility-Based Risk Management** → ATR ensures adaptive stop loss and take profit placements.
✅ **Works on Multiple Timeframes** → Effective for day trading, swing trading, and scalping.
✅ **Visually Intuitive** → Clearly displays trade signals, SL/TP levels, and trend conditions.
---
### **6. Who Should Use This Strategy?**
✔ **Trend Traders** who want to enter trades with momentum confirmation.
✔ **Swing Traders** looking for medium-term opportunities with a solid risk-reward ratio.
✔ **Scalpers** who need precise entries and exits to minimize false signals.
✔ **Algorithmic Traders** using alerts for automated execution.
---
### **7. Conclusion**
The **Enhanced Range Filter Strategy** is a powerful trading tool that combines **trend-following techniques, momentum indicators, and risk management** into a structured, rule-based system. By leveraging **Range Filters, RSI, ADX, and ATR**, traders can improve trade accuracy, manage risk effectively, and filter out unfavorable market conditions.
This strategy is **ideal for traders looking for a systematic, disciplined approach** to capturing trends while **avoiding market noise and false breakouts**. 🚀

INFINITY ALGO🆕Meet the updated version of our flagship indicator, now it's INFINITY ALGO!
🏃🏻 QUICK START
In very simple terms, our indicator generates complex trading signals on your chart (buy/sell), including Entry Point, Take Profit levels, Stop Loss level
To start, you need to add our indicator to your chart , choose a timeframe (we recommend 13min,15min and 4h but you can try any, these only have the best results) and set up notifications (how to do it told below) and that's it, you can work with it even without changing the settings!
Of course, to improve the accuracy of signals you will have to choose the optimal settings of the script for each trading pair and timeframe (you can find a guide below)
📊 SIGNALS
This script will generate complex trading recommendations, both Long and Short (signals); signals include:
- Entry Point:
Calculated based on pivot levels with confirmation by EMA/SMA (you can select this in the settings); also bullish/bearish cup is checked to confirm the entry.
Additionally, in the settings you can enable Heiken Ashi calculation mode (it shows much better on some trading pairs).
Why do we mashup these components and how they work together?
- The main indicator in our script is pivot levels, it is enabled by default and cannot be disabled. Auxiliary indicators (which you can switch on and off in the script settings) are EMA/SMA and Heiken Ashi. We have used pivot levels, which mark potential support and resistance zones based on previous price action. We have also used EMA/SMA that smooth out price fluctuations and show the direction of the trend. We have added an option to use Heiken Ashi that filters out noise and highlights the trend. We have also checked for bullish/bearish cup patterns, which are reversal patterns that indicate a change in momentum. By combining these indicators, we have created a more robust entry point that considers multiple factors such as price levels, trend, noise, and momentum.
- 6 Take Profit levels:
It is also possible to change in the settings (It is also possible to change the values for Short or Long positions separately), it will be fixed values in % (The default Take Profits for Long&Short are as follows: TP1-0.3%; TP2-1%; TP3-2%; TP4-3%; TP5-7.5%; TP6-16.5%)
- Stop Loss Level:
As with Take Profits, this is a fixed % value that you can customise to suit your risk management needs (It is also possible to change the values for Short or Long positions separately, by default is 4.5% for Long&Short positions)
*When trading on these signals, we strongly recommend that you exit the position in parts at each take profit or close your entire position at one particular take profit. Our script was designed specifically for exiting a position on take profits
⚙️ SETTINGS
Now let's talk about the settings of this script, which allow you to customise the signals quite a lot. In general, we recommend selecting the settings for each trading pair and timeframe separately, this will allow you to achieve better targets accuracy (the default settings are universal, you can trade with them without changing them if you want)
-> IMAGE <-
1. Period - minimum value of 2. Increasing this parameter will increase the accuracy of signals, but will reduce their number (accordingly, lowering the parameter will do the opposite). For the majority of trading pairs and timeframes the optimal period will be between 5 and 10 (the default value is 5).
2. Maximum Breakout length (in bars) - for most trading pairs you can set the value from 200 to 300 and it will be optimal. Below 200 is not recommended
3. T hreshold Rate % - this value also affects the accuracy and the number of signals - the higher this value is, the more often signals will be generated, but it can negatively affect the accuracy. The minimum value is 3, and the maximum value is 10. We recommend to try values in the range from 4 to 7 for most tickers
4. Minimum Number of tests - the number of level checks is required, we recommend to try 2, and only for some timeframes increase to 3
5. MA type & MA filter - The shorter the length of moving averages, the faster they react to trend changes, and show more local trends than global ones. If the length of MAs is longer, more global trends are shown. By default, the most optimal values are set.
By the way, you can ask us for a ready-made preset for any pair and we will be happy to help you!
📄 BACKTESTING
Now let's talk about how to properly test the settings and evaluate their effectiveness. Our script has a c ustom built-in backtester that shows statistics on the current trading pair and allows you to calculate the accuracy of each take profit target, as well as calculate values such as Gross profit/loss, net profit, and the ratio of initial deposit to profit. (you can enable/disable backtester "statistics" label in main settings)
In the main settings you can change the values for: initial deposit (Deposit $), trade size $ and leverage (by the way, it also affects the display of the label "Peak profit", which is calculated with this leverage)
-> IMAGE <-
Now let's look at the backtester - it shows detailed statistics for each Take Profit level, including: accuracy in % and number of trades; gross profit & loss; net profit in % and $ (based on selected settings); deposit to profit ratio in % and $.
Why did we choose such properties in the backtest for publication?
- Well, as the initial capital we took 5000$ and deposit 3% (150$) of the initial capital in each trade. For the fee was taken the value from the exchange Binance, which is 0.06% per trade (Taker + Maker, for a user without VIP on Binance and without taking into account additional fees such as funding, leverage fees, etc).
- Please also take a look at our inbuilt backtester ( IMAGE ) which counts the accuracy to each Take Profit. Also note that our inbuilt backtester does not take any fees into account. Pay attention to the last field "Deposit with Profit" it shows the value if you would close all positions at a certain target. For example, we can see that the most optimal is TP3 at these settings for this trading pair and timeframe, as the deposit to profit ratio will be +61.2%
- Also the script is more designed for swing and long term trading, so on most trading pairs you will be able to see statistics for 60-90 trades dataset
*disclaimer: please note that past results does not guarantee future performance! The accuracy of take profit targets in our backtester is calculated on past results, keep this in mind please
📥 NOTIFICATIONS
We have provided notifications that will deliver the latest signals to you in a convenient format in TradingView. The notification looks like this: It contains the entry point, Take Profits, Stop Loss, and a bit of advice on risk management. -> IMAGE <-
To set up notifications:
1. Select the script settings, trading pair and timeframe
2. Click "add alert on InfinityAlgo", then select "alert () function calls only" in the settings
-> IMAGE <-
3. That's it, now all that's left is to wait for a fresh alert
🔑 HOW TO GET ACCESS
We hope you will like this script :) We are always ready to help you with customisation, just let us know! To learn more about our scripts & get access - check out the “Author’s instructions” below 👇🏼

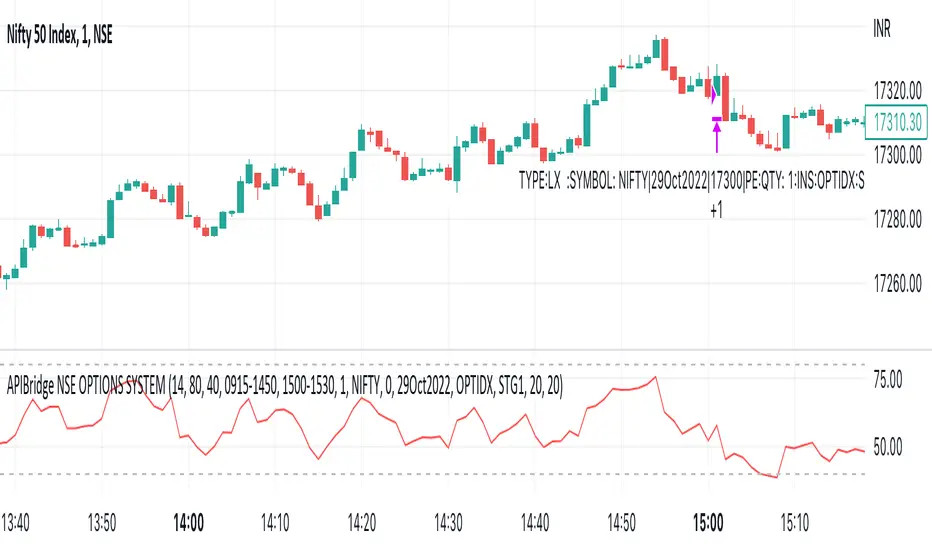
IU Break of any session StrategyHow this script works:
1. This script is an intraday trading strategy script which buy and sell on the bases of user-defined intraday session range breakout and gives alert(if the alert is set) message too when the new position is open.
2. It calculate the session as per the user inputs or user defined custom session.
3. The script stores the highest and lowest value of the whole session.
4. It take a long position on the first break and close above the highest value.
5. It take a short position on the break and close below the lowest value.
6. The script takes one position in one day.
7. The stop loss for this script is the previous low(if long) or high(if short).
8. Take profit is 1:2 and it's adjustable.
9. This script work on every kind of market.
How The Useful For The User :
1. User can backtest any session range breakout he wants to trade.
2. User can get alert when the new position is open.
3. User can change the Risk to Reward in order to find the best Risk to Reward.
4. User can see the highest and lowest value of the session with respect to analyzing his trading objective.
5. This strategy script highlights which session range breakout performs best and which performs worst.

DCA EMA Simple Bot [Starbots]
This is a simple idea of DCA trading on EMA crosses. Strategy is not repainting.
The difference between this and any other strategy is, that this script allows you to preset DCA buy triggers at desired levels and customize each DCA order size independently. Alerts are working, this strategy is easily used for automatic trading.
I mainly trade on Cryptohopper, Pionex, 3commas. This was created for community, alerts are working and non-repainting. Should work on any other as well.
Trading Condition:
It's buying when Fast EMA crosses up Slow EMA. Set your paramters.
It's selling if EMA's crosses back, signaling a sell. Optional.
DCA:
You can enter DCA on 20 custom levels or layers. It buys DCA when price hits the plotted blue line on the chart that's set by input % triggers. (buy 1st DCA at 2% drop, buy 2nd DCA at 5% drop,...)
Set your Inital Capital and Pyramiding in Properties tab, Initial Order Size and DCA Order Size (lot1,lot2,lot3,..), Order Type are changed in strategy inputs.
-By default you can see that we buy when EMA's cross up and signal a buy for 10% of equity, if market is dropping you will then place a first DCA order ( 20% equity) at 2% drop (lower) from initial order. If market keeps dropping you have more DCA levels where you can buy and average down your holding position. For selling you can use Take profit and Stop Loss targets that averages down multiple open positions, it will sell it once it reaches your desirable Take Profit and close a deal. You can also close your trade if EMA signals a sell.
Pyramiding - number of orders you can open at a time
Your first buy order is pyramiding 1. To allow it to buy 1 DCA or merge one time, set pyramding to 2.
Want to DCA 10 times? Set pyramiding at 11. (+1 always)
More features:
- Profit Calendar
- Show Balance label before every new trade
- DCA table - visualize how much of your investment is used in trades. If a background of the table is green you are okay, if the background color is red - you are using more money for orders than you actually have.
Buy Orders << Strategy Equity/Capital
- Show / Hide DCA lines - if your chart processing is getting slow you should hide some DCA levels to speed it up
- Backtesting Range - for testing the strategy in different time windows
- Alerts
When all trades are closed on your chart, winning rate of the strategy is 100% actually.
Win rate is shown differently as it's actually closing and opening every trade individually by default in TradingView system. We merge positions together and average it down into one big position to later sell for a profit (DCA).
You use this Trading Algorithm at your own risk. Do not trade before testing or invest something you cannot afford to lose on markets.

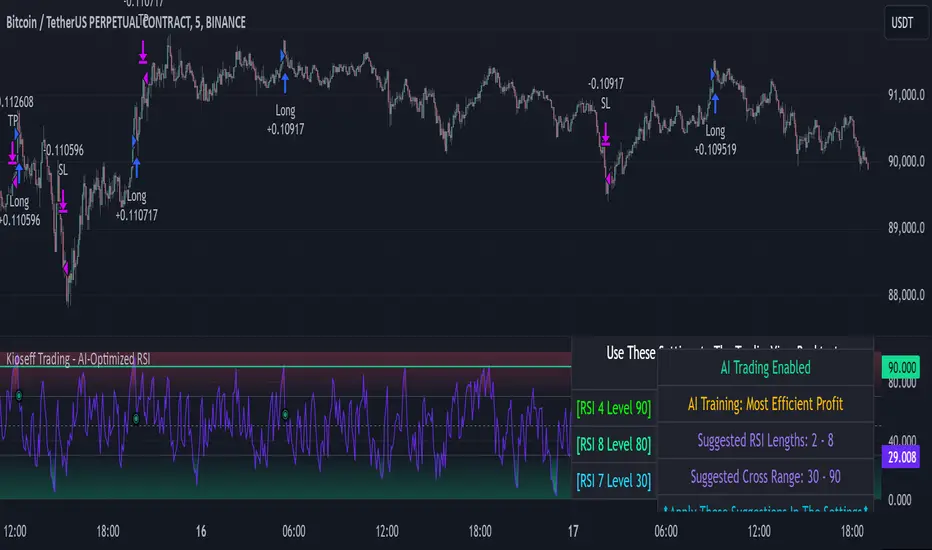
Kioseff Trading - AI-Optimized RSIAI-Optimized RSI
Introducing AI-Optimized RSI: a streamlined solution for traders of any skill level seeking to rapidly test and optimize RSI. Capable of analyzing thousands of strategies, this tool cuts through the complexity to identify the most profitable, reliable, or efficient approaches.
Paired with TradingView's native backtesting capabilities, the AI-Optimized RSI learns from historical performance data. Set up is easy for all skill levels, and it makes fine-tuning trading alerts and RSI straightforward.
Features
Purpose : Uncover optimal RSI settings and entry levels with precision. Say goodbye to random guesses and arbitrary indicator use—this tool provides clear direction based on data.
Target Performance : You set the goal, and AI-RSI seeks it out, whether it's maximizing profits, efficient trading, or achieving the highest win rate.
AI-Powered : With intelligent AI recommendations, the tool dynamically fine-tunes your RSI approach, steering you towards ideal strategy performance.
Rapid Testing : Evaluate thousands of RSI strategies.
Dual Direction : Perfect both long and short RSI strategies with equal finesse.
Deep Insights : Access detailed metrics including profit factor, PnL, win rate, trade counts, and more, all within a comprehensive strategy script.
Instant Alerts : Set alerts and trade.
Full Customization : Test and optimize all RSI settings, including cross levels, profit targets and stop losses.
Simulated Execution : Explore the impact of limit orders and other trade types through simulation.
Integrative Capability : Combine your own custom indicators or others from the TradingView community for a personalized optimization experience.
Flexible Timeframes : Set your optimization and backtesting to any date range.
Key Settings
The image above shows explanations for a list of key settings for the optimizer.
Direction : This setting controls trade direction: Long or Short.
Entry Condition : Define RSI entry: Select whether to trigger trades on RSI crossunders or crossovers.
RSI Lengths Range : Choose the range of RSI periods to test and find the best one.The AI will find the best RSI period for you.
RSI Cross Range : Set the range for RSI levels where crosses trigger trade signals. The AI will find the best level for you.
Combinations : Select how many RSI strategies to compare.
Optimization Type : Choose the goal for optimization and the AI: profit, win rate, or efficiency.
Profit Target : Set your profit target with this setting.
Stop Loss : Decide your maximum allowable loss (stop loss) per trade.
Limit Order : Specify whether to include limit orders in the strategy.
Stop Type : Choose your stop strategy: a fixed stop loss or a trailing stop.
How to: Find the best RSI for trading
It's important to remember that merely having the AI-Optimized RSI on your chart doesn't automatically provide you with the best strategy. You need to follow the AI's guidance through an iterative process to discover the optimal RSI settings and strategy.
1.Starting Your Strategy Setup
Begin by deciding your goals for each trade: your profit target and stop loss. You'll also choose how to manage your stops – whether they stay put (fixed) or move with the price (trailing), and whether you want to exit trades at a specific price (limit orders). Keep the initial settings for RSI lengths and cross ranges at their default to give the tool a broad testing field. The AI's guidance will refine these settings to pinpoint the most effective ones through a process of comprehensive testing.
The image above shows our chart prior to any optimization efforts.
Note: the settings shown above in the key settings section will be used to start our demonstration.
2. Follow AI’s suggestions
Optimization Prompt: After loading your strategy, the indicator will prompt you to change the RSI length range and RSI level range to a better performing range.
Continue changing the RSI length range and RSI level range to match the indicator's suggestions until "Best Found" is displayed!
The image above shows results after we applied the tool’s suggestions. New suggestions have appeared, and we will continue to apply them.
Continue to adjust settings as recommended by the optimizer. If no better options are found, the optimizer will suggest increasing the number of combinations. Repeat this process until the optimizer indicates that the optimal setting has been identified.
Success! With the "Best Found" notification, an optimized RSI is now active. The AI will keep refining the strategy based on ongoing performance, ensuring continuous optimization.
AI Mode
AI Mode incorporates Heuristic-Based Adaptive Learning to fine-tune trading strategies in a continuous manner. This feature consists of two main components:
Heuristic-Based Decision Making: The algorithm evaluates multiple RSI-based trading strategies using specific metrics such as Profit and Loss (PNL), Win Rate, and Most Efficient Profit. These metrics act as heuristics to assist the algorithm in identifying suitable strategies for trade execution.
Online Learning: The algorithm updates the performance evaluations of each strategy based on incoming market data. This enables the system to adapt to current market conditions.
Incorporating both heuristic-based decision-making and online learning, this feature aims to provide a framework for trading strategy optimization.
Settings
AI Mode Aggressiveness:
Description: The "AI Mode Aggressiveness" setting allows you to fine-tune the AI's trading behavior. This setting ranges from “Low” to “High”, with “High” indicating a more assertive trading approach.
Functionality: This feature filters trading strategies based on a proprietary evaluation method. A higher setting narrows down the strategies that the AI will consider, leaning towards more aggressive trading. Conversely, a lower setting allows for a more conservative approach by broadening the pool of potential strategies.
Adaptive Learning Aggressiveness:
Description: When Adaptive Learning is enabled, the "Adaptive Learning Aggressiveness" setting controls how dynamically the AI adapts to market conditions using selected performance metrics.
Functionality: This setting impacts the AI's responsiveness to shifts in strategy performance. By adjusting this setting, you can control how quickly the AI moves away from strategies that may have been historically successful but are currently underperforming, towards strategies that are showing current promise.
Optimization
Trading system optimization is immensely advantageous when executed with prudence.
Technical-oriented, mechanical trading systems work when a valid correlation is methodical to the extent that an objective, precisely-defined ruleset can consistently exploit it. If no such correlation exists, or a technical-oriented system is erroneously designed to exploit an illusory correlation (absent predictive utility), the trading system will fail.
Evaluate results practically and test parameters rigorously after discovery. Simply mining the best-performing parameters and immediately trading them is unlikely a winning strategy. Put as much effort into testing strong-performing parameters and building an accompanying system as you would any other trading strategy. Automated optimization involves curve fitting - it's the responsibility of the trader to validate a replicable sequence or correlation and the trading system that exploits it.
付费脚本
MACD Optimizer Pro [Kioseff Trading]Massive update! This script now includes 12 different moving averages and 30+ built-in technical indicators to enhance your trading strategy optimization! (:
This script (MACD Optimizer Pro) allows the user to optimize and test hundreds of MACD strategies, simultaneously, in under 40 seconds. Of course, theoretically, an unlimited number of trading strategies can be tested with the MACD Optimizer Pro. After the optimization period - the MACD Optimizer Pro will show the most profitable MACD strategy or, should you choose, the highest win-rate MACD strategy or the most-efficient MACD strategy!
Optimization results can be backtested and verified using the native TradingView backtester - which is included in the MACD Optimizer Pro - and made easy to use! This feature makes settings alerts a simple practice!
Features
Test hundreds of MACD strategies, simultaneously, in under 40 seconds.
Optimize long MACD strategies and short MACD strategies.
12 different built-in moving averages included to improve your MACD strategy.
30+ built-in technical indicators to improve your MACD strategy.
Runs as a strategy script - profit factor, PnL , win-rate, number of trades, max drawdown, equity curve and other pertinent statistics shown.
Alerts
Optimize any MACD setting
Profit targets, trailing stops, fixed stop losses, and a binary MACD strategy can all be tested.
Strategies can be optimized for highest win rate, highest net profit, most efficient profit.
Limit orders can be simulated.
External indicators can be used for optimization i.e. your own, custom-built indicator, an indicator from your favorite author, or almost any publicly available
TradingView indicator.
Date range for optimization and backtesting are configurable.
Explanation
The image above shows a list of configurations for the optimizer. You can
You can test hundreds of different MACD settings in under 40 seconds on any timeframe, asset, etc.
The image above shows additional settings to filter the outcome of your optimization testing. Additionally, you can test an unlimited number of profit targets and stop losses!
You can add one of several built-in TradingView indicators to filter trade entries.
The image above shows all built-in moving averages and TradingView indicators that can be incorporated into your MACD strategy.
Additionally, you can add your own, custom indicator to the optimization test, your favorite indicator by your favorite author or almost any publicly available indicator on TradingView.
The image above shows the settings section in which you can implement this feature.
The image above shows an example of the custom indicator feature! In this instance, I am using the public indicator titled "Self-Optimizing" RSI and requiring it to measure below a level prior to entry! Almost any custom indicator, your favorite indicator, etc. is compatible with this feature!
The MACD Optimizer has improved user friendliness over previous versions. The optimizer can be as simple or complex as you'd like - capable of handling both "easy" and "difficult" tasks at your discretion.
Additionally, you can configure the optimizer to prioritize MACD strategies that earn profit most efficiently!
The image above shows this feature in action.
You can also configure the optimizer to prioritize MACD strategies that achieve the highest win rate!
The image above shows this feature in action.
Instructions
The instructions below show a rudimentary approach to using the optimizer.
1. Build your strategy in the settings.
You should also disable the "Run a Backtest" feature to improve load times during optimization.
The image above shows my custom strategy settings.
Now that you've got some data on your chart - you should try "Freezing" the "Smoothing" setting for MACD . When doing this, the optimizer will test hundreds of MACD settings with a fixed "Smoothing" setting. Try using the best "Smoothing" setting you were able to find for your initial testing.
2. Take the best "Smoothing" setting and test various MACD and Signal Lengths.
The image above shows me configuring the MACD Optimizer to test different MACD line lengths and Signal line lengths with a fixed "smoothing" setting.
From the results, we can see that there are better MACD settings than what was shown in our initial test!
With this information we can execute a TradingView backtest.
3. Execute a TradingView Backtest.
You must enable the "Run a Backtest" feature to perform a TradingView backtest. Additionally, it's advised to enable the "STOP OPTIMIZATION" feature when performing a TradingView backtest. Enabling this feature will improve load times for the backtest to only a few seconds (since the optimizer won't look for the best setting when this feature is enabled).
The image above shows completion of the process!
From here, you can perform further testing, set alerts, etc.
Backtest Settings Shown
Initial Capital: The initial capital used for the shown backtests is $3,500 USD. Set the initial capital to replicate your true starting capital (: PnL for the MACD strategies (listed in table) is calculated using a starting capital of $10,000 USD.
Slippage: The slippage settings for the displayed backtest was set to 2 ticks.
Commission: Commission was adjusted to 0.1%.
Verify Price for Limit Orders was set to 2 ticks.
Optimization
Trading system optimization is immensely advantageous when executed with prudence.
Technical-oriented, mechanical trading systems work when a valid correlation is methodical to the extent that an objective, precisely-defined ruleset can consistently exploit it. If no such correlation exists, or a technical-oriented system is erroneously designed to exploit an illusory correlation (absent predictive utility), the trading system will fail.
Evaluate results practically and test parameters rigorously after discovery. Simply mining the best-performing parameters and immediately trading them is unlikely a winning strategy. Put as much effort into testing strong-performing parameters and building an accompanying system as you would any other trading strategy. Automated optimization involves curve fitting - it's the responsibility of the trader to validate a replicable sequence or correlation and the trading system that exploits it.
Thanks for checking this out!
付费脚本

Kioseff Trading - AI-Optimized Supertrend
AI-Optimized Supertrend
Introducing AI-Optimized Supertrend: a streamlined solution for traders of any skill level seeking to rapidly test and optimize Supertrend. Capable of analyzing thousands of strategies, this tool cuts through the complexity to identify the most profitable, reliable, or efficient approaches.
Paired with TradingView's native backtesting capabilities, the AI-Optimized Supertrend learns from historical performance data. Set up is easy for all skill levels, and it makes fine-tuning trading alerts and Supertrend straightforward.
Features
Rapid Supertrend Strategy Testing : Quickly evaluate thousands of Supertrend strategies to find the most effective ones.
AI-Assisted Optimization : Leverage AI recommendations to fine-tune strategies for superior results.
Multi-Objective Optimization : Prioritize Supertrend based on your preference for the highest win rate, maximum profit, or efficiency.
Comprehensive Analytics : The strategy script provides an array of statistics such as profit factor, PnL, win rate, trade counts, max drawdown, and an equity curve to gauge performance accurately.
Alerts Setup : Conveniently set up alerts to be notified about critical trade signals or changes in performance metrics.
Versatile Stop Strategies : Experiment with profit targets, trailing stops, and fixed stop losses.
Binary Supertrend Exploration : Test binary Supertrend strategies.
Limit Orders : Analyze the impact of limit orders on your trading strategy.
Integration with External Indicators : Enhance strategy refinement by incorporating custom or publicly available indicators from TradingView into the optimization process.
Key Settings
The image above shows explanations for a list of key settings for the optimizer.
Set the Factor Range Limits : The AI suggests optimal upper and lower limits for the Factor range, defining the sensitivity of the Supertrend to price fluctuations. A wider range tests a greater variety, while a narrower range focuses on fine-tuning.
Adjust the ATR Range : Use the AI's recommendations to establish the upper and lower bounds for the Average True Range (ATR), which influences the Supertrend's volatility threshold.
ATR Flip : This option lets you interchange the order of ATR and Factor values to quicky test different sequences, giving you the flexibility to explore various combinations and their impact on the Supertrend indicator's performance.
Strategies Evaluated : Adjust this setting to determine how many Supertrend strategies you want to assess and compare.
Enable AI Mode : Turn this feature on to allow the AI to determine and employ the optimal Supertrend strategy with the desired performance metric, such as the highest win rate or maximum profitability.
Target Metric : Adjust this to direct the AI towards optimizing for maximum profit, top win rates, or the most efficient profits.
AI Mode Aggressiveness : Set how assertively the AI pursues the chosen performance goal, such as highest profit or win rate.
Strategy Direction : Choose to focus the AI's testing and optimization on either long or short Supertrend strategies.
Stop Loss Type : Specify the stop loss approach for optimization—fixed value, a trailing stop, or Supertrend direction changes.
Limit Order : Decide if you want to execute trades using limit orders for setting your profit targets, stop losses, or apply them to both.
Profit Target : Define your desired profit level when using either a fixed stop loss or a trailing stop.
Stop Loss : Define your desired stop loss when using either a fixed stop loss or a trailing stop.
How to: Find the best Supertrend for trading
It's important to remember that merely having the AI-Optimized Supertrend on your chart doesn't automatically provide you with the best strategy. You need to follow the AI's guidance through an iterative process to discover the optimal Supertrend settings and strategy.
Optimizing Supertrend involves adjusting two key parameters: the Factor and the Average True Range (ATR). These parameters significantly influence the Supertrend indicator's sensitivity and responsiveness to price movements.
Factor : This parameter multiplies the ATR to determine the distance of the Supertrend line from the price. Higher values will create a wider band, potentially leading to fewer trade signals, while lower values create a narrower band, which may result in more signals but also more noise.
ATR (Average True Range) : ATR measures market volatility. By using the ATR, the Supertrend adapts to changing market volatility; a higher ATR value means a more volatile market, so the Supertrend adjusts accordingly.
During the optimization process, these parameters are systematically varied to determine the combination that yields the best performance based on predefined criteria such as profitability, win rate, or risk management efficiency. The optimization aims to find the optimal Factor and ATR settings.
1.Starting Your Strategy Setup
Begin by deciding your goals for each trade: your profit target and stop loss, or if all trades exit when Supertrend changes direction. You'll also choose how to manage your stops – whether they stay put (fixed) or move with the price (trailing), and whether you want to exit trades at a specific price (limit orders). Keep the initial settings for Supertrend Factor Range and Supertrend ATR Range at their default to give the tool a broad testing field. The AI's guidance will refine these settings to pinpoint the most effective ones through a process of comprehensive testing.
Demonstration Start: We'll begin with the settings outlined in the key settings section, using Supertrend's direction change to the downside as our exit signal for all trades.
2. Continue applying the AI’s suggestions
Keep updating your optimization settings based on the AI's recommendations. Proceed with this iterative optimization until the "Best Found" message is displayed, signaling that the most effective strategy has been identified.
While following the AI's suggestions, we've been prompted with a new suggestion: increase the
number of strategies evaluated. Keep following the AI's new suggestions to evaluate more strategies. Do this until the "Best Found" message shows up.
Success! We continued to follow the AI’s suggestions until “Best Found” was indicated!
AI Mode
AI Mode incorporates Heuristic-Based Adaptive Learning to fine-tune trading strategies in a continuous manner. This feature consists of two main components:
Heuristic-Based Decision Making: The algorithm evaluates multiple Supertrend-based trading strategies using metrics such as Profit and Loss (PNL), Win Rate, and Most Efficient Profit. These metrics act as heuristics to assist the algorithm in identifying suitable strategies for trade execution.
Online Learning: The algorithm updates the performance evaluations of each strategy based on incoming market data. This enables the system to adapt to current market conditions.
Incorporating both heuristic-based decision-making and online learning, this feature aims to provide a framework for trading strategy optimization.
AI Mode Settings
AI Mode Aggressiveness:
Description: The "AI Mode Aggressiveness" setting allows you to fine-tune the AI's trading behavior. This setting ranges from “Low” to “High”, with “High” indicating a more assertive trading approach.
Functionality: This feature filters trading strategies based on a proprietary evaluation method. A higher setting narrows down the strategies that the AI will consider, leaning towards more aggressive trading. Conversely, a lower setting allows for a more conservative approach by broadening the pool of potential strategies.
Optimization
Trading system optimization is immensely advantageous when executed with prudence.
Technical-oriented, mechanical trading systems work when a valid correlation is methodical to the extent that an objective, precisely-defined ruleset can consistently exploit it. If no such correlation exists, or a technical-oriented system is erroneously designed to exploit an illusory correlation (absent predictive utility), the trading system will fail.
Evaluate results practically and test parameters rigorously after discovery. Simply mining the best-performing parameters and immediately trading them is unlikely a winning strategy. Put as much effort into testing strong-performing parameters and building an accompanying system as you would any other trading strategy. Automated optimization involves curve fitting - it's the responsibility of the trader to validate a replicable sequence or correlation and the trading system that exploits it.
付费脚本

APIBridge Nifty Options Algo StrategyUsing Pinescript, we will use charts of Cash/Future to trade in Options. Note this strategy works well with even the free version of TradingView.
The Relative Strength Index ( RSI ). Is a momentum oscillator that measures the speed and change of price movements. The RSI oscillates between zero and 100. Increasing RSI shows increasing bullish momentum. Decreasing RSI shows increasing bearish momentum. We take RSI upper bound as 80 to indicate bullish momentum and RSI lower bound as 20 to indicate bearish momentum.
We use the above premise to create options buy-only strategy which trades in ATM strikes by default. This strategy requires very less margin (Minimum Rs . 15000).
Since this strategy uses underlying data (cash/future) to place trades in Options, please ignore the backtest of this strategy given by TradingView. TradingView does not provide options data but this strategy bypasses it.
Strategy Premise
The Relative Strength Index (RSI) is a momentum oscillator that measures the speed and change of price movements. The RSI oscillates between zero and 100. Increasing RSI shows increasing bullish momentum. Decreasing RSI shows increasing bearish momentum. We take RSI upper bound as 80 to indicate bullish momentum and RSI lower bound as 20 to indicate bearish momentum.
We use the above premise to create options buy-only strategy which trades in ATM strikes by default. This strategy requires very less margin (Rs. 15000 should be sufficient).
NSE Options Algo Strategy Logic
Long Entry: When RSI goes above 80, send LE in an auto-calculated option strike Call. When RSI goes below 20, send LE in auto-calculated option strike Put.
Long Exit: When we hit Stop loss or Target. In case SL/TGT does not hit and reverse RSI goes above 80 send Long Exit in auto-calculated option. Put as per last trade; RSI goes below 20, send LX in auto-calculated option call as per last trade.
For Long and Short entry the order is fired in the option buying side with auto strike price selection.
Option Strategy Parameters for TraingView Charts
RSI Length(Mandatory): Number of bars used to calculated RSI.
Upper Band(Mandatory): To specify upper band of RSI.
Lower Band(Mandatory): For specifying lower band of RSI.
Use reversal from Upper Band (Optional): This will enable short entry when RSI is falling below 80 from upper band. Recommended to keep unchecked initially.
Use reversal from Lower Band (Optional): This will enable long entry when RSI is raising above 20 from lower band. Recommended to keep unchecked initially.
Quantity: We use this specify the trade quantity (for Nifty min 75)
Custom Stop Loss in Points: Movement in chart price against the momentum which will trigger exit in options positions
Custom Target in Points: Movement in chart price against the momentum which will trigger exit in options positions
Base symbol: This is the base instrument symbol like NIFTY or BANK NIFTY.
Strike distance from ATM: Our default strike selection is considered as first ATM option (with nearest distance, only 100s are considered ). This strike distance allows to calculate ATM options which are at fixed distance.
Expiry: Expiry of option. Weekly and monthly both expiry are allowed.
Instrument: For index instrument will be OPTIDX, for stock instrument will be OPTSTK
Strategy Tag: The Strategy of Nifty options configured in Api bridge.
Setting Up Alert
Before setting up the alert make sure that you have selected desired script, time frame, strategy settings, and APIbridge configuration. Click in settings add alert and paste {{strategy.order.comment}} in message box.
Important: Do not change any settings during live trading. It may break the sequence of exit for the correct call/put.