RSI Mean Reversion StrategyThis is a scalping strategy designed to be used for crypto trading. It uses an Exponential Moving Average with a default length of 100 in order to identify the trend of the market. If the price is trading above 100, it will only take long trades, and vice versa for shorts. It places long orders when the RSI value closes below 40, and the price is also above the 100 EMA. It places short orders when the RSI value is above 60, and the price is below the 100 EMA.
*Note: for custom alert messages to be read, "{{strategy.order.alert_message}}" must be placed into the alert dialogue box when the alert is set.
在脚本中搜索"alert"

Miyagi (10 in 1) + DCA StrategyMiyagi: The attempt at mastering something for the best results.
Miyagi indicators combine multiple trigger conditions and place them in one toolbox for traders to easily use, produce alerts, backtest, reduce risk and increase profitability.
Miyagi (10 in 1) + DCA Strategy built for the Miyagi (10 in 1) + Alerts found here:
The DCA Strategy was designed to help visualize, backtest and improve users' DCA strategies and overall profitability.
Users can backtest different trading timeframes using the start and end date inputs.
Users can backtest different take profit and stoploss percents, both long and short.
Users can choose whether or not to use DCA on the backtester via a selectable input.
Input the DCA as you would normally using the Wick Hunter bot.
Happy trading!

Miyagi (4 in 1) + DCA StrategyMiyagi: The attempt at mastering something for the best results.
Miyagi indicators combine multiple trigger conditions and place them in one toolbox for traders to easily use, produce alerts, backtest, reduce risk and increase profitability.
Miyagi (4 in 1) + DCA Strategy built for the Miyagi (4 in 1) + Alerts found here:
The DCA Strategy was designed to help visualize, backtest and improve users' DCA strategies and overall profitability.
Users can backtest different trading timeframes using the start and end date inputs.
Users can backtest different take profit and stoploss percents, both long and short.
Users can choose whether or not to use DCA on the backtester via a selectable input.
Input the DCA as you would normally using the Wick Hunter bot.
Happy trading!

Market First - Relative Strength/Weakness (the ZenBot strategy)This market-first trading strategy gives BUY, SHORT, and CLOSE signals based on volume, trend, and relative strength or weakness to the market (SPY by default, can be customized). This indicator is useful for signaling day-trade entries and exits for tickers that are strong (or weak) against the market.
Stocks that are showing relative strength (or weakness) to the market, are trending, and have decent movement generate a buy (or short) signal. When the trend runs out, a CLOSE signal is fired.
Potential profit (based on ATR) and actual profit is calculated, predicting the type of move expected
Unique 'stay in trade' logic helps prevent unnecessary CLOSE signals if a trend is likely to continue
A colored plot indicates the strength of the current trend and turns orange/red when the strength is weakened.
Crypto traders can uncheck 'Trade during market hours' for 24-hour trading, and should change the comparison ticker from SPY to BTCUSD or something similar for their market.
Enjoy!
KEY CONCEPTS
The three- and five-minute timeframes are used to establish and verify trend ( ADX /DI with custom logic)
Entries and exits are based on Parabolic SAR and confirmed on multiple timeframes, trend, and relative volume
Relative strength /weakness to the market compares ticker to SPY
Chop is avoided at all costs. I've experimented with choppiness indicator below 38, but found that the ADX DI+/- readings work even better.
Trend is established using ADX DI+/- readings over 20, confirmed by EMA 5/13 crossover and EMA5 slope
Signals will fire only if the average volume for the current 5-min bar is above normal
Only tickers with a five-bar / 13 period ATR of 1% the ticker's price generate signal.
Only longs above daily-anchored VWAP , shorts below daily-anchored VWAP
Signals fire on bar close to prevent repainting / look-ahead bias
Indicator labels and alerts generated
SIGNALS
BUY: up-trending tickers showing relative strength are bought on the three-minute PSAR
SELL: when the close price falls below the 1, 3, and 5-minute PSAR, or the ADX DI- falls below 20
SHORT: down-trending tickers with relative weakness are shorted on the three-minute PSAR
COVER: when the close price moves above the 1, 3, and 5-minute PSAR, or the ADX DI- falls below 20
ALERTS
Alerts are generated on BUY, SELL, SHORT, and COVER signals, as well as optional LOST RELATIVE STRENGTH and LOST RELATIVE WEAKNESS
INPUTS
Use relative strength /weakness comparison with the market : trigger trades based on the ticker's strength or weakness to the selected comparison ticker (usually SPY for equities or BTCUSD for crypto)
[* ]Comparison Ticker for relative strength /weakness : Ticker to compare against for relative strength /weakness
Trade during market hours only : Take buy/sells during specified hours. Disable this for crypto trading.
[* ]Market hours (market time) : Customize market hours - defaults to 9:30 to 16:00 EST
[* ]"Only trade very strong trends" : take trades only if an established trend is very strong ( ADX over 40 ) (DEFAULT = ON)
"Limit trade direction to VWAP" : Long trades only above VWAP , shorts below (DEFAULT = ON)
"Limit trade direction to Market direction" : Long trades only if SPY (or selected comparison ticker) is up, shorts if the market is down. (DEFAULT= ON)
"Limit trades based on a ticker's green/red status for the day" : Long trades if the ticker is green for the day, shorts if red. (DEFAULT = ON)

BEST Strategy Template AutoviewHello Traders
I've build a strategy template building for you the AUTOVIEW commands
I made this template based on this documentation: use.autoview.with.pink
You can select whether you want to use an SL or not, a TP or not, using the borrow/repay feature (only for Binance), ... and it will build dynamically the Autoview commands and will send them when entry/exit alerts trigger.
The template accept SL/TP in percentage or pips/USD distance from the entry price
MAGICAL !!!! (not really, just some dumb coding)
Users will have to specify from the settings:
- the Autoview account name
- the symbol name: I couldn't capture it from the chart because sometimes the symbol name on the broker side is different than the one from the TradingView side
- the position size
- the broker name (Tradovate, Binance, Bitmex, FTX, ...)
- if you want to send the alerts to your DEMO or LIVE account
- a debug mode to check if your alerts are well formatted
- and a few other interesting options...
If you want to use it, you'll have to update the dummy entries logic lines 97-98 and replacing those two lines by your own stuff
I'll make the ProfitView and 3Commas and Alertatron versions shortly.
Basically the same script but with the commands built for those 3 automation third-parties.
Best regards
Dave

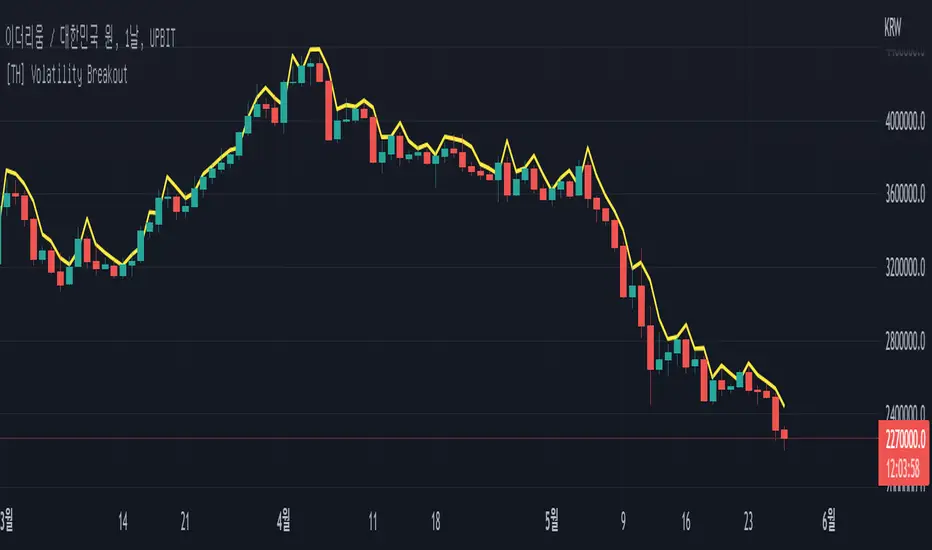
[TH] Volatility BreakoutVolatility Breakout Strategy for TradingHook.
This strategy is not for backtesting but for forward-testing starting when added to chart.
It can make and send a formatted message string for buy and sell order using alert.
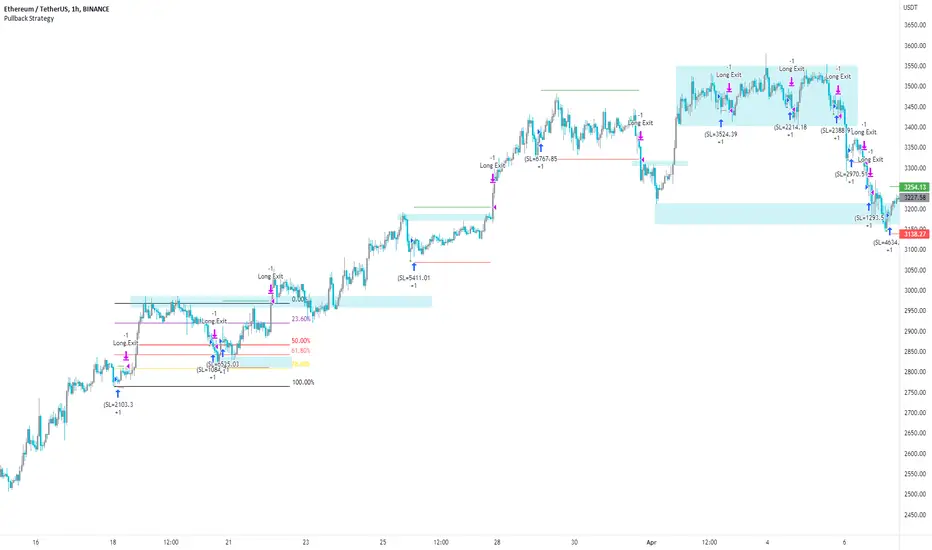
Pullback Strategy (Candle Analysis) New VersionFollowing on from the previous Pullback Candle which smashed over 100 likes - here we have the strategy behind the indicator.
Signal = Pullback Candle (This will alert on all timeframes and markets when selecting the Alert function for the Signal
Entry = When the Pullback Candle is confirmed ie 16:00 - the strategy will enter within the next two candles.
Stop loss = 0.25 ATR multiple which means we have a tighter stop loss - if greater than 1 then the stop loss will be more in percentages!!!
Take Profit = 1.5 Risk to Reward Model
Ema filter - There is a function to modify when looking into trades so as this is a bullish setup we want trades to be over the ema and using this filter will only show trades above the 200ema
Time filter - If you want to backtest Uptrends - locate the time of the start and the end of the uptrend - input this data into the settings and this will bring up the trades in that time period.
Most efficient to use this script is only in uptrends and this signal is a bullish signal - when using a ema filter we wont get trades under this so narrow down good trades for automation.
!!!!TO ENHANCE THE SYSTEM - USE TECHNICAL ANANLYSIS FOR CONFLUENCES
Most inefficient way to use the script is when price is in a downtrend and the win rate falls dramatically.
The pullback candle has a R-Expectancy of R5 so profits can be elongated when trading manually.
As the pullback candle occurs often in a trend we could pyramided trades to say have 5 trades in the same direction but the way i would trade this is to alert R1.5 then look to R2 and above to take profits manually.
(((P.S coders.... i need help to work on a profit extension code where exit long when price is below the 9ema (this seems simple but proving difficult) - this would be included onto the script if received.
RSI StrategyThis RSI strategy will allow you to go long when RSI is overbought and go short when RSI is oversold. You can also change the checked boxes to reverse this. Uncheck "Overbought Go Long & Oversold Go Short" and check "Overbought Go Short & Oversold Go Long" to use this reversed option.
You can also choose to use an ema filter as an additional qualifier for entry. Uncheck "No EMA Filter" and check "Use EMA Filter" if you want to use it.
Be sure to enter slippage and commission into the properties to give you realistic results.
I've also built in backtesting date ranges and the ability to trade only within certain times of day and have it close all trades at the end of that time frame. This is especially useful for day trading stocks. To specify a time from use the format 0930-1100 or whatever your trading hours will be. Check off "Enable Close Trade At End Of Time Frame" to close the trade at the end of your trading hours.
You can also specify a % based take profit and stop loss. Also keep in mind that the way this code is designed if you use the stop loss and/or take profit and it reaches either target and closes, then it will immediately re-enter if the condition for long or short entry is true.
Finally there's custom alert fields so you can send custom alert messages for strategy entry and exit for use with automated trading services. Simply enter your messages in the fields within the strategy properties and then put {{strategy.order.alert_message}} in your alert message body and it will dynamically pull in the appropriate message.

CCI StrategyThis CCI strategy will allow you to enter a long or short off a CCI zero line cross or control entries and exits from custom upper and lower band lengths. You can set a custom upper band which it will buy when it crosses up and then a custom upper band exit which it will sell when it crosses down. For a short you can set a custom lower band which it will short when it crosses down and the custom lower band exit which it will exit the short when it crosses up. Be sure to enter slippage and commission into the properties to give you realistic results.
I've also built in backtesting date ranges and the ability to trade only within certain times of day and have it close all trades at the end of that time frame. This is especially useful for day trading stocks. If you check off "Enter First Trade ASAP" then when using the time frame option it will enter the current trade. If however you uncheck that box and instead check off "Wait To Enter First Trade" it will wait for the trend to change and then enter.
You can also specify a % based take profit and stop loss. Also keep in mind that if you have "Enter First Trade ASAP" checked off and use the stop loss and/or take profit then it will re-enter the current trend again.
Finally there's custom alert fields so you can send custom alert messages for strategy entry and exit for use with automated trading services. Simply enter your messages in the fields within the strategy properties and then put {{strategy.order.alert_message}} in your alert message body and it will dynamically pull in the appropriate message.

Supertrend StrategyThis Supertrend strategy will allow you to enter a long or short from a supertrend trend change. Both ATR period and ATR multiplier are adjustable. If you check off "Change ATR Calculation Method" it will base the calculation off the sma and give you slightly different results, which may work better depending on the asset. Be sure to enter slippage and commission into the properties to give you realistic results.
I've also built in backtesting date ranges and the ability to trade only within certain times of day and have it close all trades at the end of that time frame. This is especially useful for day trading stocks. If you check off "Enter First Trade ASAP" then when using the time frame option it will enter the current trade. If however you uncheck that box and instead check off "Wait To Enter First Trade" it will wait for the trend to change and then enter.
You can also specify a % based take profit and stop loss. In most cases the stop loss is not needed because of the atr based stop that supertrend provides so you could check only take profit and see if it works best to take profit or to let supertrend trend change get you out. Also keep in mind that if you have "Enter First Trade ASAP" checked off and use the stop loss and/or take profit then it will re-enter the current trend again.
Finally there's custom alert fields so you can send custom alert messages for strategy entry and exit for use with automated trading services. Simply enter your messages in the fields within the strategy properties and then put {{strategy.order.alert_message}} in your alert message body and it will dynamically pull in the appropriate message.

WaveTecs StrategyWelcome to the Backtesting version of "WaveTecs Strategy", the indicator itself is an invite-only script called "WaveTecs Indicator" on TradingView.
WaveTecs Strategy
WaveTecs is a Strategy that combines Wave Trend Oscillator and verifies wave momentum by using RSI and Stochastic Oscillator Values.
What is Wave Trend?
One of the most effective indicators in identifying swings is the Wave Trend indicator. Wave Trend plots waves using highs and lows between an upper band and a lower band. It looks for the opening and closing of a new wave trend movement as well as overbought and oversold areas.
How does this modified strategy work?
By using RSI and Stochastic values we are able to verify Wave inflection points to determine if there is a suitable amount of momentum to ride the swing and make profitable trades. Positions are taken or closed based on the rising or falling momentum.
Each value input can be adjusted to best suit the type of market you are trading in. By using the strategy we can optimize these value inputs to yield greater net profits. I have found the RSI and Stochastic values hugely impact entries and exits regarding trades.
For Long conditions:
- RSI & Stochastic needs to be increasing and moving out of oversold conditions to show positive momentum.
- Falling momentum results in a sell signal. I have found RSI less than 65 to be sufficient in most markets however this can be adjusted at any time to yield different results depending on your comfort level.
For Short conditions:
- RSI & Stochastic needs to be decreasing and moving out of overbought conditions to show negative momentum.
Generally, Wave Trend Strategies only take trades that are outside of the bands. This strategy allows trades inside and outside of the bands, which can be selected under the input section title "Aggressive Trading". Trading in this mode is more frequent as signals are often. Due to volatility in crypto markets, I have defaulted the source for Wave Trend waves to be Open/High/Low/Close Average which yielded great results. High/Low/Close average works very well for all other securities, and can easily be adjusted through the drop-down menu inside the inputs.
Works for all types of markets. Parameters can be adjusted but not required as indicator values are standard in the industry.
The default parameters are set to those typically used in the markets currently. However, I have found that if you adjust you to adjust the parameters based on your asset and time frame desired you will yield different results.
----------------
For example:
----------------
ETHUSDT - 4 HR, results are shown below
Wave Trend Parameters:
Aggressive Trading: Yes
Channel Length: 12
Average Length: 24
Overbought Top: 90
Overbought Bottom: 75
Oversold Bottom: -90
Oversold Top: -55
Source: hlc3
Strategy Type:
Trade Direction: Long Only
Stochastic Inputs:
Stoch Length: 18
Smoother %K: 5
Moving Average %K: 4
%K Lower Limit: 21
%K Upper Limit: 80
%K Crossunder Sell: 80
Relative Strength Index Inputs:
RSI Lower Limit: 30
RSI Upper Limit: 70
RSI Sell Value: 68
==================
WaveTecs Features
==================
Profitable Trading Strategy;
Aggressive Trading feature for more trades, with earlier entries and exits;
Customizable inputs to fine-tune your trades;
Buy & Sell Alerts (Indicator Only);
Overlay indicator only to show alerts, WaveTecs Strategy needed to see Wave Trend;
Bot Integration through webhooks;
Two different strategy modes: Long Trades Only or Long & Short Trades
Adding new features & updates whenever possible.
Add both WaveTecs Indicator and WaveTecs Strategy to your chart. WaveTecs Indicator only plots Buy & Sell Alerts, whereas WaveTecs Strategy lets you see what the strategy is doing.

Ultimate Bullish Divergence for RSI MFI RVSI OBV w/ Buy SignalsThis strategy is based on the Indicator below and includes all of its features.
This version Includes the Strategy tester and a dynamic SL
The only drawdown of this version is that Alerts are not as customizable
Ultimate Bullish Divergence for RSI OBV RVSI MFI w/ Buy Alerts

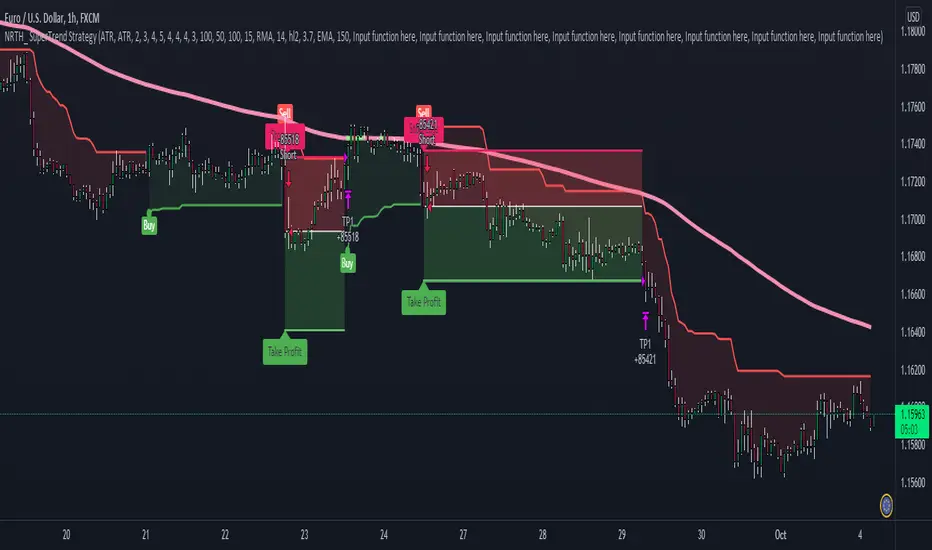
SuperTrend StrategyNRTH_ SuperTrend strategy, packed with alerts, visual backtesting, and ready for automation.
Comes included with the Premium Package.
Indicator features
Built-In Alerts
Visual Risk Management
Customizable Entry Rules
Usage Tips
Works on 15m+ timeframes, tweak sensitivity accordingly
We recommend using higher timeframes with very strict entries
Well known SuperTrend strategy, packed into a NRTH_ strategy package, with visual backtesting, custom risk management, and alerts ready for automation
Works for all markets with the ability to customize to your liking.
Backtesting Results Info
Period 1/1/2021-1/10/2021
Entry value at $1000 with 100x leverage
ATR Exits : 1:1.35 RR
-------------------------------------------
Disclaimer
Copyright NRTH_ Indicators 2021.
NRTH_ and all affiliated parties are not registered as financial advisors. The products & services NRTH_ offers are for educational purposes only and should not be construed as financial advice. You must be aware of the risks and be willing to bear any level of risk to invest in financial markets. Past performance is not necessarily indicative of future results. NRTH_ and all individuals associated assume no responsibility for your trading results or investments.
All investments involve risk, and the past performance of a security, industry, sector, market, financial product, trading strategy, or individual’s trading does not guarantee future results or returns. Investors are fully responsible for any investment decisions they make. Such decisions should be based solely on an evaluation of their financial circumstances, investment objectives, risk tolerance, and liquidity needs.
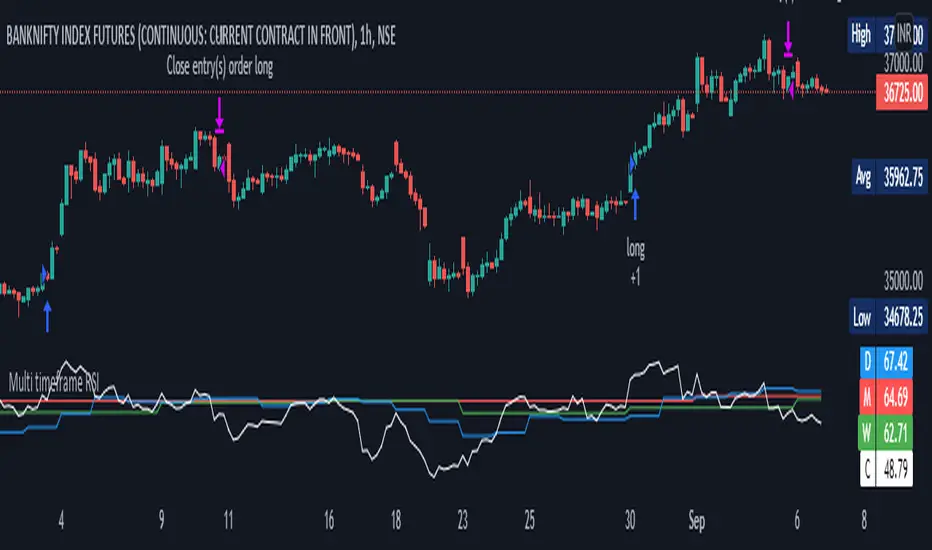
Multi timeframe RSI StrategyMulti Time Frame RSI is based on Concept of capturing Higher Time frame Momentum. Generally Higher TF Trends are more reliable and long
This strategy get the Monthly Weekly Daily and Current Time frame RSI and then trade on lower time frame taking as base of Higher TF
For Monthly, Weekly and Daily TF => RSI is set to = 40
for Lower TF => Upper RSI is = 65 Lower RSI is = 45
Trading Logic
Long = Current RSI > ( upper RSI and Monthly, Weekly and Daily TF RSI )
Short = Current RSI < ( Lower RSI and Monthly, Weekly and Daily TF RSI )
Brokerages Set to = 0.03%
Risk Mgmt=> Per trade risk = 5000 Rs
Alert=> alert are coded once you schedule TV alert, following singnal will get generated at current TF Candle close
Long = LE,
Close Long = LX
Short = SE,
Close Short= SX
For Bank Nifty = 1 hrs TF is preffered and Nifty = 15 Min TF
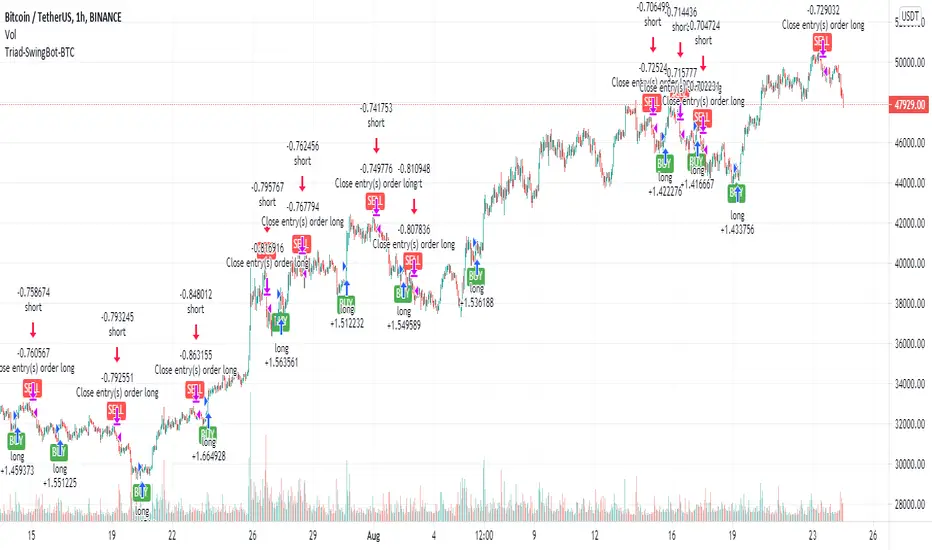
Triad-SwingBot-BTCStrategy tuned for BitCoin . The indicator version of this uses alerts to start a long or short DCA 3comma bot. Preferably running on futures exchange so I can go long or short and use 5x margin. Alerts also take profit/close position when trend changes.
KYC crackdown is leaving me limited places I can run these now.
Use this on Binance BTC /USDT 1HR chart. Binance seems to give the best data even when trading from other exchanges.
There are various versions of these I might release tuned to each cryptocurrency. I have about 20 different coins that were profitable. Each work best with different settings.
This strategy uses a variety of factors to determine long and short entry including:
-Price is starting to trend up (long) or down (short)
-Price closing above/beneath specified EMA or SMA
-Price within RSI bounds for valid entry
-MACD histogram is positive(long) or negative (short)
-Volume surge indicating viable entry
If there's decent interest in the indicator version of this with alerts to send long/short signals to bots, I'll work out an invite-only system.
xGhozt Consecutive Candle Count - BacktestxGhozt Consecutive Candle Count with Backtest simply counts consecutive positive or negative candles, and allows you to get the live statistics of how many times this consecutive candle series occurred in the past, with the probabilities of the next candle to be a reversal, and the average past gains from that reversal. You can select the number of consecutive candles you're tracking, and select a start and end date. When your desired pattern is met by the indicator, it will indicate you on the chart if it's worth shorting or longing the next candle.
You also have the possibility to set up alerts when your consecutive candles patterns are met. To do so, go into the indicator's settings, select your time frame, the consecutive number of candles you are tracking, your success rate, and the number this pattern occurred in the past. Once it's done, open the alerts box, and set up your alerts accordingly.
You will have 2 options:
- Green Candles Followed by Red = short next candle.
- Red Candles Followed by Green = long next candle
Now that the backtest is added, you can try different combinations and figure the best outcome to get the best returns!
One thing to note with the backtest: you cannot run the backtest with take profits / stop loss AND candle closing, it has to be one of the two.

Godtrix's Crypto HA+RSI+EMA+ATH+DCA Strategy 3.0New Updates is here! Upgrade from previous version 2.0 (Please avoid using v2.0 as it's outdated.)
Great stability, Repaint bug fixes, and New features!
==================
| Introduction: |
==================
This is a Long Term Strategy, using compounding profit method, it can generate high returns, but it also risk for losses, this can be overcome if you set Stop Loss to over 25% for bitcoin & 60% for Altcoins.
Best profit plan with this strategy is you trade on Future leverage while you hold on to your coin, so that when price goes up, your coin value goes up, and at the same time, you trade with your leverage to earn even more, easily doubling up your total profit.
Benefits:
Fully customizable and you can easily personalized it and FINE TUNE it according to the market or coin you trading on.
The strategy is based on REAL PRACTICAL trading skills, so it works in real-world.
I fixed the "repainting" issue so the backtest it shows you IS ACCURATE when you run for real-time.
We all know one indicator is not going to help you win your trades, so this strategy combines ALL three: EMA for long+short term trend, HA for short term trend, RSI for entry/exit
This strategy is designed for LONG trade (Buy low, Sell high), not for SHORT trade.
This is not day trading, it is more to mid-term trading, where there's only few trades per month
Mainly is coded to work with 3Commas bot auto trading, so you only need to key in your Bot ID & Email Token.
Bot trading NOTE:
- You need to replace the Alert Message with this: {{strategy.order.alert_message}}
- And you'll need the Bot's webhook Url set with the Alert too.
- One Alert will work for both Buy and Sell Order
- If you using other Bot service, you can enter Custom Command in Input Settings too, it works on any bot service.
Lastly,
regarding the setting advice, I would say you try playing with different settings and your objective is to achieve a backtest result that has:
1) Profitable is > 80%
2) Losing trades is nearly 0 or below 25% of your winning trades. Trick is using far stop loss %
3) Net Profit be almost same or more than "Buy & Hold Profit"
==================
| Latest Updates: |
==================
=| Tidy Up Codings |=
- Group input fields so it'll be easier to understand and find the settings
- Upgrade code for obsolete 'transp' options
=| Repaint Issues |=
- Previous v2.0's RSI has repaint issue, creating false result against real-time data. I've fixed this.
- Also done fine-tuning other parts of the codes to prevent possible repaint issues.
=| Bot System |=
- Improved Custom Bot system, so that you're able to set dynamic order size/quantity with my custom keyword: and
Base Order Example:
{ 'message_type': 'bot', 'bot_id': 1234567, 'email_token': 'abcdefgh-1234-1234-1234', 'base_order': , 'delay_seconds': 0, 'pair': 'USDT_BTC'}
=| EMA Downtrend Exit |=
- Added option for you to decide whether to close position when detected EMA Long term downtrend.
=| EMA 2 (short term) is removed |=
- After several test, I've decided to remove this because it doesn't contribute to improving the results.
=| Heikin Ashi System |=
- Improved the chart display, now you'll see the HA candle 'shadowed' behind, so you'll see both actual price candle and HA candle at same time.
- Added the system that detect the HA candle sizes to decide specifically when it's suitable for Entry and Exit.
>> For "Entry/Exit Range"
- This means after HA is valid for Entry or Exit, how many following bars are allowed to stay valid so it will match other requirements to be completely fulfilled for Entry or Exit.
>> For "Crossing Interval"
- This means after detected HA line crossover, how many HA intervals is allow to Entry or Exit
>> For "Reversed Exit"
- This function let's you decide whether to close position if after HA bull (green candle) changed into HA Bear (red candle)
=| RSI A Entry |=
- Added option to avoid Entry during NTZ (No trade Zone)
- Also added the option to avoid next same condition RSI A entry too soon
=| RSI B Entry |=
- This function is for Entry if RSI is going very low, mostly due to bigger price drops in short time, it's good for buying DIP, however we'll never be able to know when a DIP ends, so do more test on this settings before put into real use.
- Added "avoid" options to help avoid getting Entry at "false" DIP, more like a short & fast pullback which causes RSI to drop very low but actually the price is near ATH or Recent High.
- Added option for Entry with Trailing Price Lower Buy combine with a limit order that grabs low price, so whichever it fulfill first.
=| New: Avoid Entry |=
- Well, it's a pain if you bought at the top, so I've added two options that will avoid buying near ATH and Recent High.
=| Time-limit Removed |=
- Sorry that I've missed look on the script policy which I'm not allowed to put a time-limit for public scripts.
=| System Improvements |=
- HA condition detection is optimized and bug fixed
- RSI values now reads accurately on each bar despite using higher timeframe, especially when moving to next interval
=| New: Dollar Cost Averaging (DCA) Orders |=
- Although DCA strategy is not appealing for Long term strategy, but I've added it for your extra options and flexibilities.
- The settings are quite straight-forward and standard, so I won't be explaining here.
=| New: Backtest Start & End Date |=
- This is very good function when you need more accurate result starting at specific date & time.
- Also if you set the date & time for your real trading starts, it'll much result the same as your actual trading records, which helps you to see clearer and make future decisions.
Any found bugs or flaws, please feel free to PM me, I can't get notifications from comments here below, so I'll not able to reply you the soonest possible, still not sure how to turn on notification for comments, anyone who knows can PM and teach me, lol... Thanks in advance!
Well, this is free version, hope it helps! Feedbacks are all welcome :)
(To Moderators: I've fully use the "f_security()" guideline, but instead of creating a separate function, I apply directly on all security() function. Please don't ban my script before fully check if I've truly fixed repaint. Thank you.)
BITSTAMP:BTCUSD COINBASE:BTCUSD COINBASE:ETHUSD BINANCE:BNBUSDT

All in One Strategy no RSI Label - For higher dollar cryptoThis is the All in One Strategy without the RSI suggestion label that will work well for any of the crypto currencies trading above $500 so the overlay shows up better. I am using ETH as an example on this.
Based on some comments on my previously published script that has been replaced I have added Alert Conditions to this version that can be used in other bots. You can also copy and paste these alert conditions into the other All in One script I published for the lower priced cryptocurrencies.
To use the alert conditions I have in here, you will need to convert this strategy into a study to do so. Delete the entry and exit logic at the end (lines 299 through 351), delete line 18 and paste the following in place of line 18:
study(shorttitle='Ain1 No Label',title='All in One Strategy no RSI Label', overlay=true, scale=scale.left)
Here are the settings to mimic what you see here in the back test strategy I am publishing. Remember that previous results do not guarantee future results.
Chart Time = 30 Minutes (if you didn't read my original All in One post, read it. Shorter isn't better. You lose your money faster in a shorter amount of time and I learned that the hard way)
Start Time = 1 April 2021 00:00
End Time = 31 December 2021 00:00
Trade Type = Long/Short
Stop Loss % = 20.1
Take Profit % = 14.57
RSI Length = 20
Overbought = 44
Oversold = 45
EMA Fast Length = 5
EMA Slow Length = 15
Overbought Lookback Minimum Value = 62
Overbought Lookback Bars = 3
Oversold Minimum Value = 43
Oversold Lookback Bars = 5
Source = Close
Max Lookback Period = 5
Use EMA Only = True (check the box)
K = 9
D = 17
K Mode = SMA
High Source = ohlc4
Low Source = ohlc4
Properties - Starting Amount is $3500, everything else is the same.
Any questions, feel free to ask. I will answer as soon as I can.

MACD Signal with RSI Indicating StrategyThis strategy looks for MACD signal crossover and RSI confirmation of oversold/overbought condition.
Tune to your crypto/stock for best results using the strategy and sent an alert. Currently set up to use 25% of equity at each buy signal and will sell 1/3 of position at each sell signal. Initial investment is $1000, but adjust as necessary.
Currently tuned to DOGEUSD on 30min chart.
If you like/use/profit, follow me or shoot me a donation. If you are looking for a script design, I can help.

OF Scanner Strategy This script filters stocks based on exponential moving average crossover. It will generate alert for configured stocks. You can configure Alert and use this strategy for notification. It will help by providing instant alert on crossovers.

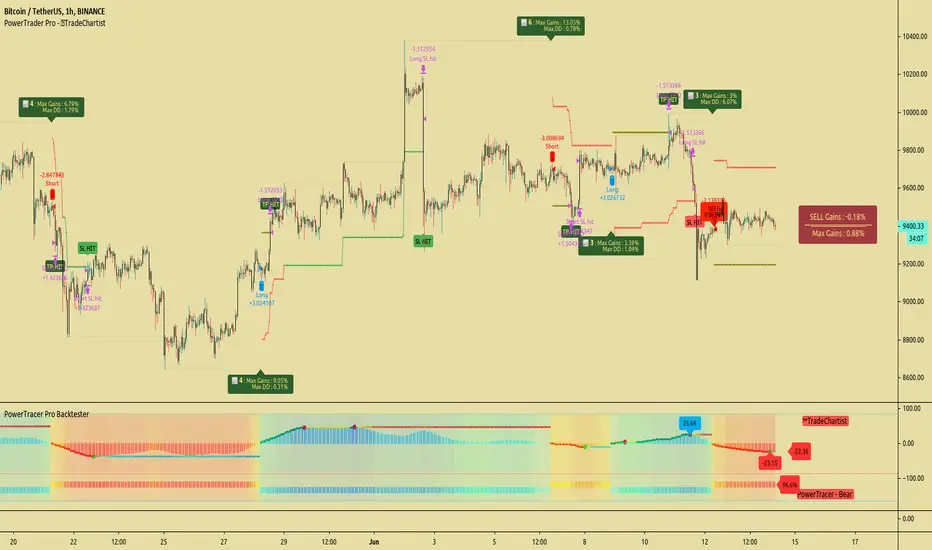
TradeChartist PowerTracer Pro Backtester™TradeChartist PowerTracer Pro Backtester is the strategy script for backtesting ™TradeChartist PowerTracer Pro for best performance settings which can then be used with ™TradeChartist PowerTrader Pro to plot Trades emulating the backtester and use Alerts (once per bar) on real time price chart.
PowerTracer Backtester includes the following options in the settings.
PowerTracer setting - Power Plot Type - (PowerTracer, Bar-wise Power Holder)
PowerTracer setting - Timeframe Multiplier
PowerTracer setting - Smoothing Factor
Backtester setting - Trade Direction - (Both Longs and Shorts, Only Longs, Only Shorts)
Backtester setting - SL Type (Fixed Stop Loss, Trailing Stop Loss)
Backtester setting - Reference for Trailing SL (Close, High/Low)
Backtester setting - Stop Loss %
Backtester setting - Take Profit %
Backtester setting - Quantity to trade at TP %
Using combinations of the settings, the user can find optimal settings for the asset to deliver lucrative entry and exit signals with high ROI and minimal Drawdown which can then be used on PowerTracer Pro and PowerTrader Pro to plot signals and create alerts to start trading in real-time.
Example charts:
GBP-USD 1hr chart - (2,1,Trailing SL, close, 1,1,25)
BTC-USDT 15m chart - (4,5, Trailing SL, high/low, 3.9,1.2,15)
SPX 1hr chart - (1,3, Trailing SL, high/low, 3, 2, 50)
This backtester needs the following scripts to generate signals and plots on main price chart and for real-time alerts
™TradeChartist PowerTracer Pro
™TradeChartist PowerTrader Pro
===================================================================================================================
This is not a free to use indicator. Get in touch with me (PM me directly if you would like trial access to test the indicator)
Premium Scripts - Trial access and Information
Trial access offered on all Premium scripts.
PM me directly to request trial access to the scripts or for more information.
===================================================================================================================
Support/ Resistance with H1 ATR - strategy mainline versionThis script using ATR (average true range) with source hl2 for create Support/ Resistance line
The color meaning:
- Green = Support line
- Red = Resistance line
Signal:
- If close price breakout Resistance line -> LONG signal will been active.
- If close price breakout Support line -> SHORT signal will been active.
Input setting:
Recommended default setting.
- Factor: amplitude for create Support/ Resistance line.
- Length: length of ATR.
- Offset: number of bar for check sideway or choppy market.
- Take profit: if you want test close position by profit.
- Stop loss: should not be missed.
- Open Position with Stop-Market type:
+ Open LONG position with high price and type Stop-Market.
+ Open SHORT position with low price and type Stop-Market.
Strategy setting:
Recommended default setting if you trade on Binance Futures or change Comission if you trade on another exchange.
Best backtest if:
- Max drawdown less than 10%.
- Min backtest time: 6 month.
- Avg profit: 10%/ month when no leverage is used.
Alert version:
1 - Select create new alert
2 - Condition:
+ eb BUY -> LONG signal
+ eb BUY close -> close LONG position
+ eb SELL -> SHORT signal
+ eb SELL close -> close SHORT position
3 - Option: recommended using only. Because the signal will be more accurate if the price close breakout successfully.
+ Always put stop loss position to avoid PUMP/ DUMP market.
// Note: alert version not free, send for me a private message on TradingView to get price and gain access.
Recommended:
- Using in M30, M45, H1 timeframe with default setting.
- Symbol: BTC
- Exchange: Binance Futures
- Order size: 10% wallet balance, maximum 25% wallet balance.
- Leverage: X2-X5, maximum X10.
---> I using 10% wallet balance and X2 only.

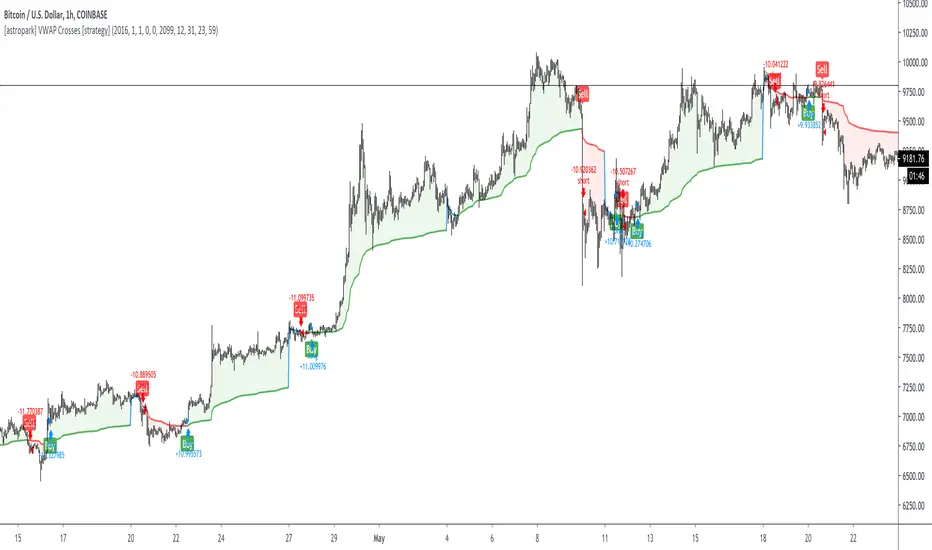
[astropark] VWAP Crosses [strategy]Dear Followers,
today a new Swing and Scalping Strategy based on WVAP , mainly designed for Bitcoin and High-Cap Cryptocurrencies, like Ethereum. It works also on Forex and Stocks.
It works great since 15m and above till 1D. I suggest you to use it on 15m, 30m or 1h timeframes .
VWAP or "Volume Weighted Average Price" is a volume-based indicator similar to a moving average.
This trading indicator is used to identify market resistance and support levels and is represented as a weighted average price for the treaded volumes.
My strategy will help you identify main support-resistance level to be careful of and it will trigger a buy or a sell depending on how price will intereact with vwaps.
green means we are in a bullish trend, in fact it start with a "buy" signal
red means we are in a bearish trend, in fact it start with a "sell" signal
blue means we are in a moment where trend may change, so be careful and always remember that taking profits is awesome and have a stoploss is a must in trading
The user who wants to use this strategy, especially via an automated bot, must always set a stoploss (example 150$ from entry on bitcoin) or use a proper risk management strategy .
This is not the "Holy Grail", so use it with caution. It's highly suggested to use a proper money management .
This script will let you backtest this script and check profitability on your preferred market.
The alarms version of this indicator, which will let you set all notifications you may need in order to be alerted on each triggered signals, can be found by searching for astropark "VWAP Crosses"
This is a premium indicator , so send me a private message in order to get access to this script.