Trend MatrixFinal TradingView-Compliant Description for Trend Matrix
Trend Matrix is a precision-engineered trend-following strategy built for high-confidence entries and tactical trade management.
This strategy combines multiple non-repainting filters, each with a distinct role, to form a unified "trend matrix" that confirms directional bias, volume commitment, and momentum strength — all before entry is considered.
🔍 Core Components & Why They’re Used
🧠 Gaussian Filter (Custom)
A smoothed Gaussian-weighted moving average is used to detect trend direction changes. Unlike standard EMAs, this filter minimizes lag while retaining smooth transitions — ideal for confirming trend shifts without false reversals.
📈 RMI Trend Memory
A Relative Momentum Index is used to validate trend direction persistence. RMI's ability to filter out short-term oscillations makes it ideal for confirming whether a trend is still active.
📊 Gradient Filter (ZLEMA-based)
Measures the slope of a ZLEMA-smoothed close. If slope flips, it signals a potential trend weakness. This provides real-time confirmation for entry or exit bias.
📉 Volume Spike Detection
Confirms that breakouts or trend continuations are supported by volume commitment. Uses a dynamic SMA-based volume filter with a user-defined multiplier.
🟦 White Line (Bias Midpoint)
This structural component calculates the midpoint of the highest high and lowest low over a range — providing directional context and helping eliminate trades in consolidation zones.
🎯 Entry Conditions
Long entries require:
Gaussian trend flip to the upside
RMI > 50 (bullish memory)
Volume spike confirmation
Positive gradient (ZLEMA slope)
Price above White Line (bias filter)
Short entries use the inverse logic.
All entries enforce a cooldown bar to prevent same-bar reversals or whipsaw trades.
🎯 Exit Conditions
Take Profit 1: 50% of position at +2%
Take Profit 2: Remaining 50% at +4%
Early Exit on Trend Weakness:
Position closes fully if the trend weakens (RMI flip or gradient reversal)
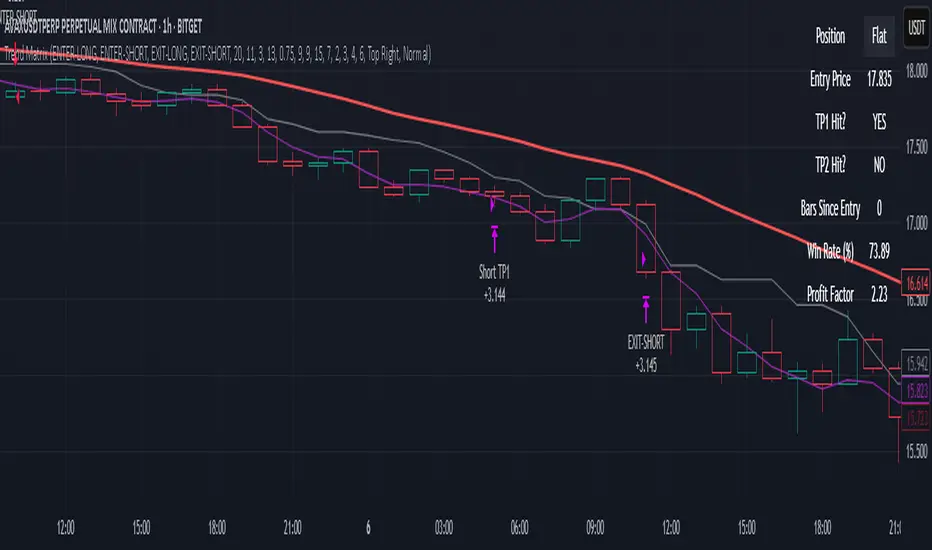
📊 Dashboard + Performance Tracking
The built-in dashboard shows:
Current Position
Entry Price
TP1/TP2 Hit Status
Bars Since Entry
Win Rate (%)
Profit Factor
Useful for manual tracking or live trading review.
🌐 Multi-Exchange Bot Compatibility
Trend Matrix is built with universal trade alerts using customizable comment= fields. This makes it compatible with any exchange-connected bot platform such as:
WunderTrading
3Commas
Alertatron
Cornix
Or any webhook-based trading system
Alerts are sent using the {{strategy.order.comment}} placeholder, allowing you to route entries and exits through your preferred exchange account on Binance, Bybit, OKX, Kraken, and others.
🛠️ Customization
All components are modular:
TP1/TP2 levels
Gaussian length & sigma
Volume spike filter sensitivity
Gradient & White Line length
RMI settings
You can tailor the strategy for different assets or timeframes — optimized for crypto 1H, but works with stocks, FX, or lower timeframes with adjusted parameters.
✅ Final Notes
Trend Matrix is not just a mashup — it's a synchronized system of filters with clear roles, designed to maximize trade confidence and minimize noise. Every layer of confirmation serves a purpose, making this a highly adaptive trend-following tool for any market environment.
⚠️ Disclaimer (as required by TradingView)
This script is for educational purposes only and does not constitute financial advice. Use at your own risk. Always test strategies thoroughly before applying them in live trading environments. Past performance is not indicative of future results.
在脚本中搜索"alert"
PowerZone Trading StrategyExplanation of the PowerZone Trading Strategy for Your Users
The PowerZone Trading Strategy is an automated trading strategy that detects strong price movements (called "PowerZones") and generates signals to enter a long (buy) or short (sell) position, complete with predefined take profit and stop loss levels. Here’s how it works, step by step:
1. What is a PowerZone?
A "PowerZone" (PZ) is a zone on the chart where the price has shown a significant and consistent movement over a specific number of candles (bars). There are two types:
Bullish PowerZone (Bullish PZ): Occurs when the price rises consistently over several candles after an initial bearish candle.
Bearish PowerZone (Bearish PZ): Occurs when the price falls consistently over several candles after an initial bullish candle.
The code analyzes:
A set number of candles (e.g., 5, adjustable via "Periods").
A minimum percentage move (adjustable via "Min % Move for PowerZone") to qualify as a strong zone.
Whether to use the full candle range (highs and lows) or just open/close prices (toggle with "Use Full Range ").
2. How Does It Detect PowerZones?
Bullish PowerZone:
Looks for an initial bearish candle (close below open).
Checks that the next candles (e.g., 5) are all bullish (close above open).
Ensures the total price movement exceeds the minimum percentage set.
Defines a range: from the high (or open) to the low of the initial candle.
Bearish PowerZone:
Looks for an initial bullish candle (close above open).
Checks that the next candles are all bearish (close below open).
Ensures the total price movement exceeds the minimum percentage.
Defines a range: from the high to the low (or close) of the initial candle.
These zones are drawn on the chart with lines: green or white for bullish, red or blue for bearish, depending on the color scheme ("DARK" or "BRIGHT").
3. When Does It Enter a Trade?
The strategy waits for a breakout from the PowerZone range to enter a trade:
Buy (Long): When the price breaks above the high of a Bullish PowerZone.
Sell (Short): When the price breaks below the low of a Bearish PowerZone.
The position size is set to 100% of available equity (adjustable in the code).
4. Take Profit and Stop Loss
Take Profit (TP): Calculated as a multiple (adjustable via "Take Profit Factor," default 1.5) of the PowerZone height. For example:
For a buy, TP = Entry price + (PZ height × 1.5).
For a sell, TP = Entry price - (PZ height × 1.5).
Stop Loss (SL): Calculated as a multiple (adjustable via "Stop Loss Factor," default 1.0) of the PZ height, placed below the range for buys or above for sells.
5. Visualization on the Chart
PowerZones are displayed with lines on the chart (you can hide them with "Show Bullish Channel" or "Show Bearish Channel").
An optional info panel ("Show Info Panel") displays key levels: PZ high and low, TP, and SL.
You can also enable brief documentation on the chart ("Show Documentation") explaining the basic rules.
6. Alerts
The code generates automatic alerts in TradingView:
For a bullish breakout: "Bullish PowerZone Breakout - LONG!"
For a bearish breakdown: "Bearish PowerZone Breakdown - SHORT!"
7. Customization
You can tweak:
The number of candles to detect a PZ ("Periods").
The minimum percentage move ("Min % Move").
Whether to use highs/lows or just open/close ("Use Full Range").
The TP and SL factors.
The color scheme and what elements to display on the chart.
Practical Example
Imagine you set "Periods = 5" and "Min % Move = 2%":
An initial bearish candle appears, followed by 5 consecutive bullish candles.
The total move exceeds 2%.
A Bullish PowerZone is drawn with a high and low.
If the price breaks above the high, you enter a long position with a TP 1.5 times the PZ height and an SL equal to the height below.
The system executes the trade and exits automatically at TP or SL.
Conclusion
This strategy is great for capturing strong price movements after consolidation or momentum zones. It’s automated, visual, and customizable, making it useful for both beginner and advanced traders. Try it out and adjust it to fit your trading style!

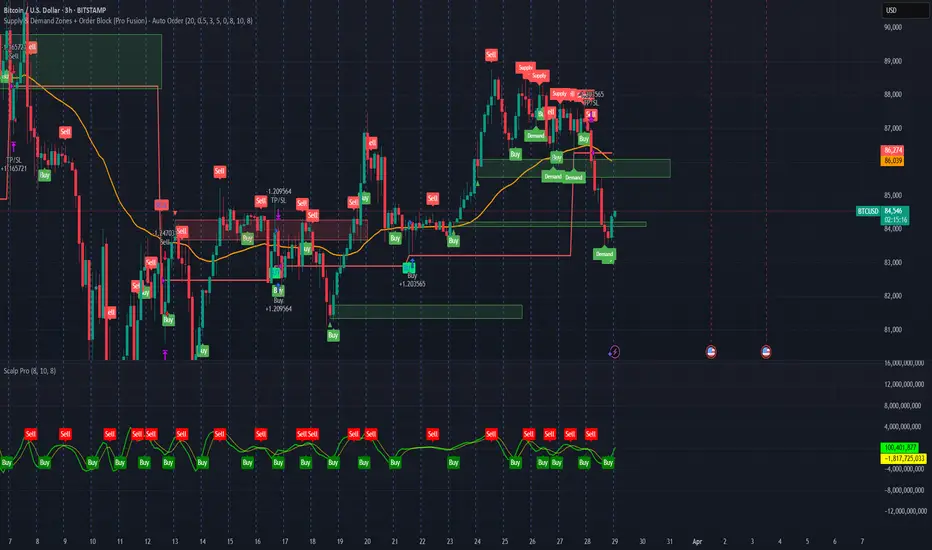
Supply & Demand Zones + Order Block (Pro Fusion) - Auto Order Strategy Title:
Smart Supply & Demand Zones + Order Block Auto Strategy with ScalpPro (Buy-Focused)
📄 Strategy Description:
This strategy combines the power of Supply & Demand Zone analysis, Order Block detection, and an enhanced Scalp Pro momentum filter, specifically designed for automated decision-making based on high-volume breakouts.
✅ Key Features:
Auto Entry (Buy Only) Based on Breakouts
Automatically enters a Buy position when the price breaks out of a valid demand zone, confirmed by EMA 50 trend and volume spike.
Order Block Logic
Identifies bullish and bearish order blocks using consecutive candle structures and significant price movement.
Dynamic Stop Loss & Trailing Stop
Implements a trailing stop once price moves in profit, along with static initial stop loss for risk management.
Clear Visual Labels & Alerts
Displays BUY/SELL, Demand/Supply, and Order Block labels directly on the chart. Alerts trigger on valid breakout signals.
Scalp Pro Momentum Filter (Optimized)
Uses a modified MACD-style momentum indicator to confirm trend strength and filter out weak signals.
Arbitrage Spot-Futures Don++Strategy: Spot-Futures Arbitrage Don++
This strategy has been designed to detect and exploit arbitrage opportunities between the Spot and Futures markets of the same trading pair (e.g. BTC/USDT). The aim is to take advantage of price differences (spreads) between the two markets, while minimizing risk through dynamic position management.
[Operating principle
The strategy is based on calculating the spread between Spot and Futures prices. When this spread exceeds a certain threshold (positive or negative), reverse positions are opened simultaneously on both markets:
- i] Long Spot + Short Futures when the spread is positive.
- i] Short Spot + Long Futures when the spread is negative.
Positions are closed when the spread returns to a value close to zero or after a user-defined maximum duration.
[Strategy strengths
1. Adaptive thresholds :
- Entry/exit thresholds can be dynamic (based on moving averages and standard deviations) or fixed, offering greater flexibility to adapt to market conditions.
2. Robust data management :
- The script checks the validity of data before executing calculations, thus avoiding errors linked to missing or invalid data.
3. Risk limitation :
- A position size based on a percentage of available capital (default 10%) limits exposure.
- A time filter limits the maximum duration of positions to avoid losses due to persistent spreads.
4. Clear visualization :
- Charts include horizontal lines for entry/exit thresholds, as well as visual indicators for spread and Spot/Futures prices.
5. Alerts and logs :
- Alerts are triggered on entries and exits to inform the user in real time.
[Points for improvement or completion
Although this strategy is functional and robust, it still has a few limitations that could be addressed in future versions:
1. [Limited historical data :
- TradingView does not retrieve real-time data for multiple symbols simultaneously. This can limit the accuracy of calculations, especially under conditions of high volatility.
2. [Lack of liquidity management :
- The script does not take into account the volumes available on the order books. In conditions of low liquidity, it may be difficult to execute orders at the desired prices.
3. [Non-dynamic transaction costs :
- Transaction costs (exchange fees, slippage) are set manually. A dynamic integration of these costs via an external API would be more realistic.
4. User-dependency for symbols :
- Users must manually specify Spot and Futures symbols. Automatic symbol validation would be useful to avoid configuration errors.
5. Lack of advanced backtesting :
- Backtesting is based solely on historical data available on TradingView. An implementation with third-party data (via an API) would enable the strategy to be tested under more realistic conditions.
6. [Parameter optimization :
- Certain parameters (such as analysis period or spread thresholds) could be optimized for each specific trading pair.
[How can I contribute?
If you'd like to help improve this strategy, here are a few ideas:
1. Add additional filters:
- For example, a filter based on volume or volatility to avoid false signals.
2. Integrate dynamic costs:
- Use an external API to retrieve actual costs and adjust thresholds accordingly.
3. Improve position management:
- Implement hedging or scalping mechanisms to maximize profits.
4. Test on other pairs:
- Evaluate the strategy's performance on other assets (ETH, SOL, etc.) and adjust parameters accordingly.
5. Publish backtesting results :
- Share detailed analyses of the strategy's performance under different market conditions.
[Conclusion
This Spot-Futures arbitrage strategy is a powerful tool for exploiting price differentials between markets. Although it is already functional, it can still be improved to meet more complex trading scenarios. Feel free to test, modify and share your ideas to make this strategy even more effective!
[Thank you for contributing to this open-source community!
If you have any questions or suggestions, please feel free to comment or contact me directly.

Custom Dual EMA Crossover Strategy with Configurable LogicThis strategy is designed to assist traders in identifying and capitalizing on bullish market trends through a systematic and data-driven approach. It incorporates detailed trend analysis, volatility filtering, and percentage-based thresholds to provide actionable insights and high-confidence trade setups. It leverages the Exponential Moving Average and combines it with custom logic to detect volatility, maximum allowed price movements over last bars and trend confirmation.
Key Features:
- Buy orders follow several conditions, including but not limited to:
a. EMA Crossover: specifically designed to capture immediate market shifts rather than medium- or long-term trends, ensuring responsiveness to rapidly changing conditions but requiring additional confirmations to avoid false signals (see below).
b. Thresholds in Price Changes: Ensures recent price fluctuations remain within specific thresholds, allowing trades to be entered at optimal times and avoiding delayed or unsustainable short-term bullish trends.
c. Adequate Market Volatility: Requires sufficient market activity to avoid false signals stemming from low volatility conditions.
d. Bullish Medium-Term Trend: Validates a bullish medium-term trend using an EMA crossover to avoid trading during bearish market conditions and minimize risk.
- Leverages Take profit and Stop loss levels
- Implements an optional mechanism to automatically close trades after a predefined number of bars, supporting disciplined trade management.
The script does not rely on any public scripts or indicators. Apart the EMA, all the underlying logic, including the volatility thresholds and filtering mechanisms, has been custom developed to ensure originality and precision. The strategy's conditions are all configurable by the user in the TradingView pop-up, allowing it to adapt to different assets and timeframes. For example, users can set the EMA lengths to align with long-term trends for cryptocurrencies or adjust volatility thresholds to account for the specific price movement behavior of stocks or forex pairs.
---
Recommendations:
- Identify a crypto asset with potential
- Before live trading, rigorously backtest your strategy on the chosen asset and interval over a period of at least one year*, analyzing results, refining parameters' value and eventually changing timeframe and / or asset.
- Refine your approach until you achieve consistent profitability with a high win rate. Balance the two — a high win rate is great, but only if your profits outweigh your losses in the long term.
- Once successful, remain disciplined and adhere to the parameters that yield the best results. Set up TradingView alerts to trigger real-time actions via your preferred trading bot. Alerts can be set up on the Indicator, which mirrors the strategy's logic and enables users to execute real-time actions effectively. I will provide you access to the Indicator, as well as the Strategy.
* Alternatively, you can apply the strategy to a shorter period for tactical use. While this approach may increase short-term opportunities (e.g. strong bullish short term movements), it also comes with heightened risks.
Use Cases:
- Suitable for traders focusing on bullish or range-bound markets.
- Ideal for short to medium-term trading horizons.
Access and Configuration Support:
This is an invite-only script. For access, please reach out directly for subscription details. I also provide guidance on configuring the strategy with real-world examples to optimize its use for various assets, intervals and timeframes.
---
Disclaimer:
This script is a tool to support trading decisions and does not guarantee profitability. Past performance does not indicate future results. Trading carries inherent risks; always trade responsibly and manage risk accordingly.

Bullish B's - RSI Divergence StrategyThis indicator strategy is an RSI (Relative Strength Index) divergence trading tool designed to identify high-probability entry and exit points based on trend shifts. It utilizes both regular and hidden RSI divergence patterns to spot potential reversals, with signals for both bullish and bearish conditions.
Key Features
Divergence Detection:
Bullish Divergence: Signals when RSI indicates momentum strengthening at a lower price level, suggesting a reversal to the upside.
Bearish Divergence: Signals when RSI shows weakening momentum at a higher price level, indicating a potential downside reversal.
Hidden Divergences: Looks for hidden bullish and bearish divergences, which signal trend continuation points where price action aligns with the prevailing trend.
Volume-Adjusted Entry Signals:
The strategy enters long trades when RSI shows bullish or hidden bullish divergence, indicating an upward momentum shift.
An optional volume filter ensures that only high-volume, high-conviction trades trigger a signal.
Exit Signals:
Exits long positions when RSI reaches a customizable overbought level, typically indicating a potential reversal or profit-taking opportunity.
Also closes positions if bearish divergence signals appear after a bullish setup, providing protection against trend reversals.
Trailing Stop-Loss:
Uses a trailing stop mechanism based on ATR (Average True Range) or a percentage threshold to lock in profits as the price moves in favor of the trade.
Alerts and Custom Notifications:
Integrated with TradingView alerts to notify the user when entry and exit conditions are met, supporting timely decision-making without constant monitoring.
Customizable Parameters:
Users can adjust the RSI period, pivot lookback range, overbought level, trailing stop type (ATR or percentage), and divergence range to fit their trading style.
Ideal Usage
This strategy is well-suited for trend traders and swing traders looking to capture reversals and trend continuations on medium to long timeframes. The divergence signals, paired with trailing stops and volume validation, make it adaptable for multiple asset classes, including stocks, forex, and crypto.
Summary
With its focus on RSI divergence, trailing stop-loss management, and volume filtering, this strategy aims to identify and capture trend changes with minimized risk. This allows traders to efficiently capture profitable moves and manage open positions with precision.
This Strategy BEST works with GLD!

NNFX RSI EMA FVMA MACD ALGOThis Pine Script introduces a cutting-edge trading strategy that seamlessly integrates multiple technical indicators—namely, the Flexible Variable Moving Average ( FVMA ), Relative Strength Index ( RSI ), Moving Average Convergence Divergence ( MACD ), and Exponential Moving Average ( EMA )—to deliver a sophisticated trading experience. This script stands out due to its comprehensive approach, robust risk management, and the inclusion of crucial data tables for various timeframes, making it an invaluable tool for traders seeking to enhance their market performance.
Originality of the Strategy:
The originality of this script lies in its unique combination of multiple powerful indicators, enabling traders to benefit from diverse perspectives on market dynamics. This mashup enhances decision-making processes, providing multiple layers of confirmation for trade entries and exits. The strategy is designed to offer an innovative solution for traders looking to improve their performance through well-defined rules and a solid framework.
Flexible Variable Moving Average (FVMA):
The FVMA adapts dynamically to market conditions, offering a more responsive trend line than traditional moving averages. This flexibility allows for quick identification of trends and reversals, crucial for fast-paced trading environments.
Exponential Moving Average (EMA):
By giving greater weight to recent price data, the EMA enhances sensitivity to price changes, allowing for more accurate entries and exits when used alongside the FVMA. This combination maximizes the effectiveness of the strategy in identifying optimal trading opportunities.
Relative Strength Index (RSI):
The RSI helps identify overbought or oversold conditions, integrating seamlessly with other indicators to enhance the strategy's ability to pinpoint potential reversal points. This aspect of the strategy ensures that traders can make informed decisions based on market momentum.
Moving Average Convergence Divergence (MACD):
The MACD serves as an essential confirmation tool, providing insights into trend strength and momentum. This enhances the accuracy of entry and exit signals, allowing traders to make more informed decisions based on robust technical analysis.
Multi-Take Profit (TP) and Stop Loss (SL) Levels:
The strategy supports multiple TPs, allowing traders to lock in profits at various levels while effectively managing risk through a robust SL system. This flexibility caters to diverse trading styles and risk profiles, ensuring that the strategy can adapt to individual trader needs.
Default Properties:
Take Profit Levels: TP1 is set to 2.0, and TP2 is set to 2.9, which is designed to enhance profit potential while maintaining a solid risk-reward ratio.
Stop Loss: A SL is set at 2% of the 5% account balance, which helps to preserve capital and manage risk effectively, adhering to the guideline of not risking more than 5-10% of the account balance per trade.
Labeling System for Exits: Automatic labeling of TP and SL exits on the chart provides clear visualization of trading outcomes. This feature supports informed decision-making and performance tracking, aligning with the guideline of providing transparent results.
Custom Alerts System:
The inclusion of customizable alerts for trade entries, exits, and SL/TP hits keeps traders informed in real-time, enabling prompt actions without constant market monitoring. This is crucial for effective trade management and helps traders respond quickly to market changes.
API Boxes for Automated Trading:
The strategy features API boxes, allowing traders to set up automated trading based on indicator signals. This functionality enables seamless integration with trading platforms, enhancing efficiency and streamlining the trading process, which is particularly valuable for traders looking to optimize their execution.
Data Tables for Enhanced Analysis:
The script includes data tables displaying critical insights across various timeframes: 2-hour, daily, weekly, and monthly. These tables provide a comprehensive overview of market conditions, allowing traders to analyze trends and make informed decisions based on a broad spectrum of data. By leveraging this information, traders can identify high-probability setups and align their strategies with prevailing market trends, significantly increasing their chances of success.
Default Properties:
Initial Capital: £1,000, ensuring a realistic starting point for traders.
Risk per Trade: 5% of the account balance, promoting sustainable trading practices.
Commission: 0.1%, reflecting realistic transaction costs that traders may encounter.
Slippage: 1%, accounting for potential market volatility during trade execution.
Take Profit Levels:
TP1: 2.0
TP2: 2.9
Stop Loss (SL): 2% of the 5% account balance, which is well within acceptable risk parameters.
Compliance with TradingView Guidelines:
This script fully complies with TradingView's guidelines, specifically:
Strategy Results:
The strategy is designed to publish backtesting results that do not mislead traders. The realistic parameters outlined in the default properties ensure that traders have a clear understanding of potential outcomes.
The dataset used for backtesting has sufficient trades to produce a reliable sample size, aligning with the guideline of ideally having more than 100 trades.
Any deviations from recommended practices are justified in the script description, ensuring transparency and adherence to best practices.
The script explains the default properties in detail, providing a thorough understanding of how these settings influence performance.
Why This Script is Worth Paying For:
This Pine Script offers an unparalleled trading experience through its unique combination of technical indicators, comprehensive trade management features, and detailed data tables for multiple timeframes. Here are compelling reasons to invest in this strategy:
Holistic Approach: The integration of multiple indicators ensures a well-rounded perspective on market conditions, increasing the likelihood of successful trades.
Advanced Risk Management: The flexibility of multiple TPs and SLs empowers traders to tailor their risk profiles according to individual strategies, enhancing overall profitability.
Automated Trading Capability: The inclusion of API boxes for automated trading streamlines execution, allowing traders to capitalize on opportunities without the need for manual intervention.
Comprehensive Data Analysis: The detailed data tables provide invaluable insights across different timeframes, enabling traders to make informed decisions based on robust market analysis.
In summary, this innovative Pine Script represents a powerful tool designed to empower traders at all levels. Its originality, synergistic functionality, and comprehensive features create a dynamic and effective trading environment, justifying its value and positioning it as a must-have for anyone serious about achieving consistent trading success.

Simple Fibonacci Retracement Strategy This strategy uses Fibonacci retracement to identify key levels in the market and helps traders find good entry and exit points. By understanding and using this strategy, traders can improve their trading decisions and increase their chances of success in the market.
This strategy, called the "Simple Fibonacci Retracement Strategy," is designed to help traders identify potential entry and exit points in the market based on Fibonacci retracement levels. The code is written in Pine Script and runs on the TradingView platform.
Overall Function
The strategy uses Fibonacci retracement levels to identify potential support and resistance levels in the market. This helps traders find good entry and exit points for trades, as well as set stop-loss and take-profit levels to minimize risk and maximize gains.
Main Components of the Code
1. Input Parameters
Lookback Period: The number of bars used to identify the highest high and lowest low.
Fibonacci Direction: The choice of whether Fibonacci levels are calculated from top to bottom or bottom to top.
Fibonacci Levels: Specific Fibonacci levels (23.6%, 38.2%, 50%, 61.8%) used to identify important price levels.
Take Profit and Stop Loss: The number of pips used to set take profit and stop loss levels.
2. Identification of Highest and Lowest Points
The code uses the lookback period to find the highest high (highestHigh) and the lowest low (lowestLow). These levels form the basis for calculating the Fibonacci levels.
3. Calculation of Fibonacci Levels
Based on the direction chosen by the user, the code calculates the various Fibonacci levels (0%, 23.6%, 38.2%, 50%, 61.8%, 100%).
4. Trading Logic
Long Signal: Generated when the price crosses above the 61.8% Fibonacci level from bottom to top.
Short Signal: Generated when the price crosses below the 38.2% Fibonacci level from top to bottom.
When a long or short signal is generated, the strategy opens a position and sets take profit and stop loss levels based on the input parameters.
5. Visualization
The strategy plots the Fibonacci levels on the chart to provide a visual representation of the calculated levels. This helps traders see where the levels are in relation to the current price.
6. Alerts
The code also has functionality to create alerts (commented out), which can notify traders of buy or sell signals.
How to Use the Strategy
Configure Parameters: Adjust the lookback period, Fibonacci direction, and levels for take profit and stop loss to your preferences.
View the Chart: The Fibonacci levels will be plotted on the chart, providing a visual overview of potential support and resistance levels.
Trade Signals: Follow the generated buy and sell signals. Set your parameters in settings and adjust according to the generated buy and sell signals in the strategy tester. The strategy will automatically set your take profit and stop loss levels.
Evaluation and Adjustment: Monitor the performance of the strategy and make adjustments as needed to optimize the results.
Norwegian
Denne strategien, kalt "Simple Fibonacci Retracement Strategy", er designet for å hjelpe tradere med å identifisere mulige inngangs- og utgangspunkter i markedet basert på Fibonacci-retracementnivåer. Koden er skrevet i Pine Script og kjøres på TradingView-plattformen.
Overordnet Funksjon
Strategien bruker Fibonacci-retracementnivåer for å identifisere potensielle støtte- og motstandsnivåer i markedet. Dette hjelper tradere med å finne gode inngangs- og utgangspunkter for handler, samt å sette stop-loss og take-profit nivåer for å minimere risiko og maksimere gevinster.
Hovedkomponenter i Koden
1. Input Parametere
Lookback Period: Antall barer som brukes til å identifisere høyeste høydepunkt og laveste lavpunkt.
Fibonacci Direction: Valg om Fibonacci-nivåene skal beregnes fra topp til bunn eller bunn til topp.
Fibonacci Levels: Spesifikke Fibonacci-nivåer (23.6%, 38.2%, 50%, 61.8%) som brukes til å identifisere viktige prisnivåer.
Take Profit og Stop Loss: Antall pips som brukes til å sette take profit og stop loss nivåer.
2. Identifikasjon av Høyeste og Laveste Punkt
Koden bruker lookback perioden for å finne det høyeste høydepunktet (highestHigh) og det laveste lavpunktet (lowestLow). Disse nivåene er grunnlaget for å beregne Fibonacci-nivåene.
3. Beregning av Fibonacci-nivåer
Basert på retningen valgt av brukeren, beregner koden de forskjellige Fibonacci-nivåene (0%, 23.6%, 38.2%, 50%, 61.8%, 100%).
4. Handelslogikk
Long Signal: Genereres når prisen krysser over 61.8% Fibonacci-nivået fra bunn til topp.
Short Signal: Genereres når prisen krysser under 38.2% Fibonacci-nivået fra topp til bunn.
Når et long eller short signal genereres, åpner strategien en posisjon og setter take profit og stop loss nivåer basert på inputparametrene.
5. Visualisering
Strategien plottet Fibonacci-nivåene på chartet for å gi en visuell representasjon av de beregnede nivåene. Dette hjelper tradere med å se hvor nivåene er i forhold til den nåværende prisen.
6. Varsler
Koden har også funksjonalitet for å lage varsler (kommentert ut), som kan varsle tradere om kjøps- eller salgssignaler.
Slik Bruker Du Strategien
Konfigurer Parametere: Juster lookback perioden, Fibonacci-retningen, og nivåene for take profit og stop loss til dine preferanser.
Se på Chartet: Fibonacci-nivåene vil bli plottet på chartet, noe som gir deg en visuell oversikt over potensielle støtte- og motstandsnivåer.
Handle Signaler: Sett dine parametere i innstillinger og juster etter genererte kjøps- og salgssignalene i strategy testeren. Strategien vil automatisk sette dine take profit og stop loss nivåer.
Evaluering og Justering: Overvåk ytelsen til strategien og gjør justeringer etter behov for å optimalisere resultatene.

Pullback_Power [JackTz]Welcome to Pullback_Power
Pullback_Power is a scalping strategy designed to capitalize on market retracements while incorporating unique dynamic features to enhance profitability.
Calculation
Pullback_Power purely uses moving averages to calculate both entry and exits. Exits can also be set to fixed percentages for both take profit and stop loss.
How the Strategy Works
Statistics show that markets normally do a recovery after each drop. Crypto markets can easily drop up to 20% within a few hours and then do a complete or partial recovery. Pullback_Power utilizes this known pattern alongside pyramiding. The strategy aims to catch one or more entries when the price drops, hoping to make profits when the market recovers from the drop. The fixed take profit and stop loss can be used to define your risk management, while the dynamic exit opportunity is riskier but provides the ability to stay in the trade longer while it recovers. Pullback_Power can make up to four entries. This means it utilizes pyramiding to spread out the entry points, but every exit is a full exit. It is not possible to partially exit.
Utility
Pullback_Power is a scalping strategy suitable for traders who operate with small trades and don't want to stay in the market for too long. Pullback_Power offers precise signals with no repainting. The strategy thrives in volatility, so crypto pairs might yield the best results, although this strategy can be adapted to work on all pairs and markets.
How to Automate It
Pullback_Power utilizes the standard placeholders of strategies on TradingView. This enables the trader to add every data point into a webhook, making it fully flexible to suit every trader's needs. To automate, create an alert, set the webhook URL, and add the JSON body needed for the webhook. An example of a simple JSON webhook with some of the standard strategy placeholders:
{
"side": "{{strategy.order.action}}",
"symbol": "{{ticker}}",
"amount": "{{strategy.order.contracts}}"
}
Read about all the standard placeholders that you can use here: TradingView - Standard strategy placeholders
Originality
Pullback_Power is unique in its ability to create precise signals without repainting while maintaining a solid approach to the pullback strategy. Its simplicity not only makes the strategy easy to use and understand but also highly effective. The simplicity reduces inputs, eliminating overfitting and limits each input to avoid incorrect usage. Many times, default settings are enough to achieve good backtesting results on almost all pairs available. Pullback_Power also differs from many other strategies by its solid code, which enhances performance and provides more reliable backtesting. The clean code increases the resilience and precision of the entries, making it less prone to errors.
Many pullback/scalping strategies normally only works on specific scopes of timeframes or pairs. Pullback_Power can easily be adapted to work on almost every scenario. The biggest change needed is the length of the moving average. The lower the timeframe, the higher a length is needed for proper results. I.e. on a 2H timeframe a length of 3 can yield good results. On a 5min timeframe the length might need to be as high as 70.
How to Use
To use Pullback_Power, add the script to your trading chart. By default, Pullback_Power opens four orders to optimize trade opportunities with a default fee value set at 0.1%. You can change these default settings in the Settings window under the Properties tab. To tailor Pullback_Power to your individual trading style, navigate to the Settings under the Input tab. Here you can configure various inputs to fit your trading style.
- Backtest settings , Start Date:
Defines the date of when the calculation starts. Use this to set the date of when the first trade could potentially emit.
- Backtest settings , End Date:
Defines the date of when the calculation ends. If there are any open trades after this date the close calculations are still live. It only makes sure that new orders cannot be opened after this date.
- Backtest settings , Only trade on weekdays:
This is a toggle you can enable or disable. If enabled it only allows new entries to happen during the normal week days, meaning Monday, Tuesday, Wednesday, Thursday and Friday.
Disable this to enable the script to open trades on all 7 days of the week.
- Open settings , Use dynamic long positions:
This toggle allows you to enable or disable the pullback level calculations after first trade.
If enabled, the calculations of level 2, 3 and 4 continues to happen after each bar, making the levels follow the price with the moving averages calculations.
If disabled, the calculations of the levels stop after the first trade. This means that the levels calculation at the point of the first trade stay fixed until all trades are closed.
You can see the difference of the green lines on the chart when you toggle this flag.
- Open settings , Data type:
This is the bar data used for the moving average calculation when opening trades. The possible data types are Open, High, Low, Close, HL2, HLC3, OHLC4, OC2 and HC2.
- Open settings , Source type:
This is the source used to calculate the moving average. The types available are: SMA, PCMA, EMA, WMA, DEMA, ZLEMA and HMA.
- Open settings , Length:
This is the length used for the moving average calculations. 3 means it takes the last 3 bars of historical data for the calculation.
- Open settings , Offset:
This defines if the calculation should use an offset for the historical data. This does not use a look-forward feature, but a look-backward feature. To prevent any possible repaints the offset can only be positive, not negative.
For instance, if the length is 3 and the offset is 0 the calculation is made from the last 3 bars, making it bar1, bar2 and bar3. If the length is 3 and the offset is 1 the calculation is made from bar2, bar3, and bar4 – offsetting the calculation by 1 bar.
- Leverage settings , Leverage liquidation (1-125):
The script itself does not handle any custom leverage calculation – this must be done in the Properties tabs and increasing the order size.
This setting is made to test a possible liquidation event if using leverage.
By setting this to higher than 1, a red line is visible after the first trade on the chart. This indicates the liquidation price.
If this setting is set to 25, the script will calculate the liquidation price from a x25 leverage. If this price is hit, the scripts stops emitting any orders and the background turns red.
You can use this to test if your settings could handle a certain level of leverage.
- Pullback settings , Pullback 1, 2, 3 and 4:
Each of these settings defines the entry price of each pullback level. If Pullback 1 is set to -6 it means that the moving average calculation should be 6% lower than the actual price.
The same logic applies to Pullback 2, 3 and 4.
Setting any level to 0 will disable the level – eliminating any orders to emit on that level.
This can be used to change the level of pyramiding down from 4 if needed.
If you do this, remember to also change the order size and the pyramiding value in the Properties tab accordingly.
- Close settings , Use dynamic TP and SL:
If enabled, script will exit all orders using the same but separate algorithm for moving averages. This enables the user to define if you want the orders to be closed if the price level of this moving average is hit. The price level for this calculation is visible on the chart by the blue line.
Although you can change the length and offset, as described underneath, this calculation uses the same data and source type defined in the Open settings area.
- Close settings , Length, Close:
This is the length used for the closing moving average calculations. 3 means it takes the last 3 bars of historical data for the calculation.
- Close settings , Offset, Close:
This defines if the calculation for the closing moving average should use an offset for the historical data. Just as the offset used for opening order, this does not use a look-forward feature, but a look-backward feature. To prevent any possible repaints the offset can only be positive, not negative.
For instance, if the length is 3 and the offset is 0 the calculation is made from the last 3 bars, making it bar1, bar2 and bar3. If the length is 3 and the offset is 1 the calculation is made from bar2, bar3, and bar4 – offsetting the calculation by 1 bar.
- Close settings , Use TakeProfit:
This toggle enables/disables a fixed take profit percentage.
- Close settings , TP %:
This sets the wanted % to reach on a take profit. This setting is ignored if the toggle above is disabled.
- Close settings , Use StopLoss:
This toggle enables/disables a fixed stop loss percentage.
- Close settings , SL %:
This sets the wanted % to reach on a stop loss. This setting is ignored if the toggle above is disabled.
Exit on Same Bar as Entry
By default, the script doesn't emit any exit orders on the same bar as the first entry order. Enable "Recalculation: After order is filled" to change this behavior.
Troubleshooting
While Pullback_Power is designed to provide reliable trading signals, you may encounter rare issues. One such issue could be receiving an error message stating "can't open orders with 0 or negative qty." If you encounter this error, it is likely due to specific conditions on the selected timeframe. To resolve this issue, change the timeframe on your trading chart.
Underlying Principles and Value Proposition
Pullback_Power leverages moving averages and volatility behavior to identify market retracements and capitalize on them. The strategy is rooted in the understanding that markets often experience temporary reversals or "pullbacks" before resuming their primary trend. By identifying these pullbacks and entering trades at opportune moments, Pullback_Power aims to capture quick profits from short-term market movements.
The dynamic and fixed calculations of Take Profit (TP) and Stop Loss (SL) levels enhances risk management, ensuring that potential losses are controlled while allowing room for profits to grow. The adaptive approach using the moving averages considers current market conditions, making the strategy flexible and responsive to changing volatility.
Moreover, Pullback_Power's non-repainting nature ensures the reliability of its signals, eliminating hindsight bias and providing traders with actionable insights based on real-time market data.
The strategy's simplicity and effectiveness make it accessible for traders of all experience levels. Whether you're a beginner looking to start scalping or an experienced trader seeking to diversify your trading approach, Pullback_Power offers a balanced blend of simplicity and sophistication to help you navigate the markets with confidence.
By focusing on clear, transparent principles and offering practical tools for risk management, Pullback_Power aims to provide tangible value to traders, empowering them to make informed decisions and optimize their trading outcomes.
Thank you for choosing Pullback_Power. I wish you successful trading!

Crypto Punk [Bot] (Zeiierman)█ Overview
The Crypto Punk (Zeiierman) is a trading strategy designed for the dynamic and volatile cryptocurrency market. It utilizes algorithms that incorporate price action analysis and principles inspired by Geometric Brownian Motion (GBM). The bot's core functionality revolves around analyzing differences in high and low prices over various timeframes, estimating drift (trend) and volatility, and applying this information to generate trading signals.
█ How to use the Crypto Punk Bot
Utilize the Crypto Punk Bot as a technical analysis tool to enhance your trading strategy. The signals generated by the bot can serve as a confirmation of your existing approach to entering and exiting the market. Additionally, the backtest report provided by the bot is a valuable resource for identifying the optimal settings for the specific market and timeframe you are trading in.
One method is to use the bot's signals to confirm entry points around key support and resistance levels.
█ Key Features
Let's explain how the core features work in the strategy.
⚪ Strategy Filter
The strategy filter plays a vital role in the entries and exits. By setting this filter, the bot can identify higher or lower price points at which to execute trades. Opting for higher values will make the bot target more long-term extreme points, resulting in fewer but potentially more significant signals. Conversely, lower values focus on short-term extreme points, offering more frequent signals focusing on immediate market movements.
How is it calculated?
This filter identifies significant price points within a specified dynamic range by applying linear regression to the absolute deviation of the range, smoothing out fluctuations, and determining the trend direction. The algorithm then normalizes the data and searches for extreme points.
⚪ External AI filter
The external AI filter allows traders to incorporate two external sources as signal filters. This feature is particularly useful for refining their signal accuracy with additional data inputs.
External sources can include any indicator applied to your TradingView chart that produces a plot as an output, such as a moving average, RSI, supertrend, MACD, etc. Traders can use these indicators of their choice to set filters for screening signals within the strategy.
This approach offers traders increased flexibility to select filters that align with their trading style. For instance, one trader might prefer to take trades when the price is above a moving average, while another might opt for trades when the MACD is below the MACD signal line. These external filters enable traders to choose options that best fit their trading strategies. See the example below. Note that the input sources for the External AI filter can be any indicator applied to the chart, and the input source per se does not make this strategy unique. The AI filter takes the selected input source and applies our function to it. So, if a trader selects RSI as an input filter, RSI is not unique, but how the source is computed within the AI functions is.
How is it calculated?
Once the external filters are selected and enabled within the settings panel, our AI function is applied to enhance the filter's ability to execute trades, even when the set conditions of the filter are not met. For instance, if a trader wants to take trades only when the price is above a moving average, the AI filter can actually execute trades even if the price is below the moving average.
The filter works by combining k-nearest Neighbors (KNN) with Geometric Brownian Motion (GBM) involves first using GBM to model the historical price trends of an asset, identifying patterns of drift and volatility. KNN is then applied to compare the current market conditions with historical instances, identifying the closest matches based on similar market behaviors. By examining the drift values of these nearest historical neighbors, KNN predicts the current trend's direction.
The AI adaptability value is a setting that determines how flexible the AI algorithm is when applying the external AI filter. Setting the adaptability to 10 indicates minimal adaptability, suggesting that the bot will strictly adhere to the set filter criteria. On the other hand, a higher adaptability value grants the algorithm more leeway to "think outside the box," allowing it to consider signals that may not strictly meet the filter criteria but are deemed viable trading opportunities by the AI.
█ Examples
In this example, the RSI is used to filter out signals when the RSI is below the smoothing line, indicating that prices are declining.
Note that the external filter is specifically designed to work with either 'LONG ONLY' or 'SHORT ONLY' modes; it does not apply when the bot is set to trade on 'BOTH' modes. For 'LONG ONLY' positions, the filter criteria are met when source 1 is greater than source 2 (source 1 >= source 2). Conversely, for 'SHORT ONLY' positions, the filter criteria require source 1 to be less than source 2 (source 1 <= source 2).
Examples of Filter Usage:
Long Signals: To receive long signals when the closing price is higher than a moving average, set Source 1 to the 'close' price and Source 2 to a moving average value. This setup ensures that signals are generated only when the closing price exceeds the moving average, indicating a potential upward trend.
█ Settings
⚪ Set Timeframe
Choosing the correct entry and exit timeframes is crucial for the bot's performance. The general guideline is to select a timeframe that is higher than the one currently displayed on the trading chart but still relatively close in duration. For instance, if trading on a 1-minute chart, setting the bot's Timeframe to 5 minutes is advisable.
⚪ Entry
Traders have the flexibility to configure the bot according to their trading strategy, allowing them to choose whether the bot should engage in long positions only, short positions only or both. This customization ensures that the bot aligns with the trader's market outlook and risk tolerance.
⚪ Pyramiding
Pyramiding functionality is available to enhance the bot's trading strategy. If the current position experiences a drawdown by a specified number of points, the bot is programmed to add new positions to the existing one, potentially capitalizing on lower prices to average down the entry cost. To utilize this feature, access the settings panel, navigate to 'Properties,' and look for 'Pyramiding' to specify the number of times the bot can re-enter the market (e.g., setting it to 2 allows for two additional entries).
⚪ Risk Management
The bot incorporates several risk management methods, including a regular stop loss, trailing stop, and risk-reward-based stop loss and exit strategies. These features assist traders in managing their risk.
Stop Loss
Trailing Stop
⚪ Trading on specific days
This feature allows trading on specific days by setting which days of the week the bot can execute trades on. It enables traders to tailor their strategies according to market behavior on particular days.
⚪ Alerts
Alerts can be set for entry, exit, and risk management. This feature allows traders to automate their trading strategy, ensuring timely actions are taken according to predefined criteria.
█ How is Crypto Punk calculated?
The Crypto Punk Bot is a trading bot that utilizes a combination of price action analysis and elements inspired by Geometric Brownian Motion (GBM) to generate buy and sell signals for cryptocurrencies. The bot focuses on analyzing the difference between high and low prices over various timeframes, alongside estimates of drift (trend) and volatility derived from GBM principles.
Timeframe Analysis for Price Action
The bot examines multiple timeframes (e.g., daily, weekly) to identify the range between the highest and lowest prices within each period. This range analysis helps in understanding market volatility and the potential for significant price movements. The algorithm calculates the trading range by applying maximum and minimum functions to the set of prices over your selected timeframe. It then subtracts these values to determine the range's width. This method offers a quantitative measure of the asset's price volatility for the specified period.
Estimating Drift (Trend)
The bot estimates the drift component, which reflects the underlying trend or expected return of the cryptocurrency. The algorithm does this by estimating the drift (trend) using Geometric Brownian Motion (GBM), which involves determining an asset's average rate of return over time, reflecting the asset's expected direction of movement.
Estimating Volatility
Volatility is estimated by calculating the standard deviation of the logarithmic returns of the cryptocurrency's price over the same timeframe used for the drift calculation. Geometric Brownian Motion (GBM) involves measuring the extent of variation or dispersion in the returns of an asset over time. In the context of GBM, volatility quantifies the degree to which the price of an asset is expected to fluctuate around its drift.
Combining Drift and Volatility for Signal Generation
The bot uses the calculated drift and volatility to understand the current market conditions. A higher drift coupled with manageable volatility may indicate a strong upward trend, suggesting a potential buy signal. Conversely, a low or negative drift with increasing volatility might suggest a weakening market, triggering a sell signal.
█ Strategy Properties
This script backtest is done on the 1 hour chart Bitcoin, using the following backtesting properties:
Balance (default): 10 000 (default base currency)
Order Size: 10% of the equity
Commission: 0.05 %
Slippage: 500 ticks
Stop Loss: Risk Reward set to 1
These parameters are set to provide an accurate representation of the backtesting environment. It's important to recognize that default settings may vary for several reasons outlined below:
Order Size: The standard is set at one contract to facilitate compatibility with a wide range of instruments, including futures.
Commission: This fee is subject to fluctuation based on the specific market and financial instrument, and as such, there isn't a standard rate that will consistently yield accurate outcomes.
We advise users to customize the Script Properties in the strategy settings to match their personal trading accounts and preferred platforms. This adjustment is crucial for obtaining practical insights from the deployed strategies.
-----------------
Disclaimer
The information contained in my Scripts/Indicators/Ideas/Algos/Systems does not constitute financial advice or a solicitation to buy or sell any securities of any type. I will not accept liability for any loss or damage, including without limitation any loss of profit, which may arise directly or indirectly from the use of or reliance on such information.
All investments involve risk, and the past performance of a security, industry, sector, market, financial product, trading strategy, backtest, or individual's trading does not guarantee future results or returns. Investors are fully responsible for any investment decisions they make. Such decisions should be based solely on an evaluation of their financial circumstances, investment objectives, risk tolerance, and liquidity needs.
My Scripts/Indicators/Ideas/Algos/Systems are only for educational purposes!
付费脚本

Price Action Pattern Breakout Strategy: Wedge,Triangle,ChannelIntroducing the Price Action Pattern Breakout Strategy: Wedge,Triangle,Channel 💹🚀
The "Price Action Pattern Breakout Strategy: Wedge, Triangle, Channel" is a dynamic and automated trading strategy that excels in recognizing and capitalizing on breakout opportunities within the realm of powerful price action patterns. It is finely tuned to achieve exceptional precision in detecting three distinct pattern types: Wedge, Triangle, and Channel. This diversity equips you to confidently navigate a wide range of market scenarios and opportunities.
This strategy automates trade entries and exits upon confirmed pattern breakouts, this eliminates human errors in correctly recognizing patterns and prevents emotional decisions. This strategy is designed to work across different time frames, making it suitable for both short-term and long-term traders. Whether you're a day trader, swing trader, or investor, this strategy provides the flexibility you need to thrive in diverse market conditions.
💎 How it Works:
▶️ In this strategy, three price action patterns have been utilized, one of which is the "Wedge" pattern. The Wedge pattern has consistently demonstrated a high level of credibility, typically resulting in sharp and rapid price movements following a confirmed breakout from this pattern. This characteristic makes the Wedge pattern highly noteworthy in our strategy. The second pattern is the "Triangle" pattern, which, depending on its formation, whether ascending or descending, can indicate a strong continuation or reversal of the trend. The last pattern is the "Channel" pattern. The reason for using the Channel pattern is its versatility in various market conditions and its tendency to produce reliable results.
In the snapshot below, you can observe the types of patterns that this strategy is capable of identifying at a glance:
▶️ This strategy employs two types of targeting systems: Fixed Targets and Trailing Targets.
Fixed Targets is the default targeting system of the strategy, incorporating two primary targets: TP1 (Target Point 1) and TP2 (Target Point 2). These targets are thoughtfully adjusted in alignment with specific rules for each pattern. With Fixed Targets, you have the flexibility to designate the position size percentage for your exits at TP1 and TP2. For instance, should you opt to allocate 60% of your position size to TP1, as soon as the price triggers the first take profit level, 60% of your initial position is gracefully closed, leaving the remaining 40% to exit the trade upon reaching TP2.
Trailing Targets represent the strategy's alternative targeting system. With this system, the trailing stop becomes active once the price reaches the specified trigger point. The strategy then exits the trade based on the defined offset percentage and price retracement from the trailing limit.
▶️ This strategy relies on a single type of stop loss, determined by previous pivot points and adjusted based on the trade's direction, whether long or short, placing the stop loss above or below the prior pivot. This stop loss approach has demonstrated reliability when used alongside price action patterns.
In addition to this fixed stop loss, you can specify a percentage buffer, offering protection against potential stop hunting due to market fluctuations. This buffer helps protect your positions from sudden price swings. For example, selecting a 1% buffer means your stop loss will be positioned 1% higher or lower concerning the last pivot, depending on your trade's direction. This added layer of security ensures your trades remain resilient and less vulnerable to market volatility.
▶️ A practical feature of this strategy is the "Risk-Free" option. Once activated, it continuously monitors price movements, and as soon as the price progresses in the trade's direction and surpasses the designated Risk-Free Trigger Point in percentage, the stop loss is dynamically shifted from its initial position to the entry price, effectively making the trade "risk-free." This means that if the trade doesn't go as expected, we exit at the entry point, incurring neither profit nor loss from the trade.
Additionally, you have the flexibility to fine-tune the modified stop loss, positioning it slightly above or below the entry price through the configuration of a specified percentage. This allows for effective consideration of commission fees in your trading strategy.
▶️ Risk management is a crucial concept in trading, playing a significant role in a trader's long-term success. This strategy introduces a unique feature called "Fixed Loss Position Sizing", where upon activation, you can limit the risk exposure to a specified percentage of your capital per trade. Set your preferred risk percentage along with the intended leverage. The strategy independently considers your available capital and designated leverage, determining the position size before executing any trade.
In the case of a stop loss, your loss is limited to the specified risk percentage. For instance, with a $1000 account and a 1% risk set, the strategy adjusts each trade's size to ensure a maximum loss of $10 if the stop loss is triggered. Enabling this feature will ensure disciplined risk management, aligning potential losses precisely with your predetermined risk percentage, contingent upon your total available capital.
▶️ Another feature of this strategy is a sophisticated mechanism called "Loss Compensation". When enabled, Loss Compensation dynamically adjusts the position size after a loss, aiming to recover from previous losses in subsequent trades. This adaptive mechanism continually modifies the position size to mitigate the impact of consecutive losses until reaching a user-defined limit for consecutive loss compensations.
The feature's configurability allows users to set the maximum number of consecutive losses to compensate for and also includes an option to factor in trading fees from prior trades into the compensation calculation. Loss Compensation operates in conjunction with the 'Fixed Loss Position Sizing' setting, ensuring that once losses are sufficiently compensated, subsequent entries revert to the predefined configurations within the 'Fixed Loss Position Sizing' settings.
This advanced tool ensures a stable risk management approach by changing trade sizes dynamically according to past results during consecutive loss periods.
▶️ This strategy incorporates a feature known as the "Counter-Pattern Breakout", altering its approach to wedge, triangle, and channel pattern breakouts. Normally, the strategy relies on standard pattern signals to determine whether to enter long or short positions based on breakout directions.
For example, in an ascending channel or a rising wedge pattern, the strategy typically seeks a short position opportunity upon a confirmed breakout in the lower line, and breakouts from the upper line are disregarded by the strategy. But with this feature enabled, strategy disregards the conventional pattern signals, seizing breakouts from upper or lower lines to open corresponding positions. For instance, in the ascending channel or the rising wedge pattern example, the strategy might enter a long position if the upper line breaks or a short position if the lower line breaks.
This introduces a more adaptive and opportunistic trading style, allowing you to capitalize on price movements, irrespective of the typical signal direction indicated by the pattern.
▶️ This strategy is fully compatible with third-party trading bots, allowing for easy connectivity to popular trading platforms. By leveraging the TradingView webhook functionality, you can effortlessly link the strategy to your preferred bot and receive accurate signals for position entry and exit. The strategy provides all the necessary alert message fields, ensuring a smooth and user-friendly trading experience. With this integration, you can automate the execution of trades, saving time and effort while enjoying the benefits of this powerful strategy.
⚙️ How to Use & Configure User Settings:
To fully utilize the "Price Action Pattern Breakout Strategy: Wedge, Triangle, Channel," it's essential to consider and comprehend the following steps. They play a crucial role in enhancing its functionality and achieving its utmost potential outcomes:
1. General Strategy Settings:
Enable Dark Mode if using a dark TradingView theme for improved chart visibility.
Select the Strategy's Trade Direction: Long, Short, or Both.
Choose Pattern Recognition Accuracy: High for precise recognition but fewer positions, Low for more positions with slightly less accuracy.
Enable 'Prevent New Entry on Opposite Signal While In Position' to avoid new trades if the opposite signal occurs.
Switch to Indicator Mode if solely using the strategy as an indicator or in combination with other strategies.
2. Pattern and Pivot Configuration:
Consider configuring the Number of Patterns and Pivot Lookback Lengths. Here, you can personalize the pivot lookback lengths for wedge, triangle, and channel patterns across eight different settings on your chart. For lower time frames, consider larger lengths to reduce chart noise. Alternatively, to maintain clarity on your chart, you can disable multiple patterns with different lengths while ensuring at least one pattern remains enabled.
Note that enabling more patterns doesn't always equate to increased potential profit. Sometimes, fewer patterns result in greater profit potential, and vice versa. Experiment with lengths and the number of patterns to determine the most profitable and optimal outcome for your trading symbol and timeframe.
3. Targeting System Selection:
Choose between 'Fixed Targets' or 'Trailing Targets' for your targeting system.
'Fixed Targets' is the default setting, operational when 'Trailing Targets' are turned off.
Set the TP1 Position Size as a percentage, defining the size for TP1, and the rest exits at TP2.
Optionally activate 'Skip Entry if TP1 is Passed' to bypass entering positions if the price has exceeded TP1.
Alternatively, opt for the 'Trailing Target' for dynamic exits based on trigger points and offsets. Note that this option disables fixed targets.
4. Stop Loss Configuration:
Determine the number of candles to consider for stop loss placement based on the last pivot.
Optionally add a percentage to the stop loss to create a buffer against market fluctuations, guarding your positions from sudden price swings.
5. Risk Management Configuration:
You can activate the 'Risk-Free' feature, making your trades risk-free by moving the stop loss to the entry price upon reaching a specified trigger point.
You have the possibility to enable 'Fixed Loss Position Sizing' to limit risk to a percentage of total capital per trade, ensuring prudent risk management.
You can employ 'Use Real-Time Balance for Each Entry' to precisely calculate fixed loss position sizing according to the real-time balance for every entry.
The 'Loss Compensation' feature can be activated to automatically adjust trade sizes during consecutive losses and compensate for prior incurred losses.
Loss compensation continues adjusting trade sizes until it reaches the defined limit of consecutive losses specified in the 'Maximum Consecutive Losses To Compensate' field.
You can factor in commission fees by specifying a percentage in the 'Include Trading Fees in Compensation (%)' field, providing an option for more accurate loss compensation calculations.
You have the option to enable 'Limit Compensation to Real-Time Balance' to prevent consecutive loss compensation from exceeding your current real-time account balance.
It's important to note that for the 'Loss Compensation' feature to operate, the 'Fixed Loss Position Sizing' must be enabled.
6. Counter-Pattern Breakout Configuration:
In this section you have the option to enable the "Counter-Pattern Breakout" feature to adjust the strategy's approach to wedge, triangle, and channel pattern breakouts. Once enabled, the strategy disregards traditional pattern signals and capitalizes on breakouts from either the upper or lower lines, initiating corresponding positions accordingly.
Choose between 'Fixed Target' or 'Trailing Target' for your targeting system. If you opt for the 'Fixed Target', set a specific target point as a percentage, serving as the default target for counter-pattern breakouts. Alternatively, choose the 'Trailing Target' for dynamic exits based on trigger points and offsets. Do keep in mind that selecting the 'Trailing Target' option disables the fixed target setting.
Keep in mind that for standard, non-counter-pattern breakouts, the target point settings in their respective sections remain applicable, distinct from the settings configured for targeting within this section.
Note that the stop loss configurations are shared across standard pattern and counter-pattern breakouts and can be adjusted within the stop loss section.
7. Info Tables:
In the info tables section, you can show or hide different tables on the charts. This includes the backtest table, the current balance table displaying available funds, and a table showcasing Maximum Consecutive Wins or Losses. Choose which to display according to your preferences and specific needs.
8.Date & Time Range Filter:
Utilize the Date & Time Range filter feature to precisely select a start and end date, including time, to filter data within the chosen range.
When connecting this strategy to a trading bot for automated trades, ensure to set the start date and time to the intended initiation moment to avoid undesired outcomes as this directly affects the real-time balance calculations of the strategy.
8. Integration with Third-Party Bots:
To automate trading, leverage the strategy's compatibility with third-party trading bots. Seamlessly integrate the strategy into well-known trading platforms by using alert message fields to input commands from third-party trading bots, enabling automated trade execution for both long and short positions.
By furnishing these adjustable settings, the strategy empowers you to personalize it according to your unique requirements, thereby bolstering the adaptability and efficacy of your trading approach.
🔐 Source Code Protection:
The 'Price Action Pattern Breakout Strategy: Wedge, Triangle, Channel' source code is engineered for precision, reliability, and effectiveness. Its original and innovative design warrants protection and restricted access, preserving the strategy's exclusivity. Safeguarding the code maintains the strategy's integrity and distinctiveness, providing users with a competitive advantage in their trading endeavors.

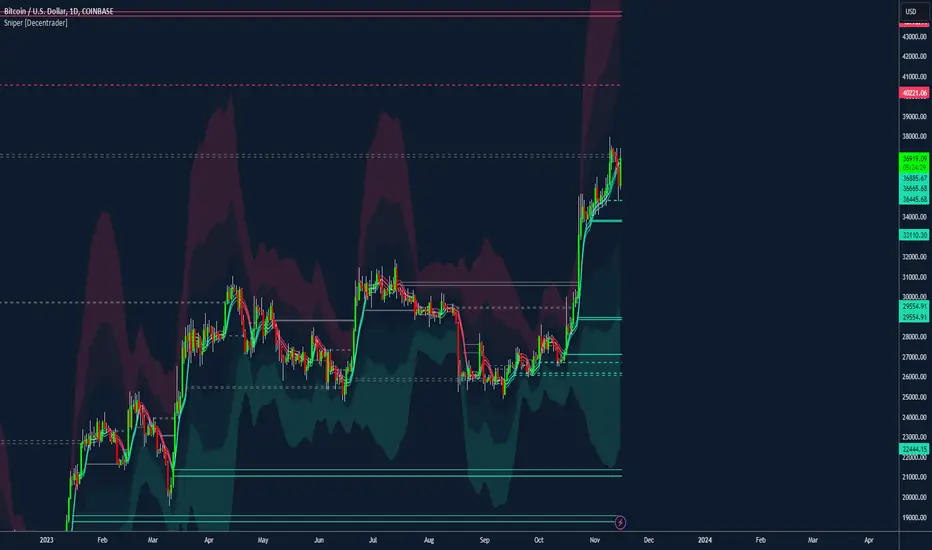
Sniper [Decentrader]Bespoke Decentrader Mean Reversion / Colume based support/resistance Strategy builder.
Colour-coded mean line using price and volume
Volatility Bands (chose % or Std Dev)
Major support and resistance plotted lines
Suggested dynamic hard-stop placement
Built for all markets
A realistic strategy for multi-asset portfolio management
Complementary components to assist other indicators/strategies
Filtering for Long / Short only conditions is possible under settings.
Can be automated by including 3rd party code into the settings to be used as alerts.
Use the Mitigate lines to show previous areas of support or resistance, which have been broken.
4 main strategy options:
1. You can choose whether to enter based on the upper or lower Meanline. If the price is below the Meanline, the lower Meanline will be used for entry, while if the price is above the Meanline, the upper Meanline will be used. \n\nIf you want to use this condition to exit the position, you also need to select the "Exit at the Meanline" option as well.
2. If the selected strategy is "3. Buy/Sell Volatility Bands," you can specify which Band should trigger the position to open. The price must touch or cross the edge of the chosen Band. Additionally, if the "Exit at the Volatility Bands" option is selected, the same Band will be used for the exit criteria.
3. Buy/Sell Meanline retest": A position will be opened when the price retests the Meanline. The price must touch or wick through the Meanline without closing below/above it. (If this strategy is combined with "Exit at the Meanline" option, then in case price goes against our position, the strategy will exit if the price closes under/above the meanline
Buy/Sell Meanline breakout (UP/DOWN)": A long or short position will be opened when the price breaks above or below the Meanline
4. Buy/Sell Support/Resistance lines": A position will be opened when the price touches the support or resistance lines. This option can also be combined with the "Exit at the Meanline" option.
This tool can be used to help enter a trending asset or find entries for an asset retracing.
Please take care to test strategies before automation, which is also possible.
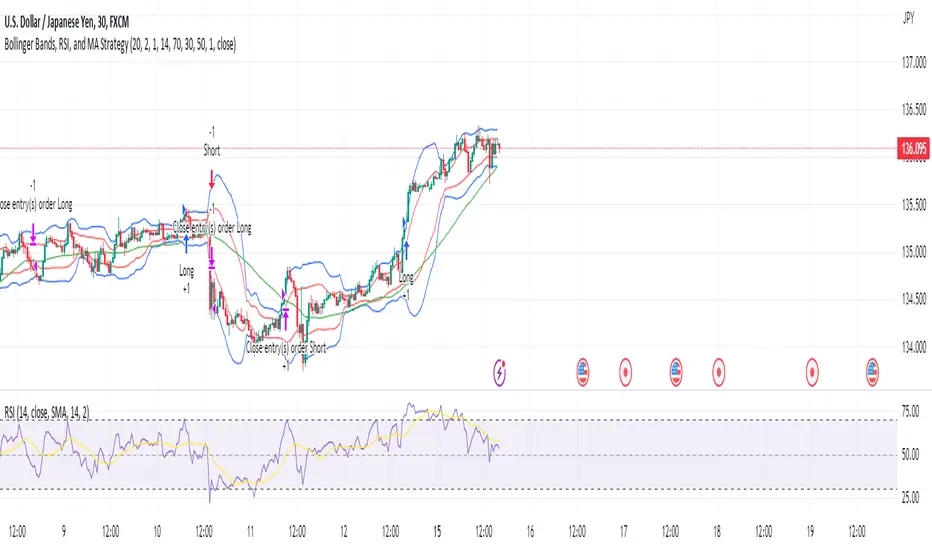
Bollinger Bands, RSI, and MA StrategyThe "Bollinger Bands, RSI and MA Strategy" is a trend-following strategy that combines the Bollinger Bands indicator, the Relative Strength Index (RSI), and a moving average (MA). It aims to identify potential entry and exit points in the market based on price volatility, momentum, and trend.
The strategy uses two Bollinger Bands with different standard deviations to create price channels. The default settings for the Bollinger Bands are a length of 20 periods and a standard deviation of 2.0. The upper and lower bands of the Bollinger Bands serve as dynamic resistance and support levels, respectively.
The RSI indicator is employed to gauge the strength of price momentum.
The strategy also incorporates a 50-period moving average (MA) to help identify the overall trend direction. When the price is above the MA, it suggests an uptrend, and when the price is below the MA, it suggests a downtrend.
The entry conditions for long trades are when the RSI is above the overbought level and there is no contraction in the Bollinger Bands. For short trades, the entry conditions are when the RSI is below the oversold level and there is no contraction in the Bollinger Bands.
The exit conditions for long trades are when the RSI drops below the overbought level or when the price closes below the 50-period MA.
For short trades, the exit conditions are when the RSI goes above the oversold level or when the price closes above the 50-period MA.
The strategy generates alerts for potential long and short entry signals, as well as for exit signals when the specified conditions are met. These alerts can be used to receive notifications or take further actions, such as placing trades manually or using automated trading systems.
It is important to note that this strategy serves as a starting point and should be thoroughly backtested and validated with historical data before applying it to live trading. Additionally, it is recommended to consider risk management techniques, including setting appropriate stop-loss and take-profit levels, to effectively manage trades.
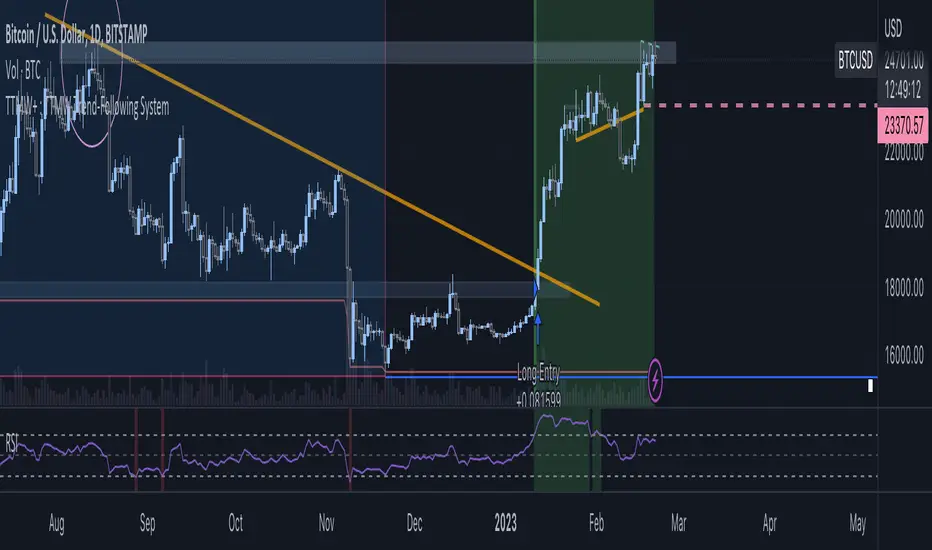
TTMW+ : TTMW Trend-Following System TTMW Trend-Following System
Developed by Stamp - To The Milky Way
# What is TTMW Trend Following System ? #
- TTMW Trend-Following System is designed and developed by "To The Milky Way". The indicator is very simple and useful for low time-preference trader, the concept of the indicator is to follow the trend when the strong buy momentum is indicated using the only indicator ,RSI (Relative Strength Index), to provide the signal for the traders. The cross-over of RSI and overbought value indicates the strong Buy momentum and the possible FOMO state, labels the Buy Signal which is indicated on the chart. The cross-under of RSI and oversold value indicated the strong Sell momentum that would be the Take-Profit or Stop-Loss target.
- The TTMW Trend-Following System is able to Backtest the performance of the system with any specific ticker by using the Strategy Tester that is provided in Tradingview, so the traders can verify the past performance of the system performing in any specify ticker before making the investing decision.
- The Trend Following system is better to use in large timeframe. The indicator is designed and developed to perform on 1D Timeframe.
# How to use ? #
- The system is very simple to use. The system is designed for 3 trading style (Normal, Aggressive, Super Aggressive) which can be selected in the setting. Traders can select the trading style which fit the best with their trading style.
- The system is developed with the Dashboard that can be enabled in the setting. The Dashboard provides the major informations that can help the traders.
- The system has an alert function that can be used to alert via Email when the Buy or Sell signal is triggered.
Weird Renko StratThis strategy uses Renko, it generates a signal when there is a reversal in Renko. When using historical data, it provides a good entry and an okay exit. However, in a real-time environment, this strategy is subject to repaint and may produce a false signal.
As a result, the backtesting result should not be used as a metric to predict future results. It is highly recommended to forward-test the strategy before using it in real trading. I forward test it from 12/18/2022 to 12/21/2022 in paper trading, using the alert feature in Tradingview. I made 60 trades trading the BTCUSDT BINANCE 3 min with 26 as the param and under the condition that I use 20x margin, compounding my yield, and having 0 trading fee, a steady loss is generated: from $10 to $3.02.
This is quite interesting. As if I flip the signal from "Long" to "Short" and another way too, it will be a steady profit from $10 to $21.85. Hence, if I'm trying to anti-trade the real-time alert signal, the current "4 Days Result" will be good. Nevertheless, I still have to forward-test it for longer to see if it will fail eventually.
Dive into the setting of the strategy
- Margin is the leverage you use. 1 means 1x, 10 means 10x. It affects the backtest yield when you backtest
- Compound Yield button is for compound calculation, disable it to go back to normal backtesting
- Anti Strategy button is to do the opposite direction trade, when the original strat told you to "Long", you "Short" instead. Enable it to use the feature
- Param is the block size for the Renko chart
- Drawdown is just a visual tool for you in case you want to place a stop loss (represent by the semitransparent red area in the chart)
- From date Thru Date is to specify the backtest range of the strategy, This feature is turned off by default. It is controlled by the Max Backtest Timeframe which will be explain below
- Max Backtest Timeframe control the From date Thru Date function, disable it to enable the From Date Thru Date function
Param is the most important input in this strategy as it directly affects performance. It is highly recommended to backtest nearly all the possible parameters before deploying it in real trading. Some factors should be considered:
- Price of the asset (like an asset of 1 USD vs an asset of 10000 USD required different param)
- Timeframe (1-minute param is different than 1-month param)
I believe this is caused by the volatility of the selected timeframe since different timeframe has different volatility. Param should be fine-tuned before usage.
Here is the param I'm using:
BTCUSDT BINANCE 3min: 26
BTCUSDT BINANCE 5min: 28
BTCUSDT BINANCE 1day: 15
Background of the strategy:
- The strategy starts with $10 at the start of backtesting (customizable in setting)
- The trading fee is set to 0.00% which is not common for most of the popular exchanges (customizable in setting)
- The contract size is not a fixed amount, but it uses your balance to buy it at the open price. If you are using the compound mode, your balance will be your current total balance. If you are using the non-compound mode, it will just use the $10 you start with unless you change the amount you start with. If you are using a margin higher than 1, it will calculate the corresponding contract size properly based on your margin. (Only these options are allowed, you are not able to change them without changing the code)

Grid Trading V.3Grid DCA Trading System (Spot) This strategy does not use indicators.
The Buy Point is the price that has come down from the previous Entry or CloseLong 1.3%(as configured) and the Point of Sale is the desired %.
This strategy will have a lot of stuck in the mountain so it is very capital intensive or should be used during the sideway market.
In this system can call Alert : {{strategy.order.alert_message}}
buy message
{"side":"buy","amount":"@0.052","joint_limit":"sell","price_limit":"270.6","symbol":"BNBUSDT","price":"0", "strategy":"Grid Trading V.3", "passphrase": "xxxxxxx"}
- joint_limit for set to sell at the time of purchase (trad Spot)
- price_limit for the sale price already calculated by the system.
sell message
{"side":"sell","amount":"@0.052","joint_limit":"sell","price_limit":"270.6","symbol":"BNBUSDT","price":"0", "strategy":"Grid Trading V.3", "passphrase": "xxxxxxx"}
This message is for bots that are already designed.
----------------------------------------------------------------------------------------------------------------------
ระบบเทรด Grid DCA (Spot) กลยุทธ์นี้ไม่ได้ใช้ indicators
จุดซื้อคือราคาที่ลงมาจาก Entry หรือ CloseLong ก่อนหน้า 1.3% (ตามที่กำหนดค่า) และจุดขายคือ % ที่ต้องการ
กลยุทธ์นี้จะมีไม้ดอยจำนวนมาก จึงใช้ทุนมาก หรือ ควรใช้ช่วงตลาด sideway
ในระบบนี้สามารถเรียกใช้ Alert : {{strategy.order.alert_message}}
message ซื้อ
{"side":"buy","amount":"@0.052","joint_limit":"sell","price_limit":"269.438","symbol":"BNBUSDT","price":"268.9","strategy":"Grid Trading V.3", "passphrase": "xxxxxxx"}
- joint_limit สำหรับ ตั้งขายตอนซื้อ (trad Spot)
- price_limit สำหรับ ราคาขายที่ระบบคำนวนให้แล้ว
message ขาย
{"side":"sell","amount":"@0.052","joint_limit":"sell","symbol":"BNBUSDT","price":"268.6","strategy":"Grid Trading V.3", "passphrase": "xxxxxxx"}
message นี้ผมใช้กับบอทที่มีการออกแบบใว้แล้ว
enjoy.
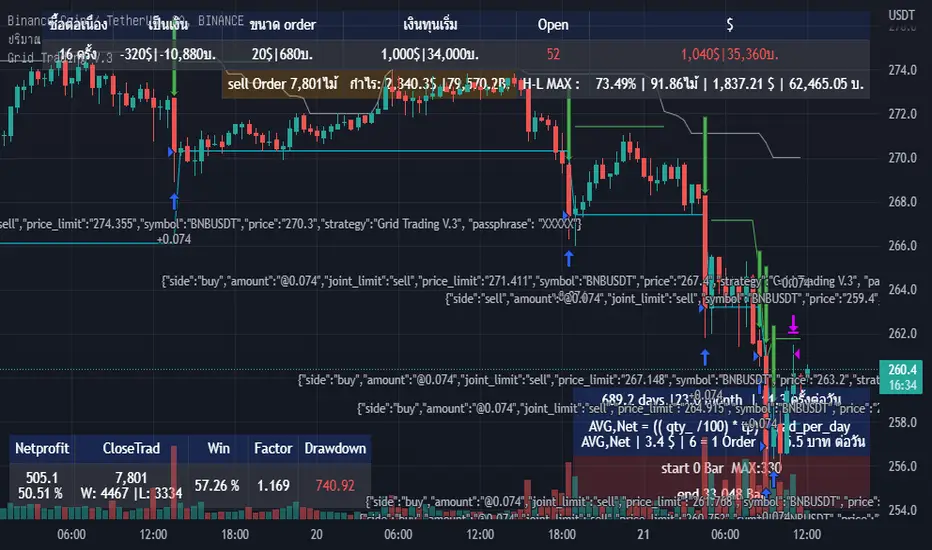
Heikin Ashi SupertrendAbout this Strategy
This supertrend strategy uses the Heikin Ashi candles to generate the supertrend but enters and exits trades using normal candle close prices. If you use the standard built in Supertrend indicator on Heikin Ashi candles, it will produce very unrealistic backtesting results because it uses the Heikin Ashi prices instead of the real prices. However, by signaling the supertrend reversals using Heikin Ashi while using standard candle close prices for the entries and exits, it corrects the backtesting errors and gives you a more realistic equity curve. You should set the chart to use standard candles and then hide them (the strategy creates the candles).
This strategy includes:
Plotting of Heikin Ashi candles
Heikin Ashi Supertrend
Long and Short Entry Signals
Move stop loss after trade is X% in profit
Profit Target
Stop Loss
Built in Alertatron automation
Alertatron Trade Automation Integration
For Alertatron integration, be sure to configure the strategy settings and "Enable Webhook Messages" before creating an alert with {{strategy.order.alert_message}} in the body of your alert message. Be sure to enable webhooks and point it to your Incoming Alertatron webhook URL.
Notes
While this strategy does pretty well during trending markets, It's worth noting that the Buy and Hold ROI is much better during peak times of the bull market
Not financial advice. Do not risk more than you can afford to lose.

Quantitative mean reversion v4The code uses the concept of mean reversion. Mean reversion suggests that price over a period of time reverts back to its statistical mean. In simple terms, it means if a price has drifted apart from the statistical mean, after a certain amount of time, it will revert back to its statistical mean. This drift is measured via z-score. When the z-score value is high, the price is expected to revert. Besides, the higher the time frame you use, the lesser the drift is, so reduce the z-score in the tabs if you use higher time frames, else, vice-versa.
Based on the parameters, the code will provide a trade signal - both long and short, and entry and exit. You can use notifications for alerts. Please use the parameters in the options to find the best combinations for your stocks.
In the properties, you can use your own brokers commission, capital, to see if the strategy is profitable for your ticker in the long run or not. This code has been tested for profits for various assets in both crypto - Bitcoin futures , Ethereum futures -, and stocks - AMD , Apple , MSFT , etc.
This is not get rich quick scheme, and you have to be patient with it for the long run.
If you have any query, please feel free to ask in the comments sections.
If you want some new changes, please feel free to suggest
Currently, I am optimising the maximum time for holding a trade. Till that's completed, use this and please feel free to leave a feedback to make it better

Trend Follower Intraday [ Adjustable TF ]Trend Follower Intraday for 3 minute Time-Frame (Adjustable) , that has the time condition for Indian Markets as well.
Unlike the Free Scripts - Risk Management , Position Sizing , Partial Exit etc. are also included .
Send us a Message to know more about the strategy.
// ══════════════════════════════════════════════════════════════════════════ //
The Timing can be changed to fit other markets, scroll down to "TIME CONDITION" to know more.
The commission is also included in the strategy .
The basic idea is when ,
1) EMA1 crosses above EMA2 , is a Long condition .
2) EMA1 crosses below EMA2 , is a Short condition .
3) Green Section indicates Long position.
4) Red Section indicates Short position.
5) Allowed hours specifies the trade entry timing.
6) ATR STOP is the stop-loss value on chart , can be adjusted in INPUTS.
7) Target 1 is the 1st target value on chart , can be adjusted in INPUTS.
8) RISK is Maximum Risk per trade for the intraday trade can be changed .
9) Total Capital used can be adjusted under INPUTS.
10) ATR TRAIL is used for trailing after entry, as mentioned in the inputs below.
11) Check trades under the list of trades .
12) Trade only in liquid stocks .
13) Risk only 1-5% of total capital.
14) Inputs can be changed for better back-test results, but also manually check the trades before setting alerts
15) SQUARE OFF TIME - As you change the time frame , also change the square-off time to the candle's closing time.
Eg: For 3min Time-frame , Hour = 2Hrs | Minute = 57min
16) Strategy stops for the day if you have a loss .
17) COMMISSION value is set to 20Rs and SLIPPAGE value is set to 2 . Go to properties to change it .
*The input values and the results are mentioned under "BACKTEST RESULTS" below*
// ══════════════════════════════ //
// ————————> RISK MANAGEMENT <——————— //
// ══════════════════════════════ //
Risk management is done based on max loss per trade and can be adjusted in the INPUTS.
// ═══════════════════════════ //
// ————————> POSITION SIZE <——————— //
// ═══════════════════════════ //
Quantity of each trade is different based on the loss
// ═════════════════════════ //
// ————————> PROPERTIES <——————— //
// ═════════════════════════ //
COMMISSION , SLIPPAGE ,RECALCULATE is already mentioned in the code.
COMMISSION can be charges , based on the broker charges.
// ═══════════════════════════════//
// ————————> TIME CONDITION <————————— //
// ═══════════════════════════════//
The time can be changed in the INPUT.
The Indian Markets open at 9:15am and closes at 3:30pm.
The 'Allowed hours' under Inputs specifies the time at which Entries should happen .
"Close All" function closes all the trades before 3pm , at the open of the next candle.
To change the time to close all trades , check INPUT.
All open trades get closed by 3pm , because some brokers don't allow you to place fresh intraday orders after 3pm .
// ═══════════════════════════════════════════════ //
// ————————> BACKTEST RESULTS ( 123 CLOSED TRADES ) <————————— //
// ═══════════════════════════════════════════════ //
INPUTS can be changed for better Back-Test results.
The strategy applied to NSE:JSWENERGY (3 min Time-Frame and with a capital of 3,00,000 ) gives us 81% profitability , as shown below
It was tested for a period a 6 months with a Profit Factor of 1.957 ,net Profit of 43,000Rs .
Sharpe Ratio = 0.745
Sortino Ratio = 2.091
No strategy in the world promises 100% profits in all market conditions , so always define your risk before trading.
Also check Back-Test results manually ,before setting Alerts
The Graph has a Linear Curve with Consistent Profits.
The INPUTS are as follows,
1) EMA1 ————————————————> 38
2) EMA2 ————————————————> 118
3) ALLOWED HRS ———————————> 9:35 TO 14:30
4) ATR STOP ——————————————> 3.2
5) RISK ——————————————————> 3000
6) ATR TRAIL ———————————————> 2.6
7) TARGET 1 ————————————————> 2.4
8) MAX POSITION VALUE ——————————> 3,00,000
8) MAX DRAWDOWN —————————————> 9,000
8) SQUARE-OFF ————————————————> 14:57
NSE:JSWENERGY
Apply it to your charts Now !
NSE:JSWENERGY
Send us a message for FREE TRIALS | Instant Access
Thank You ☺

TTP Kent Strat PROKent Strat PRO trades breakouts using Bollinger Bands together with SuperTrend.
PRO features:
- 3commas bot alerts for long/short bots
- Custom JSON bots alerts
Features:
- Risk/reward ratio parameter
- Longs, shorts and combined positions.
- Breakout settings
- Trailing SL, trailing TP
- Use of latest candles to place the SL using a lookback parameter (how many candles to look back for a low/high price)
- Select your SL between the ATR trendline and the latest candle: the closest or furthest away value
- Show the trendline
- Backtest mode for accurate backtests
- Signal mode for live price accurate signals
- Date range backtesting
Filters:
- EMA 200 filter and timeframe selector. This filter can be used to trade with the trend: open longs on an uptrend and shorts on a downtrend.
- ADX filter using threshold. This filter can be used to filter entries where the trend is not very strong.
- ADX pointing up. ADX values pointing up and above certain threshold can improve entries.
- Relative volume filter based on the volume being X% above the MA of the Volume. Trading with volume can help filtering out bad trades.
Example setup:
1) pick BINANCE:ETHUSDT chart, 15 min chart
2) trade longs + shorts
3) pick ratio 3
4) trailing SL checked
5) trailing TP unchecked
7) stop loss "furthest"
8) candle loopback 30
9) BB period 21, dev 1, ATR filter on, atr period 5
10) EMA filter on, 15 min
11) ADX off
12) Volume filter on set to 60%

VXD Cloud Edition for Python-Binance-bots.VXD Cloud Edition for Python-Binance-bots.
to overcome sideways market conditions this cloud configured for low timeframe.
every TA is same as VXD Cloud Edition but custom alert message for bots.
Risk:Reward Calculation
Risk of Ruin Setting can now selected between Fixed $ or %
if Buy your Stoploss will be Swing low
if Sell your Stoploss will be Swing high and can be setting at Pivot Setting
then Auto Position Sizing and TP line will be calculated form there and will show in Orange color line (Draw Position Box is available)
Tailing SL when price greater than RR=1
Alert Setting
{{strategy.order.alert_message}}
Python-Bot
github.com
There are 2 mode : one-way mode and hedge mode is different script in my Github profile.
read README.MD and there's video tutorial in thai language.
Pls study app.py and it's script before deploy for your own safty and your own risk, I'm NOT responsible for your loss.

[B_1] 15min Future Based on Pullback Condition
GENERAL INTRODUCTION:
This scripts is a trend catcher strategy, looking for entry points based on pullback condition.
HOW IT WORKS:
Entry Long: when price close above 15m Supertrend and an EMA line trend, MACD (12,26,9) below MACD signal (12,26,9), RSI(14) >50 & <80 and SAR is positive.
Exit Long: when price hit TPs or touch Stoploss.
Entry Short: when price close below 15m Supertrend and an EMA line trend, MACD (12,26,9) above MACD signal (12,26,9), RSI(14) <50 & >25 and SAR is negative.
Exit Short: when price hit TPs or touch Stoploss.
HOW TO USE IT:
1. Setup comment Long/Short: this setting used for auto trading. You can fill text to alert then in alert box of Tradingview, using {{strategy.order.comment}}.
2. Setup Entry
+ EMA Length: the EMA period to filter the trend (default is 30).
+ Buy/Sell ETH follow BTC: open long/short ETHUSDTPERP when BTCUSDT touch and reject SuperTrend 1H/2H/4H.
+ Long/Short again: Allow re-entry when price hit all TP or SL.
3. Setup Exit
+ Multi profit: Take profit levels are set according to the fibonacci levels.
+ Auto find TP: If having resistants in higher timeframe near TP1, TP1 will auto set at that resistant.
+ Stoploss: you have two options: Stoploss based on percentage or ATR.
+ When price hit TP1, you have two options: only move Stoploss to entry or active trailing.
4. Custom tools
+ SuperTrend MTF: they used for take multiprofit (you can show or hide them).
+ Table result.
BACKTEST:
Currently, the strategy is optimized for: BINANCE:ETHUSDTPERP . However it can also run on some other coins like: BINANCE:RUNEUSDTPERP , BINANCE:FILUSDTPERP , ...
Parameters for BINANCE:ETHUSDTPERP:
+ 01/01/2022 to present.
+ Order size starting: 01 contract.
+ commission fee: 0.02%
+ No leverage.
=> 475 trades, ratio profit: loss is 5800: 400.
If you want access to this scripts, please inbox to me, you are always welcome.
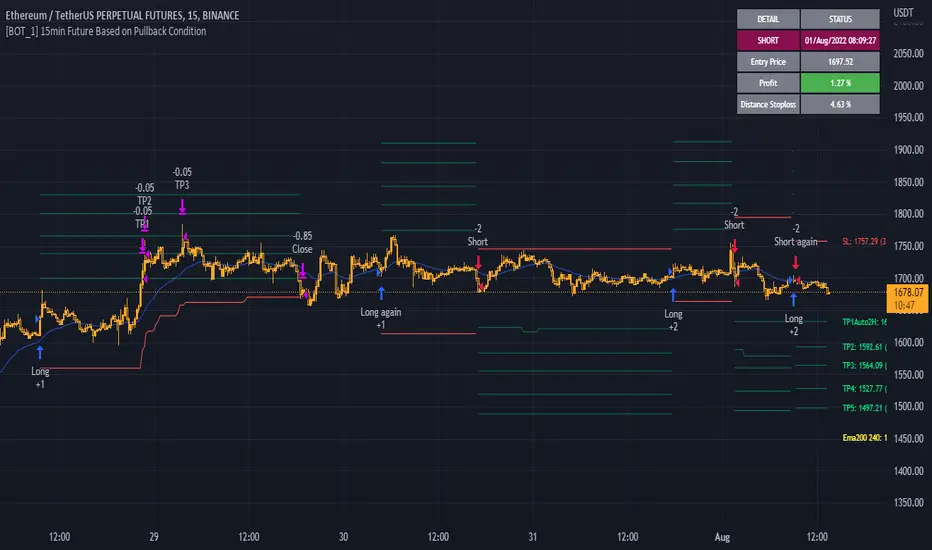
STD-Filterd, R-squared Adaptive T3 w/ Dynamic Zones BT [Loxx]STD-Filterd, R-squared Adaptive T3 w/ Dynamic Zones BT is the backtest strategy for "STD-Filterd, R-squared Adaptive T3 w/ Dynamic Zones " seen below:
Included:
This backtest uses a special implementation of ATR and ATR smoothing called "True Range Double" which is a range calculation that accounts for volatility skew.
You can set the backtest to 1-2 take profits with stop-loss
Signals can't exit on the same candle as the entry, this is coded in a way for 1-candle delay post entry
This should be coupled with the INDICATOR version linked above for the alerts and signals. Strategies won't paint the signal "L" or "S" until the entry actually happens, but indicators allow this, which is repainting on current candle, but this is an FYI if you want to get serious with Pinescript algorithmic botting
You can restrict the backtest by dates
It is advised that you understand what Heikin-Ashi candles do to strategies, the default settings for this backtest is NON Heikin-Ashi candles but you have the ability to change that in the source selection
This is a mathematically heavy, heavy-lifting strategy with multi-layered adaptivity. Make sure you do your own research so you understand what is happening here. This can be used as its own trading system without any other oscillators, moving average baselines, or volatility/momentum confirmation indicators.
What is the T3 moving average?
Better Moving Averages Tim Tillson
November 1, 1998
Tim Tillson is a software project manager at Hewlett-Packard, with degrees in Mathematics and Computer Science. He has privately traded options and equities for 15 years.
Introduction
"Digital filtering includes the process of smoothing, predicting, differentiating, integrating, separation of signals, and removal of noise from a signal. Thus many people who do such things are actually using digital filters without realizing that they are; being unacquainted with the theory, they neither understand what they have done nor the possibilities of what they might have done."
This quote from R. W. Hamming applies to the vast majority of indicators in technical analysis . Moving averages, be they simple, weighted, or exponential, are lowpass filters; low frequency components in the signal pass through with little attenuation, while high frequencies are severely reduced.
"Oscillator" type indicators (such as MACD , Momentum, Relative Strength Index ) are another type of digital filter called a differentiator.
Tushar Chande has observed that many popular oscillators are highly correlated, which is sensible because they are trying to measure the rate of change of the underlying time series, i.e., are trying to be the first and second derivatives we all learned about in Calculus.
We use moving averages (lowpass filters) in technical analysis to remove the random noise from a time series, to discern the underlying trend or to determine prices at which we will take action. A perfect moving average would have two attributes:
It would be smooth, not sensitive to random noise in the underlying time series. Another way of saying this is that its derivative would not spuriously alternate between positive and negative values.
It would not lag behind the time series it is computed from. Lag, of course, produces late buy or sell signals that kill profits.
The only way one can compute a perfect moving average is to have knowledge of the future, and if we had that, we would buy one lottery ticket a week rather than trade!
Having said this, we can still improve on the conventional simple, weighted, or exponential moving averages. Here's how:
Two Interesting Moving Averages
We will examine two benchmark moving averages based on Linear Regression analysis.
In both cases, a Linear Regression line of length n is fitted to price data.
I call the first moving average ILRS, which stands for Integral of Linear Regression Slope. One simply integrates the slope of a linear regression line as it is successively fitted in a moving window of length n across the data, with the constant of integration being a simple moving average of the first n points. Put another way, the derivative of ILRS is the linear regression slope. Note that ILRS is not the same as a SMA ( simple moving average ) of length n, which is actually the midpoint of the linear regression line as it moves across the data.
We can measure the lag of moving averages with respect to a linear trend by computing how they behave when the input is a line with unit slope. Both SMA (n) and ILRS(n) have lag of n/2, but ILRS is much smoother than SMA .
Our second benchmark moving average is well known, called EPMA or End Point Moving Average. It is the endpoint of the linear regression line of length n as it is fitted across the data. EPMA hugs the data more closely than a simple or exponential moving average of the same length. The price we pay for this is that it is much noisier (less smooth) than ILRS, and it also has the annoying property that it overshoots the data when linear trends are present.
However, EPMA has a lag of 0 with respect to linear input! This makes sense because a linear regression line will fit linear input perfectly, and the endpoint of the LR line will be on the input line.
These two moving averages frame the tradeoffs that we are facing. On one extreme we have ILRS, which is very smooth and has considerable phase lag. EPMA has 0 phase lag, but is too noisy and overshoots. We would like to construct a better moving average which is as smooth as ILRS, but runs closer to where EPMA lies, without the overshoot.
A easy way to attempt this is to split the difference, i.e. use (ILRS(n)+EPMA(n))/2. This will give us a moving average (call it IE /2) which runs in between the two, has phase lag of n/4 but still inherits considerable noise from EPMA. IE /2 is inspirational, however. Can we build something that is comparable, but smoother? Figure 1 shows ILRS, EPMA, and IE /2.
Filter Techniques
Any thoughtful student of filter theory (or resolute experimenter) will have noticed that you can improve the smoothness of a filter by running it through itself multiple times, at the cost of increasing phase lag.
There is a complementary technique (called twicing by J.W. Tukey) which can be used to improve phase lag. If L stands for the operation of running data through a low pass filter, then twicing can be described by:
L' = L(time series) + L(time series - L(time series))
That is, we add a moving average of the difference between the input and the moving average to the moving average. This is algebraically equivalent to:
2L-L(L)
This is the Double Exponential Moving Average or DEMA , popularized by Patrick Mulloy in TASAC (January/February 1994).
In our taxonomy, DEMA has some phase lag (although it exponentially approaches 0) and is somewhat noisy, comparable to IE /2 indicator.
We will use these two techniques to construct our better moving average, after we explore the first one a little more closely.
Fixing Overshoot
An n-day EMA has smoothing constant alpha=2/(n+1) and a lag of (n-1)/2.
Thus EMA (3) has lag 1, and EMA (11) has lag 5. Figure 2 shows that, if I am willing to incur 5 days of lag, I get a smoother moving average if I run EMA (3) through itself 5 times than if I just take EMA (11) once.
This suggests that if EPMA and DEMA have 0 or low lag, why not run fast versions (eg DEMA (3)) through themselves many times to achieve a smooth result? The problem is that multiple runs though these filters increase their tendency to overshoot the data, giving an unusable result. This is because the amplitude response of DEMA and EPMA is greater than 1 at certain frequencies, giving a gain of much greater than 1 at these frequencies when run though themselves multiple times. Figure 3 shows DEMA (7) and EPMA(7) run through themselves 3 times. DEMA^3 has serious overshoot, and EPMA^3 is terrible.
The solution to the overshoot problem is to recall what we are doing with twicing:
DEMA (n) = EMA (n) + EMA (time series - EMA (n))
The second term is adding, in effect, a smooth version of the derivative to the EMA to achieve DEMA . The derivative term determines how hot the moving average's response to linear trends will be. We need to simply turn down the volume to achieve our basic building block:
EMA (n) + EMA (time series - EMA (n))*.7;
This is algebraically the same as:
EMA (n)*1.7-EMA( EMA (n))*.7;
I have chosen .7 as my volume factor, but the general formula (which I call "Generalized Dema") is:
GD (n,v) = EMA (n)*(1+v)-EMA( EMA (n))*v,
Where v ranges between 0 and 1. When v=0, GD is just an EMA , and when v=1, GD is DEMA . In between, GD is a cooler DEMA . By using a value for v less than 1 (I like .7), we cure the multiple DEMA overshoot problem, at the cost of accepting some additional phase delay. Now we can run GD through itself multiple times to define a new, smoother moving average T3 that does not overshoot the data:
T3(n) = GD ( GD ( GD (n)))
In filter theory parlance, T3 is a six-pole non-linear Kalman filter. Kalman filters are ones which use the error (in this case (time series - EMA (n)) to correct themselves. In Technical Analysis , these are called Adaptive Moving Averages; they track the time series more aggressively when it is making large moves.
What is R-squared Adaptive?
One tool available in forecasting the trendiness of the breakout is the coefficient of determination ( R-squared ), a statistical measurement.
The R-squared indicates linear strength between the security's price (the Y - axis) and time (the X - axis). The R-squared is the percentage of squared error that the linear regression can eliminate if it were used as the predictor instead of the mean value. If the R-squared were 0.99, then the linear regression would eliminate 99% of the error for prediction versus predicting closing prices using a simple moving average .
R-squared is used here to derive a T3 factor used to modify price before passing price through a six-pole non-linear Kalman filter.
What are Dynamic Zones?
As explained in "Stocks & Commodities V15:7 (306-310): Dynamic Zones by Leo Zamansky, Ph .D., and David Stendahl"
Most indicators use a fixed zone for buy and sell signals. Here’ s a concept based on zones that are responsive to past levels of the indicator.
One approach to active investing employs the use of oscillators to exploit tradable market trends. This investing style follows a very simple form of logic: Enter the market only when an oscillator has moved far above or below traditional trading lev- els. However, these oscillator- driven systems lack the ability to evolve with the market because they use fixed buy and sell zones. Traders typically use one set of buy and sell zones for a bull market and substantially different zones for a bear market. And therein lies the problem.
Once traders begin introducing their market opinions into trading equations, by changing the zones, they negate the system’s mechanical nature. The objective is to have a system automatically define its own buy and sell zones and thereby profitably trade in any market — bull or bear. Dynamic zones offer a solution to the problem of fixed buy and sell zones for any oscillator-driven system.
An indicator’s extreme levels can be quantified using statistical methods. These extreme levels are calculated for a certain period and serve as the buy and sell zones for a trading system. The repetition of this statistical process for every value of the indicator creates values that become the dynamic zones. The zones are calculated in such a way that the probability of the indicator value rising above, or falling below, the dynamic zones is equal to a given probability input set by the trader.
To better understand dynamic zones, let's first describe them mathematically and then explain their use. The dynamic zones definition:
Find V such that:
For dynamic zone buy: P{X <= V}=P1
For dynamic zone sell: P{X >= V}=P2
where P1 and P2 are the probabilities set by the trader, X is the value of the indicator for the selected period and V represents the value of the dynamic zone.
The probability input P1 and P2 can be adjusted by the trader to encompass as much or as little data as the trader would like. The smaller the probability, the fewer data values above and below the dynamic zones. This translates into a wider range between the buy and sell zones. If a 10% probability is used for P1 and P2, only those data values that make up the top 10% and bottom 10% for an indicator are used in the construction of the zones. Of the values, 80% will fall between the two extreme levels. Because dynamic zone levels are penetrated so infrequently, when this happens, traders know that the market has truly moved into overbought or oversold territory.
Calculating the Dynamic Zones
The algorithm for the dynamic zones is a series of steps. First, decide the value of the lookback period t. Next, decide the value of the probability Pbuy for buy zone and value of the probability Psell for the sell zone.
For i=1, to the last lookback period, build the distribution f(x) of the price during the lookback period i. Then find the value Vi1 such that the probability of the price less than or equal to Vi1 during the lookback period i is equal to Pbuy. Find the value Vi2 such that the probability of the price greater or equal to Vi2 during the lookback period i is equal to Psell. The sequence of Vi1 for all periods gives the buy zone. The sequence of Vi2 for all periods gives the sell zone.
In the algorithm description, we have: Build the distribution f(x) of the price during the lookback period i. The distribution here is empirical namely, how many times a given value of x appeared during the lookback period. The problem is to find such x that the probability of a price being greater or equal to x will be equal to a probability selected by the user. Probability is the area under the distribution curve. The task is to find such value of x that the area under the distribution curve to the right of x will be equal to the probability selected by the user. That x is the dynamic zone.
Included:
Bar coloring
Signals
Alerts
Loxx's Expanded Source Types
