ORB 5 Min Break & Retest + Alerts By Khan 0.1 verORB 5-Minute Break & Retest Indicator
This indicator plots the high and low of the first 5-minute candle of the trading session (Opening Range). It then monitors price for a breakout above or below the ORB levels and triggers an alert when price retests the broken level and holds.
Designed to help identify high-probability ORB continuation setups with clear visual levels and TradingView alerts.
在脚本中搜索"alert"

ORB 5 Min Break & Retest + Alerts By KhanORB 5-Minute Break & Retest Indicator
This indicator plots the high and low of the first 5-minute candle of the trading session (Opening Range). It then monitors price for a breakout above or below the ORB levels and triggers an alert when price retests the broken level and holds.
Designed to help identify high-probability ORB continuation setups with clear visual levels and TradingView alerts.
If you want, I can also:
Make it even shorter (1–2 lines)
Write a more detailed TradingView public script description
Add a usage guide (rules + best timeframe)
Disclaimer:
This is general information only and not financial advice. For personal guidance, please talk to a licensed professional.

N-Consecutive Candle Marker (SMA Filter & Consolidated Alert)Certainly, here is the English version of the Pine Script description for posting on TradingView.
---
## 📈 N-Consecutive Candle Marker (SMA Filter & Consolidated Alert)
### 📝 Overview
This indicator automatically displays a **signal mark** on the chart when a user-defined number ($N$) of **consecutive bullish or bearish candles** occurs.
It includes an optional **SMA (Simple Moving Average) filter** to restrict signals to conditions favoring a **short-term counter-trend (reversal) trade**. It also consolidates both bullish and bearish signals into a **single alert mechanism** for simplified management.
### ⚙️ Key Features
#### 1. N-Consecutive Candle Detection
* **Consecutive Count (N)**: The indicator detects continuous candles of the same color based on the `Consecutive Candle Count (N)` input setting.
* **Bullish Signal (Red Marker)**: A mark is placed above the high of the closing candle after the bullish sequence is complete.
* **Bearish Signal (Blue Marker)**: A mark is placed below the low of the closing candle after the bearish sequence is complete.
#### 2. SMA Filter (Counter-Trend Logic)
When **`Use SMA Filter`** is enabled, the signal conditions are filtered against the SMA, which focuses on potential **short-term bounces or pullbacks** against the broader trend.
* **Bullish Signal Condition**: The consecutive bullish candles must close **below** the SMA (`close < sma_value`). This typically targets a bounce in a downtrend.
* **Bearish Signal Condition**: The consecutive bearish candles must close **above** the SMA (`close > sma_value`). This typically targets a pullback/dip in an uptrend.
#### 3. Performance & Alert Consolidation
* **Display Limit**: Enabling **`Use Display Limit`** restricts the plotted marks to the **last N bars** defined by `Limit Display to Last N Bars`. This automatically deletes old labels, helping to **maintain chart performance**.
* **Consolidated Alert**: Both bullish and bearish signals trigger the same **single `alert()` function**, simplifying the process of setting up notifications in TradingView.
### 💡 How to Use
1. Add the indicator to your chart.
2. Set the **`Consecutive Candle Count (N)`** to your desired number of consecutive bars (e.g., 3, 4, etc.).
3. If you want to use the reversal filter, switch **`Use SMA Filter (On/Off)`** to **On**. Adjust the `SMA Period` as needed.
4. In the TradingView alert creation menu, select this indicator and choose **"Any function call"** or **"N-Consecutive Candle Marker (SMA Filter & Consolidated Alert)"** to set up your consolidated alert.
> ⚠️ **Disclaimer**: This indicator detects specific candle patterns. Always combine this signal with other forms of technical analysis and context for making trading decisions.
ご要望いただいたTradingViewに投稿する際のインジケーターの説明文として、機能、使い方、フィルターロジックに焦点を当てた文章を作成しました。
この説明文は、Pine Scriptの公開ライブラリの投稿テンプレートに合わせて、**概要、使い方、主要機能**を明確に伝える構造にしています。
---
## 📈 N-Consecutive Candle Marker (SMA Filter & Consolidated Alert)
### 📝 概要 (Overview)
このインジケーターは、設定した本数($N$)の**連続した陽線または陰線**が出現した際に、チャート上に**サイン(マーク)**を自動で表示します。
オプションで**SMA(単純移動平均線)フィルター**を適用することができ、トレンドの状況に応じた**短期的な逆張りサイン**に限定することが可能です。また、陽線サインと陰線サインを**一つのアラート**で統合して通知できるため、管理が容易です。
### ⚙️ 主要機能 (Key Features)
#### 1. N連続ローソク足の検出
* **連続本数の設定 (N)**: `Consecutive Candle Count (N)` の設定値に基づき、連続した同色ローソク足を検出します。
* **陽線サイン (Red Marker)**: 連続陽線が完了した足の高値の上にマークを表示します。
* **陰線サイン (Blue Marker)**: 連続陰線が完了した足の安値の下にマークを表示します。
#### 2. SMAフィルター (逆張りロジック)
`Use SMA Filter` を **オン** にすることで、サインの出現条件にトレンドフィルターを追加します。これは、トレンド方向に対する**一時的な反発・押し目**を狙う、**逆張り的なロジック**を採用しています。
* **陽線サインの出現条件**: 終値がSMAの**下**にある状態で、連続陽線が出現した場合。
* **陰線サインの出現条件**: 終値がSMAの**上**にある状態で、連続陰線が出現した場合。
#### 3. パフォーマンス最適化とアラート統合
* **表示制限**: `Use Display Limit` をオンにすると、描画されるマークの数を**直近のN本**に制限し、古いマークを自動で削除することで、チャート描画の**パフォーマンスを維持**します。
* **統合アラート**: 陽線・陰線どちらのサインが出た場合でも、**単一の `alert()` 関数**でメッセージを出し分けます。これにより、アラート設定をシンプルに保てます。
### 💡 使い方 (How to Use)
1. インジケーターをチャートに追加します。
2. **`Consecutive Candle Count (N)`** を希望する連続本数に設定します(例: 3本連続、4本連続など)。
3. トレンドフィルターを使用したい場合は、**`Use SMA Filter (On/Off)`** をオンに切り替えます。
4. TradingViewのアラート設定画面で、このインジケーターを選択し、**「どんな関数呼び出しでも」**または**「N-Consecutive Candle Marker (SMA Filter & Consolidated Alert)」**を選んでアラートを設定してください。
> ⚠️ **注意点**: このインジケーターは、連続足という特定のパターンのみを検出するものです。トレード判断を行う際は、他のテクニカル分析や環境認識と組み合わせてご利用ください。

MA Strength Indicator EnhancedThe "MA Strength" is an indicator that measures market trend strength or (in the case of forex pairs) the relative strength of individual currencies based on up to five different moving averages (MA). It offers multiple calculation methods, such as simple summation, normalized value, or measuring ATR/percentage distance from the price. The results are summarized in a clear table, and it provides customizable alerts for trend changes or shifts in currency strength. The high level of configurability (e.g., MA weighting, "all MA alignment" requirement) allows for fine-tuning the strategy.
💬 Interpreting the Table (Top Rows)
The top row of the table shows the final output of the indicator. This changes according to the set "Table Mode".
Trend Mode: The top row shows the final, aggregated trend status (e.g., "BULLISH", "NEUTRAL") and the corresponding "Trend Value". This is the value the indicator compares to its thresholds.
Forex Mode: (Only on 6-character pairs): The top two rows show the strength of the Base currency and the Quote currency separately.
Calculation of the top rows:
The indicator calculates the individual score of all active MAs (according to the chosen method).
Trend Value: This is the final value calculated from the scores.
If "Enable Averaging" is ON, this will be the average of the scores (e.g., MA1 score is 5.0, MA2 score is 7.0 -> Trend Value is 6.0).
If averaging is OFF, this will be the sum of the scores (e.g., 5.0 + 7.0 = 12.0).
Forex Calculation: "Forex Mode" uses this "Trend Value". If the Trend Value is +6.0 (on an EURUSD pair):
The Base currency (EUR) value will be +6.0.
The Quote currency (USD) value will be -6.0.
The indicator compares these values to the thresholds to determine the "STRONG" status for EUR and "WEAK" status for USD.
📊 Calculation Methods
The indicator can calculate trend strength using 5 methods. The final "Trend Value" is derived from the results of these calculations.
Sum:
Description: Simply adds up the individual scores of all enabled moving averages (MA).
Formula: If the price is above an MA, it gets the "Score Above" value (e.g., +2.0); if below, it gets the "Score Below" value (e.g., -2.0).
Example: Result = (MA1 score) + (MA2 score) + ...
Normalized:
Description: Takes the sum obtained by the "Sum" method and converts it to a scale between -100% (maximally bearish) and +100% (maximally bullish). It takes into account the maximum possible positive and negative scores.
Formula: Result = (Total Score / Max Possible Score) * 100
Percentage Distance:
Description: This method also considers distance. The further the price is from the MA in percentage terms, the higher the score.
Formula: MA Score = (|Close Price - MA| / MA * 100) * Weight (The "Weight" is the "Score Above/Below" value set in settings).
ATR Distance:
Description: Similar to percentage distance, but normalizes the distance using volatility via ATR (Average True Range).
Formula: MA Score = (|Close Price - MA| / ATR) * Weight
Candle Count:
Description: Counts how many consecutive candles have been above or below the MA. It multiplies this number by the set weight.
Formula: MA Score = (Number of consecutive candles) * Weight
⚙️ Settings Options
Moving Averages (MA 1-5)
For each moving average, you can set:
Enable MA: Turn the specific MA on or off.
Type: The type of moving average (SMA, EMA, WMA, etc.).
Period: The period of the MA (e.g., 50, 200).
Score Above / Below: The most important setting. This defines the "weight" of the MA in the calculation. In "Sum" mode, this is a fixed score; in distance-based modes, this is a multiplier (weight). It is advisable to write a positive number for "Score Above" and a negative number for "Score Below".
Calculation Settings
Enable Averaging: If this is on, the indicator shows the average of the active MA scores, not the total score.
Exception: This function is not available in "Normalized" mode.
Require All MA Alignment: This is a strict filter. If enabled, the indicator only gives a "BULLISH" (or "STRONG") signal if the price is above all enabled moving averages. Similarly, a "BEARISH" signal only occurs if the price is below all moving averages. If the price is on the opposite side of even just one MA (e.g., above 4, below 1), the status becomes "NEUTRAL", regardless of the scores.
Strength / Trend Thresholds
Enable Extra Levels: If active, statuses are expanded: "EXT. BULLISH" / "EXT. BEARISH" (Trend mode) or "EXT. STRONG" / "EXT. WEAK" (Forex mode). This indicates stronger, overbought/oversold conditions.
Threshold setting: The thresholds (e.g., "Strong Above - ATR") determine when the calculated value counts as a "STRONG" or "WEAK" status.
🔢 Setting Thresholds via Calculation
If "Enable Averaging" is OFF, the "Trend Value" shown in the table will be the sum of the individual MA scores. Therefore, we must define the threshold by adding up the minimum expected performance from each moving average. This allows us to set different expectations for short, medium, and long-term averages.
Step 1: Determine MA weights
In our example, we use 3 active MAs with the following weights (Score Above values):
MA1 (Short): Weight = +2
MA2 (Medium): Weight = +3
MA3 (Long): Weight = +4
Step 2: Determine the minimum expected distance
Define a minimum distance expected from each MA to trigger a "Strong" signal.
Step 3: Calculate target scores and the final threshold
Note: If "Enable Averaging" is ON, the resulting value (sum of target scores) must be
averaged to get the final threshold.
Example 1: ATR Distance
-Goal: I want a "Strong" signal if the price is...
...at least 1.0 ATR above MA1 (Short),
...at least 1.5 ATR above MA2 (Medium),
...and at least 2.0 ATR above MA3 (Long).
-Calculation (Expected Distance * Weight):
MA1 Target Score: 1.0 * 2 = 2.0
MA2 Target Score: 1.5 * 3 = 4.5
MA3 Target Score: 2.0 * 4 = 8.0
-Final Threshold (Sum of Target Scores): 2.0 + 4.5 + 8.0 = 14.5
-Setting: Set "Strong Above - ATR" threshold to 14.5.
If "Enable Averaging" is ON, the obtained value must be averaged, and the result will be the
threshold: 4.8 (14.5 / 3 = 4.83).
Example 2: Percentage Distance
-Goal: I want a "Strong" signal if the price is...
...at least 0.5% above MA1,
...at least 1.0% above MA2,
...and at least 1.5% above MA3.
-Calculation (Expected Distance * Weight):
MA1 Target Score: 0.5 * 2.0 = 1.0
MA2 Target Score: 1.0 * 3.0 = 3.0
MA3 Target Score: 1.5 * 4.0 = 6.0
-Final Threshold (Sum): 1.0 + 3.0 + 6.0 = 10.0
-Setting: Set "Strong Above - Percentage" threshold to 10.0.
If "Enable Averaging" is ON, the obtained value must be averaged, and the result will be the
threshold.
Example 3: Candle Count
-Goal: I want a "Strong" signal if...
...at least 3 consecutive candles are above MA1,
...at least 5 consecutive candles are above MA2,
...and at least 10 consecutive candles are above MA3.
-Calculation (Expected Candle Count * Weight):
MA1 Target Score: 3 * 2.0 = 6.0
MA2 Target Score: 5 * 3.0 = 15.0
MA3 Target Score: 10 * 4.0 = 40.0
-Final Threshold (Sum): 6.0 + 15.0 + 40.0 = 61.0
-Setting: Set "Strong Above - Candle" threshold to 61.0.
If "Enable Averaging" is ON, the obtained value must be averaged, and the result will be the
threshold.
Example 4: Sum
In this mode, distance does not matter, only whether the price is above or below the MA.
-Goal: "Strong" signal if the price is above the long-term averages, but can be below the short-term (MA1).
MA1 (Short): Can be below (Weight: -2.0)
MA2 (Medium): Must be above (Weight: +3.0)
MA3 (Long): Must be above (Weight: +4.0)
-Calculation: -2.0 + 3.0 + 4.0 = 5.0
-Setting: Set "Strong Above - Sum" threshold to 5.0.
If it must be above all three moving averages, the threshold would be 2.0 + 3.0 + 4.0 = 9.0.
If "Enable Averaging" is ON, the obtained value must be averaged, and the result will be the
threshold.
Example 5: Normalized
The basic logic is similar to the "Sum" method.
-Goal: "Strong" signal if price is above MA2 and MA3, but potentially below MA1.
-Calculation: Target Sum: 5.0. Max Possible Score (above all): 9.0.
-Threshold: (5.0 / 9.0) * 100 = 55.5
In this calculation method, averaging cannot be set.
The Usage of the "ATR %" Row
The "ATR %" row shows the percentage movement of an average candle.
How to use this with "Percentage Distance" mode:
This number gives a baseline. It helps decide if the "Percentage Distance" threshold is realistic.
Example: You see the "ATR %" value is hovering around 1.2%. This means a "normal" candle moves about 1.2%.
If you set the Percentage threshold to 0.5%, it is too low. The indicator will constantly give a "Strong" signal because even average movement (noise) exceeds the threshold.
Correct Usage: If "normal" movement is 1.2%, then a "strong" movement (trend) needs to be significantly larger. For example, set the threshold to double the ATR %: 2.4 (2 * 1.2). Thus, you only get a "Strong" signal if the movement is twice the average volatility.
Supplementary Information
Rounding Differences:
The numbers displayed in the table and the precision of calculations in the background differ.
Table Display: The indicator rounds numbers to two decimal places in the table. So, if the value is 0.996, the table shows 1.00 (rounded up).
Internal Calculation: The background calculation uses much higher precision. When determining status (STRONG vs NEUTRAL), the program compares the precise, unrounded value to the threshold.
Result: Due to rounding, it may happen that if the threshold is 1.00 and the table shows 1.00, the status flickers between Strong and Neutral. If this is bothersome, it is advisable to set a slightly lower threshold (e.g., 0.98).
🔔 Alert Settings
The indicator can send alerts when the status changes.
Alert Method:
Trend: Alerts when the main trend status changes (e.g., from "NEUTRAL" to "BULLISH"). You can specify which direction to alert for (e.g., only "BULLISH").
Forex: Works only on 6-character forex pairs. You can set separate alerts for the Base or Quote currency.
Forex Strength Level: You can specify at which status level to alert (e.g., "WEAK" or "EXT. STRONG").
📈 Trading Tips
Trend Confirmation: Use the "BULLISH" / "BEARISH" status to confirm your existing strategy (e.g., breakouts, bounces off support).
Forex Pairing: In Forex mode, look for pairs where the Base currency is "STRONG" and the Quote currency is "WEAK" (or "EXT. STRONG" / "EXT. WEAK") for a long position.
Short Position: Reverse the above (Base: WEAK, Quote: STRONG).

Reversal Zones — entry + anchored exit + alerts (fixed)Script Description — Reversal Zones (Entry + Anchored Exit + Alerts)
This indicator automatically identifies potential reversal points in price action using a pattern of 4–5 consecutive candles in one direction followed by a reversal candle.
It then calculates dynamic Buy and Sell Zones based on the average range of recent candles and plots them visually on the chart — helping you identify ideal entry and exit zones with clean precision.
⚙️ How It Works
Pattern Detection:
Looks for 4–5 consecutive candles of the same color (bullish or bearish).
When the next candle reverses direction, that point becomes the reference candle.
Zone Calculation:
Takes the average of the last N candle ranges (default = 5).
X = Average candle range
Y = X ÷ Divisor (default = 10)
Plots:
BUY Zone – Below the low of the bullish reversal candle
(two lines: Low - X and Low - X - Y)
SELL Zone – Above the high of the bearish reversal candle
(two lines: High + X and High + X + Y)
Anchored Zones:
After a Buy signal, the indicator monitors for a new swing high and anchors a Sell zone there.
After a Sell signal, it monitors for a swing low and anchors a Buy zone there.
The original entry zone remains visible and is never overwritten.
Zone Extension:
Each zone extends to the right for a configurable number of bars (extendBars, default = 20).
🔔 Alerts
The script includes built-in alert conditions:
Buy Zone Hit → Triggers when price enters/touches any Buy Zone (entry or anchored).
Sell Zone Hit → Triggers when price enters/touches any Sell Zone (entry or anchored).
You can create alerts by:
Clicking Add Alert (🔔) on the chart.
Selecting this script as the condition.
Choosing Buy Zone Hit or Sell Zone Hit.
Setting alert frequency to “Once Per Bar Close”.
🎨 Customizable Inputs
Candle count (N) → Number of candles used to calculate average range.
Divisor → Controls Y distance (refines zone width).
Extend lines right → Number of bars to extend each zone line.
Minimum / Maximum consecutive candles → Controls pattern sensitivity.
Colors, line width, and label visibility are all adjustable.
💡 Best Use Cases
Identify reversal entry zones in trend exhaustion areas.
Combine with volume spikes or RSI divergence for confluence.
Use alerts for potential option writing or countertrend setups.
🧩 Credits
Created by Neeraj Sakharkarr
Designed for traders who want clean, rule-based reversal setups with automatic entry/exit zones.

Test for firing alerts on candle openThis fires an alert on every candle open. Nice to use if you need to test the performance of TradingView Alerts.
Auto Fibonacci Retracements with Alerts [SwissAlgo]AUTO-FIBONACCI RETRACEMENT: LEVELS, ALERTS & PD ZONES
Automatically maps Fibonacci retracement levels with Premium/Discount (PD) zones and configurable alerts for technical analysis study.
------------------------------------------------------------------
FEATURES
Automatic Fibonacci Levels Detection
Identifies swing extremes (reference high and low to map retracements) from a user-defined trend start date and trend indication automatically
Calculates 20 Fibonacci levels (from -2.618 to +2.618) automatically
Dynamically updates Fib levels as price action develops, anchoring the bottom (in case of uptrends) or the top (in case of downtrends)
Detects potential Trend's Change of Character automatically
Premium/Discount (PD) zone visualization based on trend and price extremes
Visual Components
Dotted horizontal lines for each Fibonacci level
'Premium' and 'discount' zone highlighting
Change of Character (CHoCH) marker when a trend anchor breaks (a bottom is broken after an uptrend, a top is broken after a downtrend)
Adaptive label colors for light/dark chart themes
Alert System
Configurable alerts for all Fibonacci levels
Requires 2 consecutive bar closes for confirmation (reduces false signals)
CHoCH alert when a locked extreme is broken
Set up using "Any alert() function call" option
------------------------------------------------------------------
USE CASES
Two Primary Use Cases:
1. PROSPECTIVE TREND MAPPING (Real-Time Tracking)
Set start date at or just before an anticipated swing extreme to track levels as the trend develops:
For Uptrend : Place start date near a bottom. The bottom level locks after consolidation, while the top updates in real-time as the price climbs higher
For Downtrend : Place start date near a top. The top-level locks after consolidation, while the bottom updates in real-time as the price falls lower
This mode tracks developing price action against Fibonacci levels as the swing unfolds.
2. RETROSPECTIVE ANALYSIS (Historical Swing Study)
Set the start date at a completed swing extreme to analyze how the price interacted (and is interacting) with the Fibonacci levels:
Both high and low are already established in the historical data
Levels remain static for analysis purposes
Useful for analyzing price behavior relative to Fibonacci levels, studying retracement dynamics, and assessing a trading posture
------------------------------------------------------------------
HOW TO USE
Set 'Start Date' : Select Start Date (anchor point) at or just before the swing extreme (bottom for uptrend, top for downtrend)
Choose Trend Direction (Up or Down): direction is known for retrospective analysis, uncertain for prospective analysis
Update the start date when significant structure breaks occur to begin analyzing a new swing cycle.
Configure alerts as needed for your analysis
------------------------------------------------------------------
TECHNICAL DETAILS
♦ Auto-Mapped Fibonacci Retracement Levels:
2.618, 2.000, 1.618, 1.414, 1.272, 1.000, 0.882, 0.786, 0.618, 0.500, 0.382, 0.236, 0.118, 0.000, -0.272, -0.618, -1.000, -1.618, -2.000, -2.618
♦ Premium/Discount (PD) Zones:
Uptrend: Green (discount zone) = levels 0 to 0.5 | Red (premium zone) = levels 0.5 to 1.0
Downtrend: Red (premium zone) = levels 0 to 0.5 | Green (discount zone) = levels 0.5 to 1.0
The yellow line represents the 0.5 equilibrium level
♦ Lock Mechanism:
The indicator monitors for new extremes to detect a Change of Character in the trend (providing visual feedback and alerts). It locks the anchor swing extreme after a timeframe-appropriate consolidation period has elapsed (varies from 200 bars on second charts to 1 bar on monthly charts) to detect such potentially critical events.
------------------------------------------------------------------
IMPORTANT NOTES
This is an educational tool for technical analysis study. It displays historical and current price relationships to Fibonacci levels but does not predict future price movements or provide trading recommendations.
DISCLAIMER: This indicator is for educational and informational purposes only. It does not constitute financial advice or trading signals. Past price patterns do not guarantee future results. Trading involves substantial risk of loss. Always conduct your own analysis and consult with qualified financial professionals before making trading decisions. By using this indicator, you acknowledge and agree to these limitations.
3MA/EMA Alerts指标名称(中文/英文)
中文名:多均线趋势指标(带上穿与金叉提醒)
英文名:Multi MA/EMA Trend Indicator (with Price & Golden Cross Alerts)
指标功能介绍(中文)
多均线趋势指标(带上穿与金叉提醒) 是一个可自定义的均线工具,适用于趋势分析和交易信号提醒。
核心功能:
多均线显示
默认显示 EMA20,EMA80/200 可选择显示
每条均线可独立选择 EMA 或 SMA
自定义颜色和线宽
价格上穿均线提醒
当价格向上突破任意开启的均线时触发提醒
可用于捕捉短线趋势启动点
金叉提醒
当短期均线向上穿过中长期均线时触发提醒
可用于捕捉潜在的趋势反转或加速
中文 UI
参数和提醒信息均为中文,便于快速理解和使用
适用场景
趋势确认
趋势反转捕捉
短线入场和长期持仓参考
Indicator Description (English)
Multi MA/EMA Trend Indicator (with Price & Golden Cross Alerts) is a customizable moving average tool for trend analysis and trading alerts.
Key Features:
Multiple Moving Averages
Default display: EMA20; EMA80/200 optional
Each MA can be set as EMA or SMA individually
Customizable colors and line widths
Price Cross Alerts
Alerts when price crosses above any active MA
Helps identify short-term trend initiation points
Golden Cross Alerts
Alerts when a short-term MA crosses above a mid/long-term MA
Useful for detecting trend acceleration or reversal signals
User-Friendly Interface
Parameters and alerts are labeled in Chinese (can be translated)
Applications
Trend confirmation
Trend reversal detection
Short-term entries and long-term position guidance

Feza Feza Upper and Lower Band with AlertsFeza Feza Upper and Lower Band with Alerts. Feza Feza Upper and Lower Band with Alerts. Feza Feza Upper and Lower Band with Alerts. Feza Feza Upper and Lower Band with Alerts. Feza Feza Upper and Lower Band with Alerts.
ma btc Multiple MA Convergence Alertbtc and eth ma15 20 50 200if converge
alert("EMA15, MA20, MA50, MA200 are converging/overlap crossing!", alert.freq_once_per_bar_close)
EMA 200 MultiTF G/R + Cross Alerts by LifeHack Trader1. Indicator Setup
The script starts by defining the version of Pine Script (v5) and creating an indicator called "EMA 200 MultiTF G/R + Cross Alerts by LifeHack Trader."
The overlay=true parameter ensures that the indicator is plotted directly on the price chart.
2. Function to Get EMA200
A custom function getEma200 is defined to retrieve the 200-period Exponential Moving Average (EMA) for a specified timeframe (tf).
This function uses the request.security function to fetch the close price's EMA from different timeframes.
3. Calculate EMA200 for Multiple Timeframes
The script calculates the EMA200 for four timeframes: 15 minutes ("15"), 1 hour ("60"), 4 hours ("240"), and 1 day ("D").
These values are stored in variables (ema15, ema1h, ema4h, ema1d) and represent the EMA for each timeframe.
4. Determine Price Above or Below EMA200 (G/R)
For each timeframe, the script checks whether the closing price is above or below the EMA200.
It uses boolean checks to determine if the price is above the EMA200, assigning the status "G" (Green) for above and "R" (Red) for below.
5. Cross Signal Detection (Up/Down)
The script detects crossovers and crossunders between the price and EMA200 for each timeframe.
A crossover signal is detected when the price crosses above the EMA200 (bullish), and a crossunder signal is detected when the price crosses below the EMA200 (bearish).
These signals are stored in separate variables (crossUp, crossDown).
6. Display a Table with G/R Status and Cross Alerts
A table is created and displayed in the top-right corner of the chart. The table shows the status (G or R) for each timeframe and the cross signal (▲ for crossover, ▼ for crossunder, or - for no cross event).
The table is updated with the respective values for each timeframe every time a new bar is formed.
7. Alert Conditions
The script defines alert conditions based on the crossovers and crossunders.
When a price crosses above the EMA200 (cross-up), an alert is triggered for a potential buy opportunity. When the price crosses below the EMA200 (cross-down), an alert is triggered for a potential sell opportunity.
Alerts are configured for each timeframe (15 minutes, 1 hour, 4 hours, and 1 day).
This script provides a comprehensive system for monitoring price action relative to the EMA200 on multiple timeframes, highlighting crossovers, and delivering visual feedback and alerts based on the price's relationship with the EMA.

15/30M Alerts"X Candle Close":
Same as in 5m Enter alert: it's really helpful to wait for a 15m/30m candle to be confirmed, to see f. e. whether a candle really broke a support / resistance or not - and to prevent making bad decisions.
More infos: www.reddit.com

Painel Técnico (4H x 1D) — Clean UI + Alertas BrenoG📋 Main Functions
1️⃣ Analysis in two fixed timeframes
4 hours and 1 day analyzed in parallel.
Each column in the table displays the data for its respective timeframe.
2️⃣ Entry point based on oversold conditions
The “entry point” is not the current price, but rather the last candle that went into oversold territory (RSI ≤ configured threshold).
If there has been no recent oversold condition, the current price is used as a fallback.
All calculations (Buy Zone, Stops, TPs) are based on this point.
3️⃣ Buy Zone
Defined as:
java
Copiar
Editar
Low Zone = entry * (1 - width%)
High Zone = entry
Always visible in the table, but alerts can be set to trigger only if RSI is oversold at the moment of entry.
4️⃣ Automatic Stops
Moderate Stop and Conservative Stop, calculated as a % below the entry point.
Displayed in the table with black text on a gray background for emphasis.
Alerts trigger when price crosses below these levels.
5️⃣ Take Profits (TP1–TP4)
Calculated from the entry point:
By percentage (usePercentTP = true) or
By fixed prices (usePercentTP = false).
The table displays:
Target price
% gain over the entry point
They only appear when RSI > 50 and EMA50 > EMA200 (the “alignment” condition).
Alerts trigger only on breakouts upward.
6️⃣ Context Indicators
RSI → shows numeric value and green/red color.
MACD → indicates if the MACD line is above or below the signal line.
EMAs 50/200 → indicates “Golden Cross” or “Death Cross”.
Price vs EMA200 → dedicated row showing “Above” or “Below EMA 200” with green/red color.
7️⃣ Visual Panel
Semi–transparent dark gray background, thin borders.
Colored header:
Blue for 4H
Orange for 1D
Rows separated by data type for easy reading.
Configurable font size (tiny to large).
Table position configurable (top_left, top_right, etc.).
8️⃣ Integrated Alerts
Entry/Exit of Buy Zone
Touch of each TP
Touch of each Stop
RSI entering Oversold
All alerts are separated by timeframe with clear, fixed messages.
📌 Simple Summary:
It’s an intelligent panel that combines multi–timeframe technical analysis, automatic calculation of entries/stops/TPs based on oversold conditions, and ready–to–use alerts — all presented in a visual, compact, and fully configurable format.

Xcalibur Signals & Alerts [AlgoXcalibur]An advanced trend-following algorithm forged to empower retail traders with an edge.
Xcalibur Signals & Alerts is a sophisticated, multi-layered algorithm designed to consistently deliver real-time trend signals—without clutter or unnecessary complexity. The system combines refined trend-following logic with breakout detection, flat-market filtration, false signal failsafes, take profit cues, live alerts, and more — all in a visually simple, easy-to-use indicator built for all assets, timeframes, and market conditions.
🧠 Algorithm Logic
Xcalibur Signals & Alerts operates on a systematic framework that evaluates multiple technical dimensions in harmony—directional alignment, momentum confirmation, relative strength, volume bias, breakout detection, Fibonacci calculations, and more. Rather than reacting to isolated triggers, it filters every opportunity through a multi-layered confirmation engine. It doesn’t just react to every move—it evaluates them. This cohesive approach ensures that each signal results from aligned conditions—not arbitrary thresholds. By combining structural awareness with adaptive filtering, Xcalibur maintains clarity and consistency across a wide range of market environments—delivering actionable signals without unnecessary noise or lag.
⚙️ User-Adjustable Features
• Adjustable Sensitivity:
Choose from 5 pre-tuned Signal Trigger Settings and 3 dynamic Confirmation Filter Modes to tailor the system to your trading style, asset, and timeframe. Candle color reflects the active trigger condition, while an adaptive cyan line displays the selected Confirmation Filter—blocking signals until the filter threshold is crossed.
• Directional Stability Filter: When enabled, this filter uses mean-reversion calculations to determine directional bias and block unreliable signals during choppy, indecisive price action. A magenta line represents this filter threshold and provides higher-confidence signals during periods of low directional conviction.
• Pullback Allowance Filter:
When enabled, this unique filter uses Fibonacci ratios to deliberately block signals from temporary pullbacks during strong trend periods. A green (uptrend) or red (downtrend) line marks the active pullback allowance zone.
• False Signal Failsafe
:
Two selectable modes:
Simple — Cancels the signal if price breaks the signal candle’s high or low.
Advanced — Requires both a price break and opposing momentum confirmation.
When triggered, the system plots a white “X” signal, turns candles gray, disables the background color, sends an alert (if enabled), and enters standby mode until a valid trend condition re-emerges.
• Reaction Zones:
Identifies probable reversal or breakout zones based on recent price action patterns. A yellow line appears when active, with a yellow caution flag plotted if the price reaches this critical area.
• Take-Profit Cues
: Automatically detects potential trend exhaustion using price action structure and momentum shifts. When triggered, a visual “TP” marker is plotted—advising traders to manage profits or prepare for a possible reversal.
• Trailing Stop:
Plots a dynamic, percentage-based trailing stop or trailing take-profit using your selected input. Adjust it to suit your risk tolerance and asset.
• Multi-Timeframe Monitor
: Displays real-time trend direction across 1m, 2m, 5m, 15m, 1H, 4H, and 1D timeframes in a compact, easy-to-read table.
• Alert System
:
Receive desktop and/or mobile alerts for:
* New trend signals
* Failsafe triggers
* 9:00 AM Morning Greeting messages with auto re-arming confirmation
(Alerts are limited to 9:00 AM – 4:00 PM Eastern Time)
• SuperCandles
: Highlights strong momentum moves with a stunning and easily recognizable glow effect.
• Color-Coded Candles & Background
: Candles reflect the current trigger condition, while the background tint tracks the most recent trend—enhancing situational awareness.
*All input settings include tooltips to guide users through setup and interpretation.
⚔️ Not Just Another Signal Tool
Xcalibur Signals & Alerts was built from the ground up to empower retail traders with access to a cohesive, structured algorithmic system—one that reflects the kind of awareness, discipline, and market adaptability found in professional-grade algorithms.
This is not another oversensitive or under-responsive signal indicator that is limited to one specific type of market condition or trader. It does not utilize hyperactive triggers, rely on lagging crossover logic, or need infinitely adjustable and complex sensitivity settings. Instead of cluttered visuals to interpret, this indicator delivers a simple, easy-to-use tool—prioritizing clarity and usability without compromising on depth and sophistication.
Whether the market is trending, breaking out, or moving sideways, Xcalibur adapts—prioritizing trend stability, directional integrity, and visual clarity from one signal to the next.
⚠️ While the Xcalibur Signals & Alerts algorithm is immune to human emotion, you are not. Be mindful not to fall victim to costly emotions that can manipulate your judgment, and understand the unpredictable and complex nature of trading. No algorithm, strategy, or technique can deliver perfect accuracy, and Xcalibur Signals & Alerts is no exception. While AlgoXcalibur strives to be as accurate as possible, incorrect signals can and will occur. Xcalibur Signals & Alerts is a tool, not a guarantee. Users are fully responsible for making their own trading decisions, implementing proper risk management, and always trading responsibly.
🛡️ Wield Xcalibur as a standalone weapon or use it alongside other tools.
🔐 To get access or learn more, visit the Author’s Instructions section.

Aggregate PDH High Break Alert**Aggregate PDH High Break Alert**
**Overview**
The “Aggregate PDH High Break Alert” is a lightweight Pine Script v6 indicator designed to instantly notify you when today’s price breaks above any prior-day high in a user-defined lookback window. Instead of manually scanning dozens of daily highs, this script automatically loops through the last _N_ days (up to 100) and fires a single-bar alert the moment price eclipses a specific day’s high.
**Key Features**
- **Dynamic Lookback**: Choose any lookback period from 1 to 100 days via a single `High-Break Lookback` input.
- **Single Security Call**: Efficiently retrieves the entire daily-high series in one call to avoid TradingView’s 40-call security limit.
- **Automatic Looping**: Internally loops through each prior-day high, so there’s no need to manually code dozens of lines.
- **Custom Alerts**: Generates a clear, formatted alert message—e.g. “Crossed high from 7 day(s) ago”—for each breakout.
- **Lightweight & Maintainable**: Compact codebase (<15 lines) makes tweaking and debugging a breeze.
**Inputs**
- **High-Break Lookback (days)**: Number of past days to monitor for high breaks. Valid range: 1–100.
**How to Use**
1. **Add to Chart**: Open TradingView, click “Indicators,” then “Create,” and paste in the code.
2. **Configure Lookback**: In the script’s settings, set your desired lookback window (e.g., 20 for the past 20 days).
3. **Enable Alerts**: Right-click the indicator’s name on your chart, select “Add Alert on Aggregate PDH High Break Alert,” and choose “Once per bar close.”
4. **Receive Notifications**: Whenever price crosses above any of the specified prior-day highs, you’ll get an on-screen and/or mobile push alert with the exact number of days ago.
**Use Cases**
- **Trend Confirmation**: Confirm fresh bullish momentum when today’s high outpaces any of the last _N_ days.
- **Breakout Trading**: Automate entries off multi-day highs without manual chart scanning.
- **System Integration**: Integrate with alerts to trigger orders in third-party bots or webhook receivers.
**Disclaimer**
Breakouts alone do not guarantee sustained moves. Combine with your preferred risk management, volume filters, and other indicators for higher-probability setups. Use on markets and timeframes where daily breakout behavior aligns with your strategy.

Delta Volume Histogram with Filters and AlertsОписание (Russian):
Индикатор "Delta Volume Histogram" определяет дельту объёма и отображает её в виде гистограммы. Он показывает разницу между объёмами покупок и продаж, с возможностью фильтрации значений и вызова алертов.
Функции:
Фильтр для отображения только значений выше заданного порога.
Режим отображения всех значений выше нуля.
Алерт при появлении дельты, превышающей установленный фильтр.
Description (English):
The "Delta Volume Histogram" indicator calculates volume delta and displays it as a histogram. It highlights the difference between buy and sell volumes, with options for filtering values and triggering alerts.
Features:
Filter to display only values above a specified threshold.
**Features (continued):**
- Mode to display both positive and negative delta values above the zero line for better visualization.
- Alert functionality that notifies you when the delta volume exceeds the specified filter value.
This indicator is ideal for traders who want to track buying and selling pressure in the market, helping to identify strong movements and potential reversals based on volume delta analysis.

Enhanced Trading Alerts# Enhanced Multi-Symbol EMA Trading System with Smart Alerts
## 📊 Overview
A powerful multi-symbol trading system that monitors up to 6 symbols simultaneously for high-probability trading setups using advanced EMA crossover strategies, enhanced with volume confirmation and RSI filters. Perfect for swing traders and position traders focusing on quality tech stocks.
## 🎯 Key Features
- **Multi-Symbol Monitoring**: Simultaneously tracks 6 different symbols
- **Advanced EMA Strategy**: Uses dual EMA system (320 & 820 periods) for trend confirmation
- **Volume Validation**: Confirms signals with volume surge analysis
- **RSI Filter**: Adds momentum confirmation to avoid false signals
- **Smart Risk Management**: Automatic stop-loss and take-profit calculations
- **Detailed Alerts**: Comprehensive alert messages with key price levels
## 📈 Trading Signals
### Buy Signals Generated When:
- Price crosses above the slow EMA (820)
- Fast EMA (320) confirms the trend
- RSI is in optimal range (not overbought)
- Volume surge confirms the movement
- Risk levels automatically calculated
### Sell Signals Generated When:
- Price crosses below the slow EMA (820)
- Fast EMA (320) confirms the downtrend
- RSI confirms momentum shift
- Volume surge validates the movement
## ⚙️ Customizable Parameters
- **EMA Lengths**: Adjust fast and slow EMA periods
- **Volume Threshold**: Set minimum volume surge multiplier
- **RSI Settings**: Customize overbought/oversold levels
- **Risk Management**: Adjustable stop-loss and take-profit percentages
- **Symbol Selection**: Choose any 6 symbols to monitor
## 🎨 Visual Elements
- Blue line: Fast EMA (320)
- Red line: Slow EMA (820)
- Purple line: RSI indicator
- Clear visual representation of trend changes
## 📱 Smart Alerts
Detailed alert messages include:
- Symbol name and signal type
- Current price level
- RSI value
- Stop-loss price
- Take-profit target
- Volume surge multiplier
## 💡 Best Practices
1. **Timeframe Selection**:
- Best suited for 1H, 4H, or Daily timeframes
- Can be adapted for swing or position trading
2. **Risk Management**:
- Use suggested stop-loss levels
- Follow take-profit targets
- Consider volume confirmation strength
3. **Multiple Chart Setup**:
- Create multiple instances for more symbols
- Group correlated assets together
- Use different alert sounds for different setups
## 🎓 Usage Tips
- Monitor strongest tech stocks for best results
- Combine with market sentiment analysis
- Use volume surge as quality filter
- Wait for all conditions to align before trading
- Consider overall market conditions
## ⚠️ Risk Warning
This indicator is for informational purposes only. Always conduct your own analysis and consider your risk tolerance before trading. Past performance does not guarantee future results.
## 📌 Version History
- v1.0: Initial release with multi-symbol support
- v1.1: Added volume surge confirmation
- v1.2: Enhanced alert system with risk levels
- v1.3: Added RSI filter and improved signal quality
## 🔄 Regular Updates
Subscribe to this script for regular updates and improvements. Feel free to suggest features in the comments section.
## 📗 Default Symbols
- TSLA (Tesla)
- NVDA (NVIDIA)
- AVGO (Broadcom)
- TSM (Taiwan Semiconductor)
- META (Meta Platforms)
- AMZN (Amazon)
You can customize these symbols to match your trading preferences.
Good luck trading! 🍀

Engulfing Candles Alert - Multi Symbol (Miu)This indicator plots triangle shapes on each engulfing candles (bullish or bearish) on current chart.
The main use for this indication is to set alerts on multiple symbols at once.
Please follow steps below to set your alarms:
1) Add indicator to the chart
2) Go to settings
3) Check symbols you want to receive alerts (choose up to 8 different symbols)
4) Check if you want only bullish or bearish alerts or both
5) Once all is set go back to the chart and click on 3 dots to set alert in this indicator, rename your alert and confirm
6) You can remove indicator after alert is set and it'll keep working as expected
What does this indicator do?
This indicator will generate alerts anytime a candle closes and reaches bullish or bearish engulfing condition for any of symbol set.
Alert messages example: "Bullish alert on {Symbol}"
This script requests open and close information for each symbol through request.security() built-in function.
Detailed indicator description:
If current bar open is less than or equal to the previous bar close AND current bar open is less than previous bar open AND current bar close is greater than previous bar open THEN True
bullishEngulfing = (openBarCurrent <= closeBarPrevious) and (openBarCurrent < openBarPrevious) and (closeBarCurrent > openBarPrevious)
The opposite condition will be bearishEngulfing
Feel free to give feedbacks on comments section below. Enhancement suggestions are welcome =).
Enjoy!

Digital Clock with Market Status and AlertsDigital Clock with Market Status and Alerts - 日本語解説は下記
Overview:
The Digital Clock with Market Status and Alerts indicator is designed to display the current time in various global time zones while also providing the status of major financial markets such as Tokyo, London, and New York. This indicator helps traders monitor the open and close times of different markets and alerts them when a market opens. Customizable options are provided for table positioning, background, text colors, and font size.
Key Features:
Real-Time Digital Clock: The indicator shows the current time in your selected time zone (Asia/Tokyo, America/New_York, Europe/London, Australia/Sydney). The time updates in real-time and includes hours, minutes, and seconds, providing a convenient and accurate way to monitor time across different trading sessions.
Global Market Status: Displays the open or closed status of major financial markets.
・Tokyo Market: Open from 9:00 AM to 3:00 PM (JST).
・London Market: Open from 16:00 to 24:00 during summer time and from 17:00 to 1:00 during winter time (JST).
・New York Market: Open from 21:00 to 5:00 during summer time and from 22:00 to 6:00 during winter time (JST).
Customizable Display:
・Background Color: The indicator allows you to set the background color for the clock display, while the leftmost empty cell can be independently customized with its own background color for table alignment.
・Clock and Market Status Colors: Separate color options are available for the clock text, market status during open, and market status during closed periods.
・Text Size: You can adjust the size of the text (small, normal, large) to fit your preferences.
・Table Position: You can position the digital clock and market status table in different locations on the chart: top left, top center, top right, bottom left, bottom center, and bottom right.
Alerts for Market Opening: The indicator will trigger alerts when a market (Tokyo, London, or New York) opens, notifying traders in real-time. This can help ensure that you don't miss any important market openings.
How to Use:
Setup:
Apply the Indicator: Add the Digital Clock with Market Status and Alerts indicator to your chart. Customize the time zone, text size, background colors, and table position based on your preferences.
Monitor Market Status: Watch the market status displayed for Tokyo, London, and New York to keep track of market openings and closings in real-time.
Receive Alerts: The indicator provides built-in alerts for market openings, helping you stay informed when a key market opens for trading.
Time Monitoring:
・Real-Time Clock: The current time is displayed with hours, minutes, and seconds for accurate tracking. The clock updates every second and reflects the selected time zone.
・Global Time Zones: Choose your desired time zone (Tokyo, New York, London, Sydney) to monitor the time most relevant to your trading strategy.
Market Status:
・Tokyo Market: The status will display "Tokyo OPEN" when the Tokyo market is active, and "Tokyo CLOSED" when it is outside of trading hours.
・London Market: Similarly, the indicator will show "London OPEN" or "London CLOSED" depending on whether the London market is currently active.
・New York Market: The New York market status follows the same structure, showing "NY OPEN" or "NY CLOSED."
Customization:
・Table Positioning: Easily move the table to the desired location on the chart to avoid overlap with other chart elements. The leftmost empty cell helps with alignment.
・Text and Background Color: Adjust the text and background colors to suit your personal preferences. You can also set independent colors for open and closed market statuses to easily distinguish between them.
Cautions and Disclaimer:
・Indicator Modifications: This indicator may be updated without prior notice, which could change or remove certain features.
・Trade Responsibility: This indicator is a tool to assist your trading, but responsibility for all trades remains with you. No guarantee of profit or success is implied, and losses can occur. Use it alongside your own analysis and strategy.
Digital Clock with Market Status and Alerts - 解説と使い方
概要:
Digital Clock with Market Status and Alerts インジケーターは、さまざまな世界のタイムゾーンで現在の時刻を表示し、東京、ロンドン、ニューヨークなどの主要な金融市場のステータスを提供します。このインジケーターにより、複数の市場のオープンおよびクローズ時間をリアルタイムで監視でき、市場がオープンする際にアラートを受け取ることができます。テーブルの位置、背景色、テキストカラー、フォントサイズなどのカスタマイズが可能です。
主な機能:
リアルタイムデジタル時計: 選択したタイムゾーン(東京、ニューヨーク、ロンドン、シドニー)の現在時刻を表示します。リアルタイムで更新され、時間、分、秒を正確に表示します。
世界の市場ステータス: 主要な金融市場のオープン/クローズ状況を表示します。
・東京市場: 午前9時~午後3時(日本時間)。
・ロンドン市場: 夏時間では16時~24時、冬時間では17時~1時(日本時間)。
・ニューヨーク市場: 夏時間では21時~5時、冬時間では22時~6時(日本時間)。
カスタマイズ可能な表示設定:
・背景色: 時計表示の背景色を設定できます。また、テーブルの左側に空白のセルを配置し、独立した背景色を設定することでテーブルの配置調整が可能です。
・時計と市場ステータスの色: 時計テキスト、オープン市場、クローズ市場の色を個別に設定できます。
・テキストサイズ: 小、標準、大から選択し、テキストサイズをカスタマイズ可能です。
・テーブル位置: デジタル時計と市場ステータスのテーブルをチャートのさまざまな場所(左上、中央上、右上、左下、中央下、右下)に配置できます。
市場オープン時のアラート: 市場(東京、ロンドン、ニューヨーク)がオープンするときにアラートを発し、リアルタイムで通知されます。これにより、重要な市場のオープン時間を逃さないようサポートします。
使い方:
セットアップ:
インジケーターを適用: チャートに「Digital Clock with Market Status and Alerts」インジケーターを追加し、タイムゾーン、テキストサイズ、背景色、テーブル位置を好みに応じてカスタマイズします。
市場ステータスを確認: 東京、ロンドン、ニューヨークの市場ステータスをリアルタイムで表示し、オープン/クローズ時間を把握できます。
アラートを受け取る: 市場オープン時のアラート機能により、重要な市場のオープンを見逃さないように通知が届きます。
時間管理:
・リアルタイム時計: 現在の時刻が秒単位で表示され、選択したタイムゾーンに基づいて正確に追跡できます。
・グローバルタイムゾーン: 東京、ニューヨーク、ロンドン、シドニーなど、トレードに関連するタイムゾーンを選択して監視できます。
市場ステータス:
・東京市場: 東京市場が開いていると「Tokyo OPEN」と表示され、閉じている場合は「Tokyo CLOSED」と表示されます。
・ロンドン市場: 同様に、「London OPEN」または「London CLOSED」が表示され、ロンドン市場のステータスを確認できます。
・ニューヨーク市場: ニューヨーク市場も「NY OPEN」または「NY CLOSED」で現在の状況が表示されます。
カスタマイズ:
・テーブル位置の調整: テーブルの位置を簡単に調整し、チャート上の他の要素と重ならないように配置できます。左側の空白セルで位置調整が可能です。
・テキストと背景色のカスタマイズ: テキストと背景の色を自分の好みに合わせて調整できます。また、オープン時とクローズ時の市場ステータスを区別するため、独立した色設定が可能です。
注意事項と免責事項:
・インジケーターの変更: このインジケーターは、予告なく変更や機能の削除が行われる場合があります。
・トレード責任: このインジケーターはトレードをサポートするツールであり、トレードに関する全責任はご自身にあります。利益を保証するものではなく、損失が発生する可能性があります。自分の分析や戦略と組み合わせて使用してください。

ORB - Alerts, VWAP and MACD Checks, Extended Fib Levels
ORB Range Alerter with Shading, VWAP Check, MACD Check, and Extended Fibonacci Levels for TP – Fully Customizable
This indicator is designed to give you a comprehensive analysis of the Opening Range Breakout (ORB) combined with advanced conditions based on VWAP and MACD indicators, along with Extended Fibonacci Levels for both long and short TP positions.
Key Features:
Opening Range Breakout (ORB):
Defines the opening range at the market open (9:30 AM by default) based on your chart timeframe and shades it for visibility.
The high and low of the first candle after the open are plotted on the chart, creating a breakout range that traders can use to identify potential long or short positions.
VWAP Condition (Optional):
This indicator includes the option to enforce the VWAP (Volume-Weighted Average Price) as a condition for entering trades.
- Longs will only trigger if the price is above VWAP (when enabled).
- Shorts will only trigger if the price is below VWAP (when enabled).
Customizable : You can enable or disable the VWAP condition through a simple checkbox in the indicator’s settings.
MACD Condition (Optional):
Includes an optional MACD (Moving Average Convergence Divergence) condition.
- Longs will only trigger if the MACD line is above 0 and the signal line, providing confirmation of bullish momentum.
- Shorts will only trigger if the MACD line is below 0 and the signal line, indicating bearish momentum.
Customizable : You can enable or disable the MACD condition through a checkbox in the indicator’s settings, allowing you to trade with or without the MACD confirmation.
Fibonacci Extensions for Profit Targets:
Automatically calculates Fibonacci extension levels based on the ORB range for TP levels.
These levels provide key areas for potential profit-taking or reversal points.
Fibonacci extensions are plotted only after a confirmed breakout, either long or short.
The extensions include 127.2%, 161.8%, 200%, 261.8%, 423.6%, and 685.4%, offering a comprehensive set of targets for different trading strategies.
Shading of ORB Range:
The ORB high and low are visually emphasized on the chart with a shaded area for easy identification.
The shading is semi-transparent to help keep your chart clean and easy to read.
Customizable Timeframe:
The ORB range is defined based on the time of day (default is 9:30 AM to 4:00 PM), but you can adjust the timeframe to suit different trading sessions or markets.
Alerts for Breakouts:
Built-in alerts notify you when price crosses above or below the ORB high or low, along with the optional VWAP and MACD conditions.
Alerts can be used to create automated notifications or even execute automated trades based on your chosen settings.
How to Use:
Long Trade Example: When the price crosses above the ORB high, VWAP is above the price, and MACD shows bullish momentum (if these conditions are enabled), a potential long entry is triggered. You can use the Fibonacci extensions for profit targets.
Short Trade Example: When the price crosses below the ORB low, VWAP is below the price, and MACD confirms bearish momentum (if these conditions are enabled), a short entry is triggered. Fibonacci levels for the short position can guide your exit strategy.
Flexibility: You can enable or disable both VWAP and MACD conditions based on your trading style. This flexibility allows the indicator to adapt to different market conditions and strategies.
Customization Options:
Enable/Disable VWAP Condition: Decide if you want to include VWAP as a trade filter.
Enable/Disable MACD Condition: Choose whether to require MACD as confirmation for trade entries.
Adjust ORB Timeframe: Customize the time range for defining the ORB based on the market you're trading.
Fibonacci Extensions: Visualize key profit targets using Fibonacci extensions, which are automatically calculated and displayed after a breakout.

Time Zone Box & Alerts (Simplified)### Description
This Pine Script indicator is designed for TradingView and provides functionality for drawing time-based boxes on the chart, as well as generating alerts and labels. It is particularly useful for visualizing specific time ranges within each trading day and managing alerts based on those time intervals.
#### **Features:**
1. **Box Drawing for Specific Time Ranges**:
- **Time Interval Customization**: Allows users to specify the start and end times for the box using inputs (e.g., from 9:30 AM to 12:30 PM). The box will automatically adjust based on these times.
- **Historical Data**: The script calculates the high and low prices within the specified time range and draws a box accordingly. This box will be created for each trading day, capturing all relevant historical data within the defined time interval.
2. **Dynamic Alerts**:
- **Custom Alerts**: Users can define custom alert messages for specific times within the trading day (e.g., before and after the trading range). Alerts are triggered once per bar close at the specified times.
3. **Labels for Key Time Points**:
- **Customizable Labels**: Labels can be added at specific times to indicate important trading actions (e.g., "No Trade," "Open Trade," and "Close Trade"). The text, color, and size of these labels are customizable.
- **Label Display**: Labels appear on the chart at defined times to provide visual cues for trading decisions.
4. **Visual Customization**:
- **Box and Label Colors**: Users can choose colors for the box and labels to match their preferences or trading setup.
- **Box Transparency**: The box can be customized with varying levels of transparency to enhance chart visibility.
#### **Usage:**
1. **Set Up Time Intervals**: Define the start and end times for the box using the input fields. Adjust these settings to fit your trading strategy and time zones.
2. **Adjust Alerts and Labels**: Customize the alert messages and label text to fit your trading plan.
3. **Apply to Chart**: Add the script to your TradingView chart to visualize the time-based boxes, receive alerts, and see the labels.
This script helps traders visually identify significant time ranges within the trading day and receive timely alerts and labels, enhancing their decision-making process.

SMA Table with Alerts and Intersections🌟 **Presenting the Dynamic SMA Intersection Alert Indicator!** 🌟
### **Overview:**
The Dynamic SMA Intersection Alert Indicator is a sophisticated tool developed for traders seeking simplicity and effectiveness. It integrates multiple Simple Moving Averages (SMA) to deliver real-time alerts and visual cues, enabling traders to identify potential market entry points with ease.
### **Features:**
1. **Multi-SMA Visualization:**
- Incorporates four SMAs: 8, 20, 50, 200 periods.
- Displays a customizable table showing the current value of each SMA.
2. **Alerts in Real-Time:**
- Provides instant notifications for price crossings over any of the SMAs.
- Offers customizable alert messages.
3. **Visualization of Intersection Points:**
- Displays green triangles for bullish crosses and red for bearish, directly on the chart.
- Allows for the identification of precise intersection points between shorter-term and longer-term SMAs.
### **Benefits:**
- **Informed Decision-Making:** Enables quick discernment of market trends.
- **Efficiency:** Automates the tracking of SMA intersections.
- **User-Friendly:** Applicable for both novice and experienced traders.
### **How It Operates:**
- The indicator computes four different SMAs and presents their current values systematically.
- It triggers a real-time alert when the price crosses any SMA, instantly notifying the trader.
- Visual cues are plotted on the chart when any two SMAs intersect, indicating the type of cross.
### **Enhance Your Trading Experience!**
The Dynamic SMA Intersection Alert Indicator is designed to refine your trading experience and assist in making informed and timely trading decisions. Leverage this tool to stay abreast of market trends and enhance your market understanding!
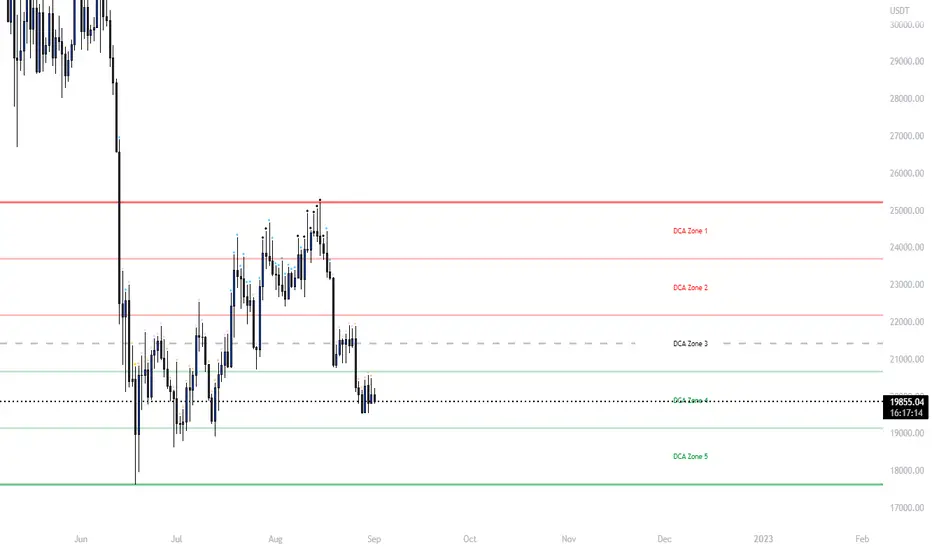
Ultimate Grid Tool + Alerts (DCA & Limit Orders) [enzedengineer]Overview
The "Ultimate Grid Tool + Alerts" script works much like a grid bot from automated trading services such as 3Commas making it a good free alternative with some extra utility.
How it works
The user is prompted to set up a grid by manually defining a lower and upper range and then by selecting how many grid segments they want (max 20). The script will automatically create equally spaced grids within this defined range. The script has built in alerts which are intended to be used in conjunction with a third-party application to execute buy and sell orders on an exchange.
The script has two alert functionalities to choose between:
Limit orders (like traditional grid bots) or;
DCA zones (time-based)
DCA zones:
This is the default selection. Each zone has its own alert condition which is triggered if the price closes within that zone. The frequency of the alert is determined by the user's chart resolution, therefore you can have the alert trigger every day, or 4 hours, or 30 minutes and so on. This allows for flexibility, for example, you could go from DCA'ing at $20 per day at higher prices to $100 per day as the price drops into the lower end of your grid range.
Limit orders:
This mode is selected by checking the "Limit Order" box. As mentioned earlier, this mode works like traditional grid bots with each grid line representing a limit order. The alert condition is met when ta.cross(close, gridline) = true.
Buy and Sell:
This mode is selected by checking the "Buy and Sell" box. This is a visual modification only which changes the colour of the grids to help plan the user's trading. Please note, there is no buying or selling logic within the script itself - this should be built into the alert message to be used with a third-party application for exchange order execution.
Use case: The author of this script has been using it with the default settings to DCA into Bitcoin in the current bear market. Using a chart resolution of 15 minutes the script purchases x-amount of Bitcoin every 15 minutes (Alertatron executes the exchange orders). This method provides a well blended average price and takes away the internal conundrum of "should I buy some today". No matter what, the bot will make a purchase within at least 15 minutes of the ultimate Bitcoin bottom and arguably this gives a psychological edge and reduces FOMO (fear of missing out).