ADVANCED EMA RIBBON SUITE PRO [Multi-Timeframe + Alerts + Dash]🎯 ADVANCED EMA RIBBON SUITE PRO
📊 DESCRIPTION:
The most comprehensive EMA Ribbon indicator on TradingView, featuring 14 customizable
EMAs (5-200), multi-timeframe analysis, gradient ribbon visualization, smart alerts,
and a real-time dashboard. Perfect for trend following, scalping, and swing trading.
🔥 KEY FEATURES:
• 14 EMAs with Fibonacci sequence option (5, 8, 13, 21, 34, 55, 89, 144, 200)
• Multi-Timeframe (MTF) analysis - see higher timeframe trends
• Dynamic gradient ribbon with trend-based coloring
• Golden Cross & Death Cross detection with alerts
• Professional themes (Dark/Light) with 6 visual styles
• Real-time information dashboard
• Customizable transparency and colors
• Trend strength visualization
• Price position analysis
• Smart alert system for all major crossovers
📈 USE CASES:
• Trend Identification: Ribbon expansion/contraction shows trend strength
• Entry/Exit Signals: EMA crossovers provide clear trade signals
• Support/Resistance: EMAs act as dynamic S/R levels
• Multi-Timeframe Confluence: Combine timeframes for higher probability trades
• Scalping: Use faster EMAs (5-20) for quick trades
• Swing Trading: Focus on 50/200 EMAs for position trades
🎯 TRADING STRATEGIES:
1. Ribbon Squeeze: Trade breakouts when ribbon contracts
2. Golden/Death Cross: Major trend reversals at 50/200 crosses
3. Price Above/Below: Long when price above most EMAs, short when below
4. MTF Confluence: Trade when multiple timeframes align
5. Dynamic S/R: Use EMAs as trailing stop levels
⚡ OPTIMAL SETTINGS:
• Scalping: 5, 8, 13, 21 EMAs on 1-5 min charts
• Day Trading: Full ribbon on 15-60 min charts
• Swing Trading: Focus on 50, 100, 200 EMAs on daily charts
• Position Trading: Use weekly timeframe with monthly MTF
📌 KEYWORDS:
EMA, Exponential Moving Average, Ribbon, Multi-Timeframe, MTF, Golden Cross,
Death Cross, Trend Following, Scalping, Swing Trading, Dashboard, Alerts,
Support Resistance, Fibonacci, Professional, Advanced, Suite, Indicator
*Created using PineCraft AI (Link in Bio)
在脚本中搜索"alert"

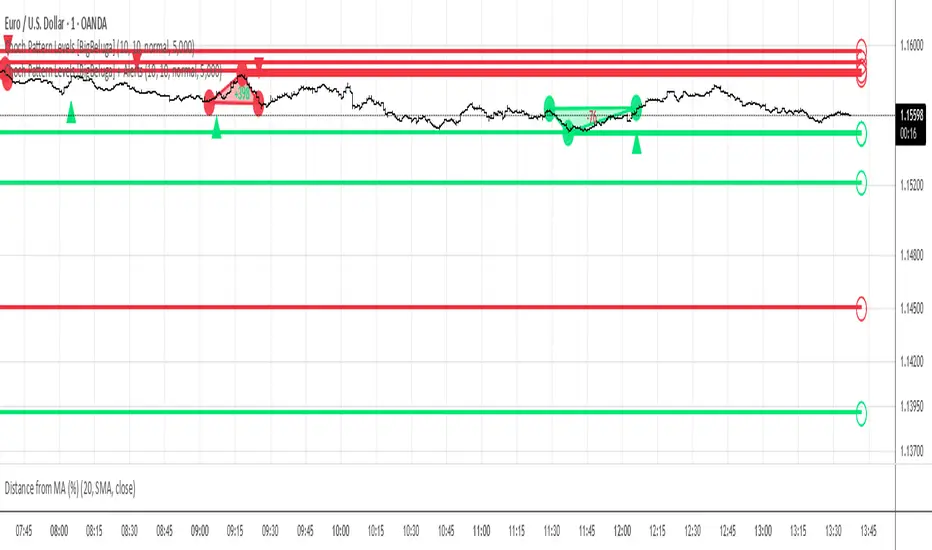
Choch Pattern Levels [BigBeluga] + AlertsThis version of Choch Pattern Levels includes built-in alert conditions for both ChoCh Up and ChoCh Down patterns. You can now set TradingView alerts directly when either pattern occurs, with optional visual markers (triangles) plotted on the chart.
Based on the original script by BigBeluga, licensed under CC BY-NC-SA 4.0. This is a modified version with alert conditions added.
SMA50 - Relleno + AlertasThis is about the 50 SMA and its relationship to price. When the price is above the 50 SMA, it is colored green, indicating a bullish trend. If the price is below the 50 SMA, it is colored red, indicating a bearish trend. It also has alerts when the trend crosses the 50 SMA.

VWAP Combo: Bands + MACD + Volume + AlertsBands: These are dynamic bands using a 20-period standard deviation and 1.5× width by default. Adjust lookback or bandMultiplier to tighten or widen.
Candle Colors: Green = MACD bullish, Red = bearish.
Volume Spike: Orange triangle when volume > 1.5× average.
Alerts: Fire on breakout, bounce, or combo confirmation.

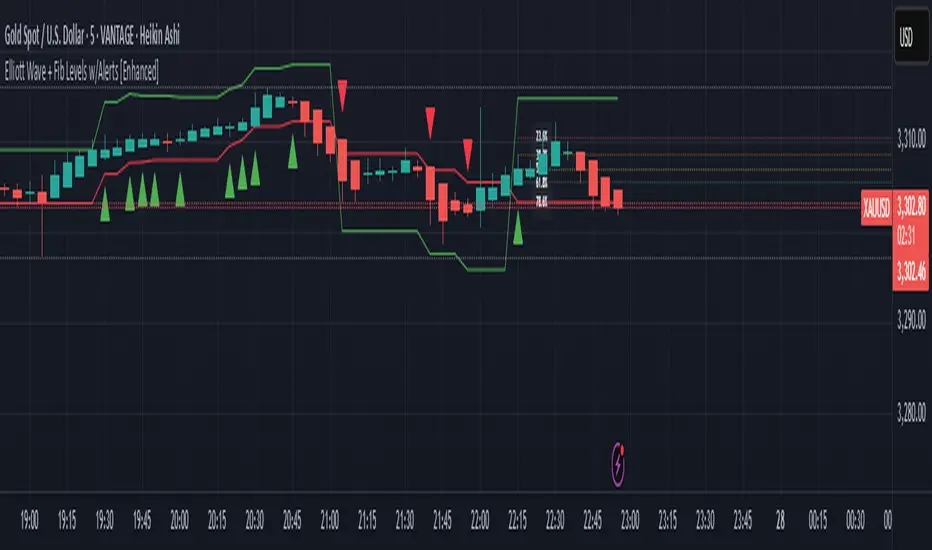
Elliott Wave + Fib Levels w/Alerts [Enhanced]Elliott Wave + Fibonacci Levels with Alerts
This powerful TradingView indicator combines Elliott Wave detection with customizable Fibonacci retracement levels to help identify key price zones and potential trade opportunities. It automatically detects bullish and bearish waves based on recent highs and lows, with an optional EMA filter to improve trend accuracy.
Key features include:
Dynamic detection of Elliott Waves based on configurable wave length.
Visualization of Fibonacci retracement levels on detected waves, with customizable percentage levels and optional labels for clarity.
ATR-based automatic calculation of stop loss and take profit levels with adjustable multipliers.
Real-time alerts triggered on new wave formations, indicating bullish or bearish setups with precise entry price details.
Clean plotting of entry signals, stop loss, and take profit zones directly on the chart.
User-friendly input controls to tailor the indicator to your trading style, including options to toggle EMA filtering, Fibonacci level display, and alert activation.
Ideal for traders looking to combine classic wave analysis with Fibonacci support/resistance levels and actionable trade alerts, this indicator streamlines technical analysis and trade management in one easy-to-use tool.
RSI Crossover Signal Companion - Alerts + Visuals🔷 RSI Crossover Signal Companion — Alerts + Visuals
The Relative Strength Index (RSI) is a momentum oscillator that measures the speed and change of recent price movements. It helps traders identify overbought or oversold conditions, possible trend reversals, and momentum strength.
This utility builds on TradingView’s classic Relative Strength Index (RSI) by adding real-time alerts and triangle markers when the RSI crosses its own moving average — a common technique for early momentum detection.
It is designed as a lightweight, visual companion tool for traders using RSI/MA crossover logic in manual or semi-automated strategies.
🔍 Features
✅ Preserves the full original RSI layout, including:
• Gradient fill and overbought/oversold zones
• Standard RSI input settings (length, source, etc.)
• MA smoothing options with user-defined type and length
🔺 Adds visual triangle markers:
🔼 Up triangle when RSI crosses above its MA
🔽 Down triangle when RSI crosses below its MA
📢 Built-in alerts for RSI/MA crosses:
“RSI Crossed Above MA”
“RSI Crossed Below MA”
📈 How to Use
This script is ideal for:
• Spotting early momentum shifts
• Confirming entries or exits in other systems (price action, trendlines, breakouts)
• Building alert-based automation (webhooks, bots, etc.)
Popular use cases:
• Combine with trend indicators like MA200 or MA12
• Use in confluence with price structure and divergence
• Validate breakout moves with momentum confirmation
⚙️ Customization
RSI length, MA length, MA type, and source are fully adjustable
Triangle marker size, shape, and color can be edited under Style
Alerts are pre-built and ready for use

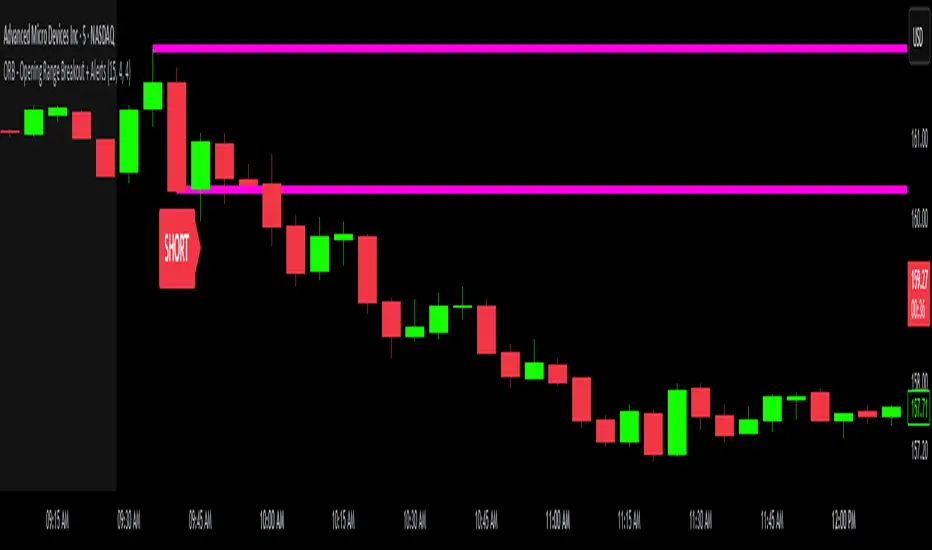
ORB - Opening Range Breakout + AlertsThe only ORB indicator you'll ever need.
- Flexible Range: Tailor the opening range (e.g., 5m, 15m, 30m) to your trading style.
- Key Levels: Auto-plots striking pink/purple support/resistance lines post-range for clear trade setups.
- Breakout Alerts: Reliable LONG/SHORT signals on 5m chart for confirmed breakouts; enable/disable as needed.
- Personalized Design: Customize line color and thickness for optimal visibility.
A friendly reminder that no tool or indicator guarantees success. Integrate this into a robust trading plan.
ICT iFVG Detector and Alert [by ote618]Description
This script detects ICT - fair value gaps (FVG) formed by price gaps between Candle 1 and Candle 3, then monitors the next 5 candles for an inverse fair value gap (iFVG).
What It Detects
Bullish FVG: When Candle 1 high is below Candle 3 low (BISI)
Bearish FVG: When Candle 1 low is above Candle 3 high (SIBI)
Once an FVG is detected, the script checks the next 5 candles:
A Bullish FVG becomes a Bearish IFVG if price closes below Candle 1 high
A Bearish FVG becomes a Bullish IFVG if price closes above Candle 1 low
Only the first bar that validates the FVG triggers the transition to an IFVG.
Visual Output
A shaded rectangle is plotted to mark the original FVG zone (from Candle 1 to Candle 3)
Color-coded:
Red for Bearish IFVG (validated Bullish IG)
Green for Bullish IFVG (validated Bearish IG)
The rectangle extends from Candle 1 to the validating bar
Alerts
You can receive alerts when an FVG becomes an IFVG:
Configurable to fire only on selected timeframes (1m, 5m, 15m, 60m)
Alerts include the direction and the chart timeframe
Settings
Enable Alerts For Timeframe: Choose which timeframe(s) trigger alerts
This tool helps traders identify inverse FVGs (iFVG), a useful ICT concept.

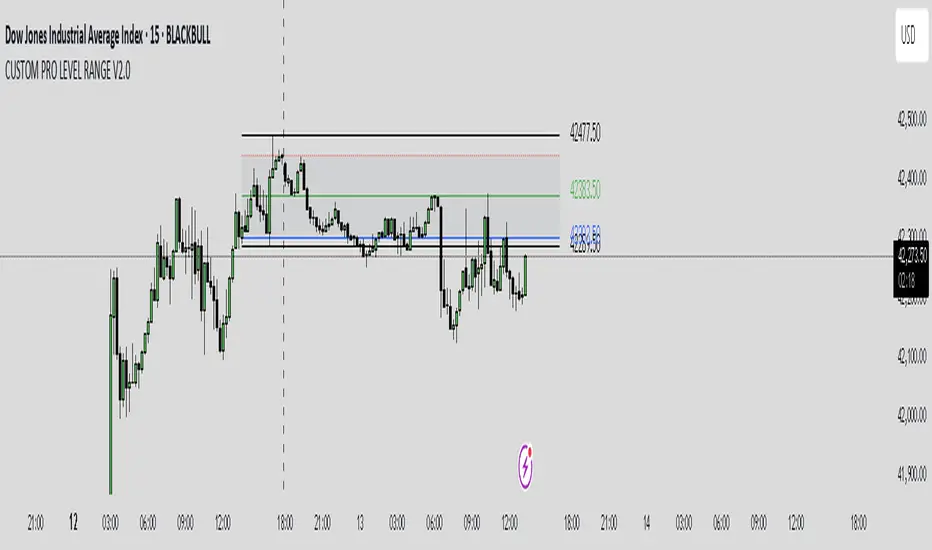
CUSTOM PRO RANGE V2.0 with AlertsCore Functions
Tracks High/Low Ranges
Daily (DR) or Initial (IDR) ranges within custom time windows (e.g., 9:30 AM–4:00 PM).
Optional extended hours (e.g., overnight).
Visual Tools
Draws boxes/lines for range boundaries, midpoints, and opening prices.
Custom colors/styles for clarity.
Smart Alerts
Notifies when price breaks high/low/mid of the range.
Avoids spam with once-per-bar alerts.
Flexible Timeframes
Works for intraday, daily, or even quarterly ranges with minor tweaks.
🎯 Who It Helps
Day Traders: Spot breakouts/reversals.
Swing Traders: Identify key support/resistance.
Analysts: Study price behavior in specific sessions.
Air Gap MTF with alert settingsWhat it shows:
This indicator will show a horizontal line at a price where each EMAs are on on different time frames, which will remove the effort of having to flick through different time frames or look at different chart.
The lines itself will move in real time as price moves and therefore as the EMA values changes so no need to manually adjustment the lines.
How to use it:
The price gap between each of the lines are known as "air gaps", which are essentially zones price can move with less resistance. Therefore bigger the airgap there is more likely more movement in price.
In other words, where lines are can be a resistance (or support) and can expect price stagnation or rejection.
On the chart it is clear to see lines are acting as resistances/supports.
Key settings:
The time frame are fixed to: 30min, 1hr and 4hr. This cannot be changed as of now.
EMA values for each time frame are user changeable in the settings, and up to 4 different values can be chosen for each time frame. Default is 5,12,34 and 50 for each timeframe.
Line colour, thickness and style can be user adjusted. Start point for where line will be drawn can be changed in the settings, either: start of day, user defined start or across the chart. In case of user defined scenario user can input a number that specifies a offset from current candle.
Label colour, font, alignment, text size and text itself can be user adjusted in the settings. Price can be also displayed if user chooses to do so. Position of label (offset from current candle) is user specified and can be adjusted by the user.
Both the lines and labels can be turned off (both and individually), for each lines.
Alert Settings:
Manually, user can set alerts for when price crosses a specific line.
This can be done by:
right click on any of line
choose first option (add alert on...)
On the second option under condition, use the dropdown menu to choose the desired EMA/timeframe to set alert for.
Hit "create" at bottom right of option
----------------------------------------------------------------------
If anything is not clear please let me know!

Volume Candle(alerts)This indicator highlights candles with unusually high trading volume by comparing the current volume to an EMA-based threshold. It helps identify significant volume spikes, which may indicate strong market movements.
Big Volume Detection
Compares the current volume to an EMA of past volume.
A candle is marked as "Big Volume" if the current volume exceeds the EMA by a specified multiple.
Color-Coded Candles
Big Volume & Bullish → Lime Green
Big Volume & Bearish → Red
Regular Bullish → Faded Lime (80% transparent)
Regular Bearish → Faded Red (80% transparent)
Alert System
Big Up or Down Volume → Triggers an alert when high volume occurs.
Big Up Volume → Triggers an alert for high-volume bullish candles.
Big Down Volume → Triggers an alert for high-volume bearish candles.
Customizable Settings
Period → EMA period for volume comparison (Default: 30)
Big Volume Multiple → Volume multiplier threshold for detection (Default: 3)
Use Cases
Spot unusual volume surges before major price moves
Confirm strong buying or selling pressure
Identify potential breakout zones

Hammer and Shooting Star Alerts - FrmRisk2RichesThis custom Pine Script indicator helps traders identify potential reversal signals in the market by detecting the formation of Hammer and Shooting Star candlestick patterns on multiple timeframes. The indicator automatically analyzes the 1-minute, 5-minute, 15-minute, and 30-minute charts, alerting you when a Hammer or Shooting Star candle forms on any of these timeframes.

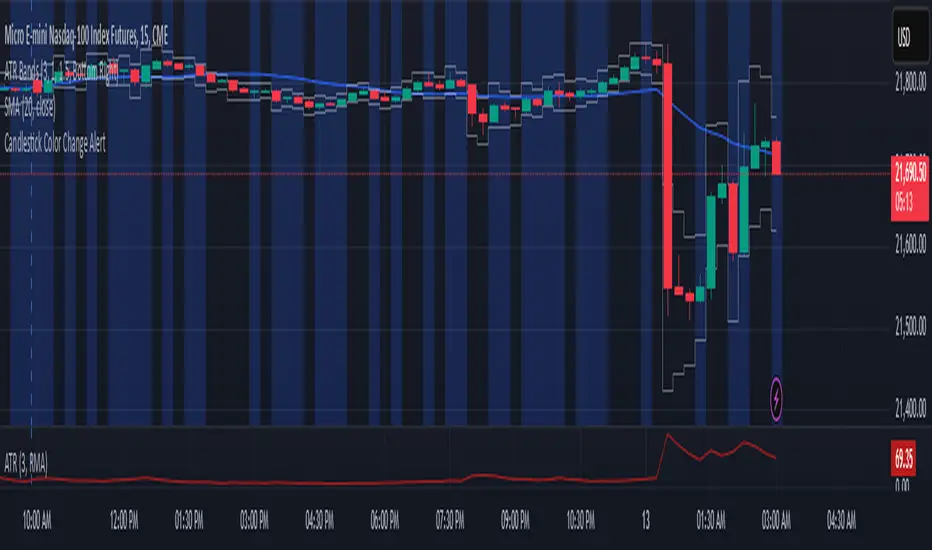
Candlestick Color Change AlertIt is an alert for change of candlestick color.
Identifies Candle Type
A candle is bullish if the closing price is higher than the opening price.
A candle is bearish if the closing price is lower than the opening price.
Detects a Color Change
The script checks if the current candle is bullish while the previous candle was bearish, or vice versa.
If a change is detected, an alert is triggered.
Triggers an Alert
Users receive an alert notification whenever a candlestick color change occurs.
Alerts can be set for popup, email, mobile push, or webhook notifications.
Visual Highlighting (Optional)
The script can also apply a background color (blue) on the chart to visually mark color changes.
v01 remindersTrading requires focus, discipline, and sometimes a reminder to stay on track.
Many of us know how to take trades and make money - but sometimes struggle to hold on to the gains. By knowing not only when to trade, but also when NOT to trade, we can begin to build better habits.
I built this indicator for my own needs, but I hope this indicator can help someone save money by reminding them when to step away, size down or stay on track.
Inspired by trading psychologists like Mark Douglas, David Paul and others, I decided to make an indicator that deals with the mental aspect of trading.
Dr. David Paul said that you can be 10-15 trades away from the trader you want to be. All it takes is 10-15 trades of doing only the right thing (erasing bad habits). After that time the resistance to execute the trades properly will improve even more.
Good trading should be boring and repetitive. If the trading is exciting and varied it is likely unprofitable (more akin to impulsive gambling).
Perhaps you know how to trade, yet keep trading impulsively sometimes, getting "the itch" to trade or gambling with your gains? Set some reminders and see if you can build better habits. Over time it could make a difference.
You can enable up to 10 different reminders with each instance of the indicator. You can select days of the week and time of day. The visibility is fully customizable to suit any colour theme you may want. They dont actually alert - its a silent visual reminder, which is less intrusive and stays on screen for as long as you want.
Remind yourself when CPI releases or bond auctions are about to hit.
Don't get caught off guard by FED speakers or FOMC announcements.
Manage your emotions by writing a motivational reminder.
Build better habits and stay disciplined with reminders not to gamble.
Remind yourself to stay away from the markets when there is low liquidity, and trade during your best hours.
Wait for the market to establish balance and let the text show when to either wait or when to start trading.
Some basic inspiration:
"FOMC - No trading!"
"CPI Data - Expect Volatility"
"Markets closed tomorrow - Plan ahead"
"Take it slow, it's a marathon, not a sprint." - Dakota
"Wait for cheap risk" - HOAG
"Don't diddle in the middle!" - Brian Watts
You can of course write anything you want. Maybe you would like to remind yourself of a specific algo in crude oil or gold, or have other motivational reminders that work for you. If you have any good suggestions put them in the comments for others to use.
You can also use the script to watermark or put a web link on your charts. The indicator is empty by default - the image is just an example of the different types of labels it can show.
Customize the reminders for specific days, times, and events. Position them anywhere on your chart to suit your workflow. Whether you're a day trader or a long-term investor, theres always things to improve. This lets you keep those reminders right on your charts. You can go into the object tree settings and drag the indicator to the top if you want it to hide the candlesticks, and size up the text to really make it cover the chart for when to really stay away, as in the "FOMC" example in the image. The sample image shows a couple of different labels - but the script has no texts by default. It is up to you what to write and what colours to use. Please share it with others that may benefit.
You can add the script more than once if you need more than 10 alerts. You can also use it on multiple panels in TradingView, and it will remember the reminders for each panel. You can use spaces when positioning text in the top and bottom left corners of the screen, where there is sometimes a logo or ticker name obscuring the text. If two reminders display in the same location it will default to show the higher number of the two. Use specific times to change the reminders to make sure they dont overlap if they have the same position and put them on multiple charts if needed.
This script is dedicated to Brian Watts, who started something in me when he kept repeating "Don't diddle in the middle!" and "Where is purple?". IYKYK. I would like to thank him for the inspiration to better myself.
As above, so below.
v01

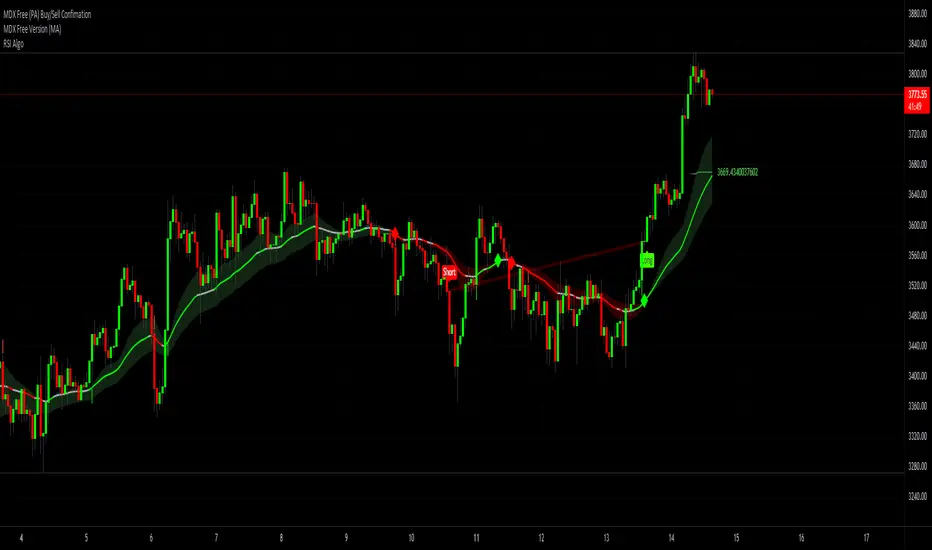
Contrarian Donchian Channel Indicator with Alerts and VisualsTitle: Contrarian Donchian Channel Indicator with Alerts and Visuals
Description:
The Contrarian Donchian Channel Indicator is designed for traders who seek to implement a contrarian approach using the time-tested Donchian Channel method. This indicator not only signals potential entry points but also enhances trading visualization by marking hypothetical stop loss and take profit levels.
Key Features:
Donchian Channel Signals: Utilizes the Donchian Channel to identify potential reversal points in the market. The indicator generates buy signals when the price touches or breaches the lower band, suggesting a potential upward reversal. Conversely, sell signals are generated when the price touches or exceeds the upper band, indicating a possible downward reversal.
Pause After Stop Loss: Incorporates a unique feature that pauses signal generation for a user-defined number of candles after a stop loss is hit. This helps in avoiding immediate re-entries in volatile market conditions.
Stop Loss and Take Profit Visualization: For each signal, the indicator draws dashed lines on the chart to represent the hypothetical stop loss (red) and take profit (green) levels. These levels are calculated based on user-input percentages for stop loss and the risk-reward ratio.
Alerts for Entry Signals: Traders can set up alerts for buy and sell signals, allowing them to stay informed of potential trading opportunities.
How to Use:
Entry Signal: A triangle symbol (green for buy, red for sell) accompanied by an alert (if set) indicates a potential entry point.
Stop Loss and Take Profit Lines: Use the drawn lines as a guide for setting stop loss and take profit levels if the signal aligns with your trading strategy.
Pause Feature: After a stop loss is triggered, observe the pause period before considering new signals to avoid overtrading in choppy markets.
Suitable For:
Traders who prefer a contrarian approach.
Those who use Donchian Channels as part of their trading strategy.
Traders who appreciate visual aids for better decision-making.
Customization Options:
Length of the Donchian Channel.
Risk/Reward Ratio.
Stop Loss Percentage.
Pause duration after a stop loss is hit.
DISCLAIMER:
This indicator is intended for educational and informational purposes only and should not be construed as financial advice. Trade responsibly and always consider your risk tolerance and investment objectives.

Candle Close AlertCandle Close Alert (CCA) :
The "Candle Close Alert" (CCA) is a custom technical analysis tool. It operates as an overlay on price charts and serves to detect and notify users about significant changes in consecutive candle closes. The script calculates the difference between the closing price of the current candle and the previous candle, referred to as the "close difference." It then compares this close difference against a user-specified threshold value.
When the close difference exceeds the threshold, the script triggers an alert, notifying users of a potential noteworthy event. This alert can serve as a prompt for traders and investors to investigate the current price action further or to consider possible trading decisions .
Additionally, the script enhances visualization by plotting the close differences on the price chart. Positive close differences exceeding the threshold are plotted in green, while negative close differences exceeding the threshold in magnitude are plotted in red. This color-coded visualization helps users quickly identify periods of significant price movement and potential market trends.
However, it's important to note that the CCA script is a standalone tool and should be used in conjunction with comprehensive market analysis. Trading decisions should not be solely based on the alerts and visualizations provided by this script. Instead, they should be considered within the broader context of other technical indicators, fundamental analysis, and risk management strategies. Enjoy it!

Multiple Indicator 50EMA Cross AlertsHere’s a screener including Symbol, Price, TSI, and 50 ema cross in a table output.
The 50 Exponential Moving Average is a trend indicator
You can find bullish momentum when the 50 ema crossed over or a bearish momentum when the 50 ema crossed under we are looking to take advantage by trading the reversion of these trends.
True strength index (TSI) is a trend momentum indicator
Readings are bullish when the True Strength Index shows positive values
Readings are bearish when the indicator displays negative values.
When a value is above 20, we look for selling overbought opportunity and when the value is under 20, we look for buying oversold opportunity.
You can select the pair of your choice in the settings.
Make sure to create an alert and choose any alerts then an alert will trigger when a price cross under or cross over the 50 ema for every pair separately.
This allow the user to verify if there is a trade set up or not.
Disclaimer
This post and the script don’t provide any financial advice.

Auto Fibonacci From Previous High & Low w/ Percentages & AlertsAUTO FIBONACCI FROM PREVIOUS D/W/M/Q/Y HIGH & LOW WITH PERCENTAGES & ALERTS
This is an auto fibonacci level generating indicator that uses the high and low from the previous day, week, month, quarter or year. It also has a table with real time updates of how far away the nearest fibonacci levels are above and below the current price, represented in percentages. It includes alerts for each level as well if you want to be notified of price crossing fibonacci levels without watching the chart.
***HOW TO USE***
Fibonacci levels are also known as the golden ratio and are popular levels for traders to use as support and resistance levels. Expect price to bounce off of these levels regularly.
The previous high and low are marked as white lines. These are very important levels so make sure to pay attention when price reaches these lines.
Make sure to check out the higher timeframes for major levels.
Each fibonacci line retracement and extension up to the 3.272 level in each direction is displayed as red or green depending on whether price is above or below that level.
The retracement levels used are: previous high, .117, .236, .382, .5, .618, .786, .883, previous low, 1.272, 1.618, 2, 2.272, 2.618, 3 and 3.272.
The extension levels used are: .272, .618, 1, 1.272, 1.618, 2, 2.272, 2.618, 3 and 3.272.
In the indicator settings input tab you can quickly change the timeframe used, turn lines on/off, upper line colors, lower line colors, previous high and low line colors, line width, turn percentage table on/off, change the color of the percentage table and move the percentage table to a different location on the chart.
The indicator includes alerts for each fibonacci level as well, just set your fibonacci timeframe on your favorite ticker and turn on tradingview alerts for alert() calls.
***MARKETS***
This indicator can be used as a signal on all markets, including stocks, crypto, futures and forex.
***TIMEFRAMES***
This auto fibonacci indicator can be used on all timeframes.
***TIPS***
Try using numerous indicators of ours on your chart so you can instantly see the bullish or bearish trend of multiple indicators in real time without having to analyze the data. Some of our favorites are our Buy & Sell Pressure Colored Candles, Directional Movement Index + Fisher Transform, Volume Profile W/ Buy & Sell Pressure Labels, Auto Support And Resistance and Money Flow Index in combination with this Auto Fibonacci. They all have real time Bullish and Bearish labels or percentage gap info as well so you can immediately understand each indicator's trend and how far away major levels are in percentages.

3MA Proximity AlertScript for alerting when:
A) Price
B) 20 SMA
C) 200 SMA
D) 1 Support or Resistance line
Are all in proximity to each other at the same time.
RSI Algo (Pinescript v5 + Alerts)Found this the other day and thought it might be useful to have an updated version with alerts:
Credit to the original author.
Smoothed Wave ScalperThis one is a little different.
Instead of layering lots of indicators to filter noise, I'm instead using two different kinds of price averaging to smooth the candles and better define the direction. Just select a smoothing value that fits your chart and timeframe. In theory, this should remove a fair bit of noise (although nothing's perfect)
I've managed to determine when the candles change colour, signifying a potential new trend. When the candle colours do change, an alert is fired. It's as simple as that! Wyckoff wave volume analysis is then applied to each alert to validate the move. Further filtering can be achieved using heikin ashi candles if this is your preference.
Alerts are built in for both the candle colour change and the wave filtered signals (long/short). Use long/short for entries and the colour changes for exits.
I'm currently trading with linear regression to help indentify obvious channels and areas of support/resistance. The candles bouncing down off of the upper band can confirm a downward trend, and bouncing off of the lower band can signify an up trend. It's much easier to see with smoothed candles like these and can give you confidence when trading manually. These bands are rendered automatically, but aren't essential to taking a trade.

TWP Next Bar Close Countdown█ OVERVIEW
This script displays the time remaining for your charts current timeframe.period or a higher timeframe with the ability to create alerts that ping on the opening of the new bar that you have selected. It can be very easy to get bogged down in the charts when day trading on smaller timeframes and forgetting that it is the wave of longer timeframe traders that are setting the tone. This script was born out of this pitfall that I was noticing in my own trading.
█ CONCEPTS
The script uses a series of functions to get produce the time remaining and texts for the top and bottom rows within the table display.
█ FEATURES
1 — Resolution
• Auto / Manual selection
• There is tooltip explains how the automatic time selection operates (see below)
AUTO_TIMEFRAME_TOOLTIP = "When the Auto option is selected, the timeframe of the indicator is chosen automatically based on the chart timeframe. The Timeframe dropdown is ignored. The automated timeframes are: \n
'10 minutes' for any chart timeframes below '1 minute' \n
'1 hour' for any chart timeframes starting from '1 minute' up to '5 minutes'
'4 hours' for any chart timeframes starting from '5 minutes' up to '60 minutes' \n
'1 day' for any chart timeframes starting from '1 hour' up to '4 hours' \n
'1 week' for any chart timeframes starting from '4 hours' up to '1 day' \n
'1 month' for any timeframes starting from '1 day' up to '1 week' \n
'3 months' for any timeframes starting from '1 week' up to '1 month' \n
'12 months' for any timeframes above '1 month'"
2 — Text
• Size selection
• Color selection
3 — Display
• Frame color selection
• Display position selection
4 — Alerts
• Market session selection
█ HOW TO USE
• Add it to your chart, select your timeframe, change up your colors, and enjoy yourself
█ NOTES
• We have no control over when realtime updates occur. A realtime bar can open, and then no realtime updates can occur until the open of the next realtime bar. The time between updates can vary considerably. For more please check out Pine's execution model and bar states.
• As a reminder, I did make this script for myself so if you find that you are using a 2-hour alert or countdown the formatting for the words may not be succinct as they should be. We will write that loss off to my growing pine skills
█ LIMITATIONS
• You will not be able to retrieve the time from a timeframe smaller than what is currently selected for the chart.

Dump AlertsNYSE:BRK.B
By popular demand: An inverted version of my first indicator Pump Alerts in Pine Script with two alert conditions for trading bots and automated stock trading setups.
It's originally based on "Pump Catcher" by @joepegler
I modified some parts, hopefully improved the usability and enabled alerts, so you can use it to trigger bots like 3commas via webhooks or stock brokers partnering with TradingView.
Dump Alerts 📉 attempts to detect moments of abnormal and accelerating increase in volume concurrent with falling prices AKA "dumps". Small and big dumps.
I recommend trying different timeframes and tinkering with the lookback period as well as both threshold values.
Other than that it's pretty self-explanatory and beginner-friendly.
Free and Open Source. Let me know how you use it!
