ATR Z ScoreThis script normalizes ATR to a Z Score, or a number of standard deviations it is from its long term average, positive or negative. Pine Script®指标由jwammo12提供22123
ATR * 1.5 FX Stop LossPlots two lines to help with back testing strategies assuming a Stop less set at ATR*1.5Pine Script®指标由callmeburton提供1179
ATR TrueThis is True Average True Range, ((Hi-Low)/Lenght), Lenght (1,2 and more), no EMA, SMA etc. Only based on Hi/Low Lenght. Why Is all ATR bulish there is not correctly? Pine Script®指标由ALEX-Z提供11
ATR Ranging market backgroundJust publishing a separate indicator from my ATR & RSI indicator if ever you liked to analyze and use them separate. Have a nice dayPine Script®指标由S6thSense提供1129
ATR and VIX For Profit Target and RSI LimitThe red line, based on ATR, should be used as a percentage gain goal. So I will set my profit targets based on this percentage. The grey line is based on William's VIX and I use it to judge what RSI I should sell at.Pine Script®指标由atlas_crypto提供1186
ATR adjusted MACDWhen running MACD, it can be useful to compare the value of the MA difference to other values. In other words, is a particular stock or futures contract at a more extreme MACD value than another. This can be done by dividing by the price, however, that doesn't adjust for volatility differences. Using ATR, one can adjust for price and volatility at the same time, allowing comparisons between securities more easily.Pine Script®指标由fxfool提供4451
ATR Trailing Stop Bands Strategy [R] Originally based on a script by HPotter for an ATR Trailing Stop, which itself was based on an article by Sylvain Vervoort, but I adapted it to add Bands, to add extra optional Wick Protection, and have now made it a Strategy. It's not great for entries/exits, but as a Trailing Stop that can let winners ride, it's great.Pine Script®策略由rthomson提供66378
ATR Stretched Market [zauoyds]This indicator verify the close in comparison with EMA21. If the number is higher than 2ATR, the X is ploted above the candle. Avoid positions when the candle is marked. The best entries always will be close to the averages. You can change the values through the inputs, according with your trade system.Pine Script®指标由rbrossi提供1157
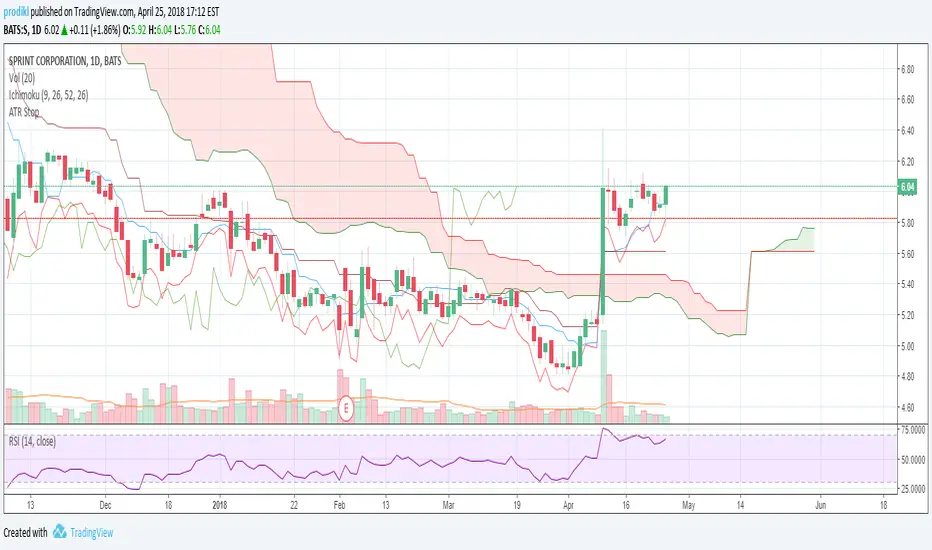
ATR Stop LossAdds an indicator that can be used to set stop losses. This is the close price minus the ATR + 10%. The 10% is there to let the market perform and avoid whipsaws.Pine Script®指标由prodikl提供已更新 11308
ATR on ChartPlots the ATR on the chart for easy visualization, default TF is the Daily but you can alter it.Pine Script®指标由wpatte15提供44184
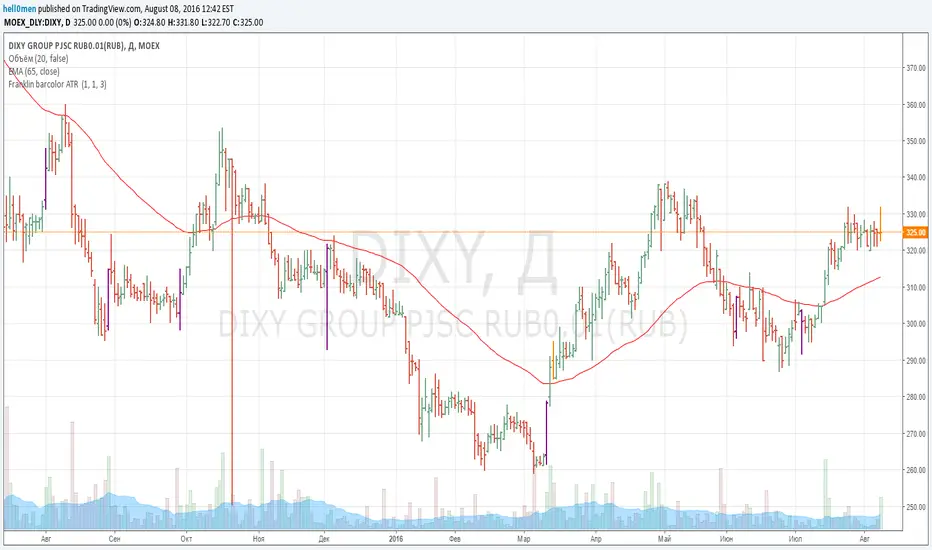
Franklin ATR Bar highlight by els (robotfarm.ru)Script highlights signal bars for tfc3.ru school trading strategy. Working timeframe D. Pine Script®指标由hell0men提供47
ATR Pips [LazyBear] [Elixium Mod: FEAR GAUGE]Modified version of ATR Pips The indicator's value is a third of the daily range which is good to use as a stop loss value for intra day scalping on markets such as index futures and forex. It's good for detecting and confirming inflection points in the market.Pine Script®指标由Elixium提供22484
Rolling Trendline [LuxAlgo]The Rolling Trendline indicator provides a dynamic, self-adjusting trendline that tracks price action using linear regression slope projections and automatically resets when price deviates beyond a specific threshold. 🔶 USAGE The indicator is designed to provide a continuous trend bias without the "lag" often associated with static linear regression lines. It projects a line forward based on a calculated slope and only shifts its trajectory when the market demonstrates a significant change in momentum. The addition of ATR-based volatility zones allows traders to visualize a range of expected price action around the projected trend, providing a buffer that accounts for market volatility at the time of each trend reset. 🔹 Interpreting the Line and Zones Bullish Phase (Green): Indicates an upward-sloping trajectory. The trendline and its surrounding ATR zones will be colored green, suggesting a bullish bias. Bearish Phase (Red): Indicates a downward-sloping trajectory. The trendline and its surrounding ATR zones will be colored red, suggesting a bearish bias. ATR Zones: These shaded areas represent a volatility-adjusted range. As long as price remains within the deviation threshold, the zones follow the trendline's trajectory. Reset Points: Visualized by a small circle and a break in the line, these occur when price moves too far from the projection. At this moment, the indicator re-anchors to the current price and recalculates both the slope and the ATR zone width. 🔶 DETAILS The indicator follows a specific logic flow to maintain its "Rolling" characteristic: 1. Slope Calculation: It calculates the Linear Regression slope over a user-defined lookback period. This slope represents the average rate of change in price. 2. Projection: On every new bar, the indicator projects the next value of the trendline by adding the active slope to the previous trendline value. 3. Deviation Check: The indicator calculates a Standard Deviation threshold. If the distance between the current price and the projected trendline value exceeds this threshold, a reset is triggered. 4. Re-Anchoring: Upon a reset, the trendline "rolls" to the current price and adopts the most recent linear regression slope. Simultaneously, it captures the current ATR to set the width of the new trend zones. 🔶 SETTINGS 🔹 Trend Settings Slope Lookback: The period used to calculate the linear regression slope. Higher values result in a slope that considers more historical data. Deviation Multiplier: Determines how far price can deviate from the trendline before a reset occurs. Slope Divisor: This setting allows you to tame the trajectory of the line. Higher values divide the captured slope, resulting in flatter trendlines. Source: The price data used for all calculations (default is Close). 🔹 ATR Zones ATR Length: The lookback period used for the Average True Range calculation, which determines the width of the volatility bands. ATR Multiplier: Controls the width of the shaded zones around the trendline. 🔹 Visuals Bullish/Bearish Trend Colors: Customizes the colors for the trendline and zones based on the slope direction. Zone Color: Sets the base color for the ATR area fills. Line Width: Adjusts the thickness of the primary rolling trendline. Pine Script®指标由LuxAlgo提供1185
Renko Boxes [LuxAlgo]The Renko Boxes indicator provides an overlay-based Renko charting experience that uses Average True Range (ATR) to dynamically define brick sizes, allowing traders to filter out market noise and focus on significant price movements directly on their main candles. 🔶 USAGE Unlike traditional Renko charts that exist on a separate time-independent scale, this tool overlays Renko price levels onto the standard candlestick chart. This allows you to see how the underlying price action interacts with the Renko "bricks" in real-time. The indicator is primarily used to identify trend direction and potential reversal points. When price exceeds a specific threshold (determined by the ATR-based brick size), a new box is formed. 🔹 Trend Interpretation Bullish Trend: Represented by green boxes and a green dotted average line. This occurs when price consistently breaks above the upper threshold of the previous brick. Bearish Trend: Represented by red boxes and a red dotted average line. This occurs when price consistently breaks below the lower threshold of the previous brick. 🔹 Visual Elements The script includes several visual components to aid in chart analysis: Renko Boxes: Shaded areas representing the current price bracket. These use the __BLOCK_0__ property to ensure clean transitions without "bleeding" between different price levels. Reversal Dots: Circular markers that appear specifically when the Renko direction switches from bullish to bearish or vice versa. Average Line: A dotted line following the median price of the current Renko level, serving as a smoothed trend tracker. 🔶 DETAILS The core logic of the script relies on a calculated "Brick Size" derived from the ATR. By using ATR, the sensitivity of the Renko boxes automatically adjusts to the asset's current volatility. A reversal occurs when the price moves in the opposite direction of the current trend by a distance greater than the specified brick size. If price jumps significantly (gaps or high-momentum moves), the script is designed to calculate the number of bricks covered and adjust the levels accordingly to maintain price integrity. 🔶 SETTINGS 🔹 Renko Settings ATR Length: Determines the lookback period used to calculate the Average True Range, which sets the baseline for volatility. ATR Multiplier: Adjusts the sensitivity of the bricks. A higher multiplier creates larger bricks (filtering more noise), while a lower multiplier creates smaller bricks (showing more detail). 🔹 Visuals Bullish Color: Defines the color for boxes and lines when the Renko trend is up. Bearish Color: Defines the color for boxes and lines when the Renko trend is down.Pine Script®指标由LuxAlgo提供79
Dynamic Sigmoid ATR-Normalized EMA Distance OscillatorDynamic Sigmoid ATR-Normalized EMA Distance Oscillator Overview This indicator is built to evaluate trend strength and trend sustainability, not to prioritize mean-reversion calls. It measures directional pressure relative to a long-term EMA, scales that pressure by current volatility, and maps the result into a stable 0-100 oscillator using a sigmoid transform. The key advantage is dynamic adaptation: center and regime bands are not static references only, they adjust to evolving oscillator behavior. This helps separate healthy trend continuation from weak, noisy movement. Mathematical Construction (No Code Description) 1) Trend baseline: A long-horizon exponential moving average defines structural direction. 2) Signed distance: Distance = Price - EMA Positive values imply price is structurally above baseline; negative values imply below-baseline pressure. 3) Volatility normalization: Normalized Distance = Distance / ATR This makes the signal scale-aware across different volatility environments. 4) Nonlinear compression: Sigmoid(x) = 1 / (1 + e^(-k*x)) The multiplier k controls response sharpness. The output is then scaled to 0-100. 5) Dynamic center: Center = EMA of oscillator values (adaptive midpoint). Optional fixed midpoint mode is available for a classic 50-line reference. 6) Dynamic regime bands: Upper Band = Center + (StdDev of oscillator * multiplier) Lower Band = Center - (StdDev of oscillator * multiplier) These bands expand/contract with oscillator volatility, making the framework regime-aware. How to Read It (Trend-Focused) - Oscillator above dynamic center: bullish pressure dominates current regime. - Oscillator below dynamic center: bearish pressure dominates current regime. - Persistent distance from center: trend continuation probability is generally stronger. - Oscillator flattening back toward center: trend sustainability may be weakening. Long and Short Signal Framework Long setup concept: 1) Oscillator crosses above dynamic center. 2) Oscillator remains above center for multiple bars (persistence confirmation). 3) Pullbacks that hold above center and re-expand upward can be treated as continuation entries. Short setup concept: 1) Oscillator crosses below dynamic center. 2) Oscillator remains below center for multiple bars. 3) Bounces that fail near center and rotate down can be treated as continuation entries. Strength confirmation: - Rising histogram above zero supports long continuation quality. - Falling histogram below zero supports short continuation quality. Example Use Cases (Educational) Example A - Long trend continuation: - Market transitions from neutral to bullish as oscillator crosses and holds above center. - Dynamic upper band begins rising, indicating expanding bullish regime capacity. - Dips in oscillator that stay above center suggest trend remains structurally intact. Example B - Short trend continuation: - Oscillator breaks below center and stays suppressed under it. - Lower band trends down while histogram remains negative. - Failed recoveries toward center often mark lower-risk continuation timing. Example C - Potential trend fatigue: - Price makes a new directional push, but oscillator fails to sustain distance from center. - Histogram contracts progressively. - This can indicate weakening impulse and the need for tighter risk control. Why Dynamic Components Matter - A fixed 50-level alone can be too rigid when regime characteristics shift. - Dynamic center adapts to the oscillator's local equilibrium. - Dynamic bands adapt to oscillator variance, helping contextualize what is truly "extended" in current conditions. Inputs (Configurable Parameters) - EMA Length: structural trend anchor sensitivity. - ATR Length: volatility normalization depth. - Sigmoid Multiplier: nonlinear response intensity. - Use Dynamic Center: adaptive center or fixed 50 reference. - Center Length: smoothness of adaptive center behavior. - Band Length: lookback horizon for oscillator variance. - Band Stdev Multiplier: adaptive band width. - Visual toggles: gradient and table display options. Risk and Implementation Notes - This is an analytical framework, not a guaranteed signal engine. - Choppy markets can still produce false transitions. - Parameter calibration should be done per symbol and timeframe with independent testing. - Position sizing, stop logic, and risk limits remain essential. Publishing and Compliance Notes - Educational and analytical content only; not financial advice. - No guaranteed returns, no performance promises, no misleading language. - Real-world outcomes vary by market conditions, execution, and risk management. Pine Script®指标由hasanaksoy199264提供1
Average True Range Trailing Mean [Alifer]Upgrade of the Average True Range default indicator by TradingView. It adds and plots a trailing mean to show periods of increased volatility more clearly. ATR TRAILING MEAN A trailing mean, also known as a moving average, is a statistical calculation used to smooth out data over time and identify trends or patterns in a time series. In our indicator, it clearly shows when the ATR value spikes outside of it's average range, making it easier to identify periods of increased volatility. Here's how the ATR Trailing Mean (atr_mean) is calculated: atr_mean = ta.cum(atr) / (bar_index + 1) * atr_mult The ta.cum() function calculates the cumulative sum of the ATR over all bars up to the current bar. (bar_index + 1) represents the number of bars processed up to the current bar, including the current one. By dividing the cumulative ATR ta.cum(atr) by (bar_index + 1) and then multiplying it by atr_mult (Multiplier), we obtain the ATR Trailing Mean value. If atr_mult is set to 1.0, the ATR Trailing Mean will be equal to the simple average of the ATR values, and it will follow the ATR's general trend. However, if atr_mult is increased, the ATR Trailing Mean will react more strongly to the ATR's recent changes, making it more sensitive to short-term fluctuations. On the other hand, reducing atr_mult will make the ATR Trailing Mean less responsive to recent changes in ATR, making it smoother and less prone to reacting to short-term volatility. In summary, adjusting the atr_mult input allows traders to fine-tune the ATR Trailing Mean's responsiveness based on their preferred level of sensitivity to recent changes in market volatility. IMPLEMENTATION IN A STRATEGY You can easily implement this indicator in an existing strategy, to only enter positions when the ATR is above the ATR Trailing Mean (with Multiplier-adjusted sensitivity). To do so, add the following lines of codes. Under Inputs: length = input.int(title="Length", defval=20, minval=1) atr_mult = input.float(defval=1.0, step = 0.1, title = "Multiplier", tooltip = "Adjust the sensitivity of the ATR Trailing Mean line.") smoothing = input.string(title="Smoothing", defval="RMA", options= ) ma_function(source, length) => switch smoothing "RMA" => ta.rma(source, length) "SMA" => ta.sma(source, length) "EMA" => ta.ema(source, length) => ta.wma(source, length) This will allow you to define the Length of the ATR (lookback length over which the ATR is calculated), the Multiplier to adjust the Trailing Mean's sensitivity and the type of Smoothing to be used for the ATR. Under Calculations: atr= ma_function(ta.tr(true), length) atr_mean = ta.cum(atr) / (bar_index+1) * atr_mult This will calculate the ATR based on Length and Smoothing, and the resulting ATR Trailing Mean. Under Entry Conditions, add the following to your existing conditions: and atr > atr_mean This will make it so that entries are only triggered when the ATR is above the ATR Trailing Mean (adjusted by the Multiplier value you defined earlier). ATR - DEFINITION AND HISTORY The Average True Range (ATR) is a technical indicator used to measure market volatility, regardless of the direction of the price. It was developed by J. Welles Wilder and introduced in his book "New Concepts in Technical Trading Systems" in 1978. ATR provides valuable insights into the degree of price movement or volatility experienced by a financial asset, such as a stock, currency pair, commodity, or cryptocurrency, over a specific period. ATR - CALCULATION AND USAGE The ATR calculation involves three components: 1 — True Range (TR): The True Range is a measure of the asset's price movement for a given period. It takes into account the following factors: The difference between the high and low prices of the current period. The absolute value of the difference between the high price of the current period and the closing price of the previous period. The absolute value of the difference between the low price of the current period and the closing price of the previous period. Mathematically, the True Range (TR) for the current period is calculated as follows: TR = max(high - low, abs(high - previous_close), abs(low - previous_close)) 2 — ATR Calculation: The ATR is calculated as a Moving Average (MA) of the True Range over a specified period. The ATR is calculated as follows: ATR = MA(TR, length) 3 — ATR Interpretation: The ATR value represents the average volatility of the asset over the chosen period. Higher ATR values indicate higher volatility, while lower ATR values suggest lower volatility. Traders and investors can use ATR in various ways: Setting Stop Loss and Take Profit Levels: ATR can help determine appropriate stop-loss and take-profit levels in trading strategies. A larger ATR value might require wider stop-loss levels to allow for the asset's natural price fluctuations, while a smaller ATR value might allow for tighter stop-loss levels. Identifying Market Volatility: A sharp increase in ATR might indicate heightened market uncertainty or the potential for significant price movements. Conversely, a decreasing ATR might suggest a period of low volatility and possible consolidation. Comparing Volatility Between Assets: Since ATR uses absolute values, it shouldn't be used to compare volatility between different assets, as assets with higher prices will consistently have higher ATR values, while assets with lower prices will consistently have lower ATR values. However, the addition of a trailing mean makes such a comparison possible. An asset whose ATR is consistently close to its ATR Trailing Mean will have a lower volatility than an asset whose ATR continuously moves far above and below its ATR Trailing Mean. This can help traders and investors decide which markets to trade based on their risk tolerance and trading strategies. Determining Position Size: ATR can be used to adjust position sizes, taking into account the asset's volatility. Smaller position sizes might be appropriate for more volatile assets to manage risk effectively. Pine Script®指标由AliferCrypto提供11178