HFT Momentum BacktesterDefault Settings are meant to be used in XBT/USD chart on 1 hour time frame. If you want to use for another asset on another time frame YOU MUST CHANGE THE SETTINGS
This is momentum-based strategy designed by HFT Research in order to take advantage of volatile, trending markets.
Use ADX
ADX stands for average directional index . It is an indicator that measures volatility in the market. Unfortunately, the worst market condition for this strategy is sideways market. ADX becomes a useful tool since it can detect trend. If the volatility is low and there is no real price movement, ADX will pick that up and will not let you get in trades during a sideways market. It will allow you to enter trades only when the market is trending.
Use MA CrossOver
This strategy’s main driver is the moving average cross over however, unlike many other indicators, this strategy has ALL the moving averages that are on trading view. Total of 13 different moving averages all calculated in a different fashion available in a drop-down menu. You are able to choose two different moving averages to cross for your entry as well as being able to adjust the length of each individual moving average.
Use MA Spread % Filter
As an extra protection, we introduced MA spread % filter. We all know that momentum strategy works when there is actually a trend that has momentum. When there is no trend and market side choppy, we get a lot of noisy signals. In order to battle that we have introduced MA spread % filter. Using this piece of setting, you will be able to chose how strong the cross over actually is. If price is moving sideways, the moving averages will cross each other barely. If the price has actually any steam and momentum, MA 1 will cross over MA 2 aggressively because it will be trending market.
First you chose what the minimum % difference there should be between your 2 moving averages. If you keep this too tight, it won’t be as useful and if you keep this too large then the script will not generate any signals. Trust us, there is a fine balance in between! Then you proceed to chose your moving averages that the bot should keep track of.
Check our website for more information.
Backtest assumes the following;
You have 1000$ to trade
You use 1% of your capital on cross margin with 1% Stop Loss. Therefore, every trade has 100% equity effect on your balance and 1% stop loss has 1% loss effect
0.06% commission taking Binance as base. Please change commission if you are using another exchange.
在脚本中搜索"backtest"

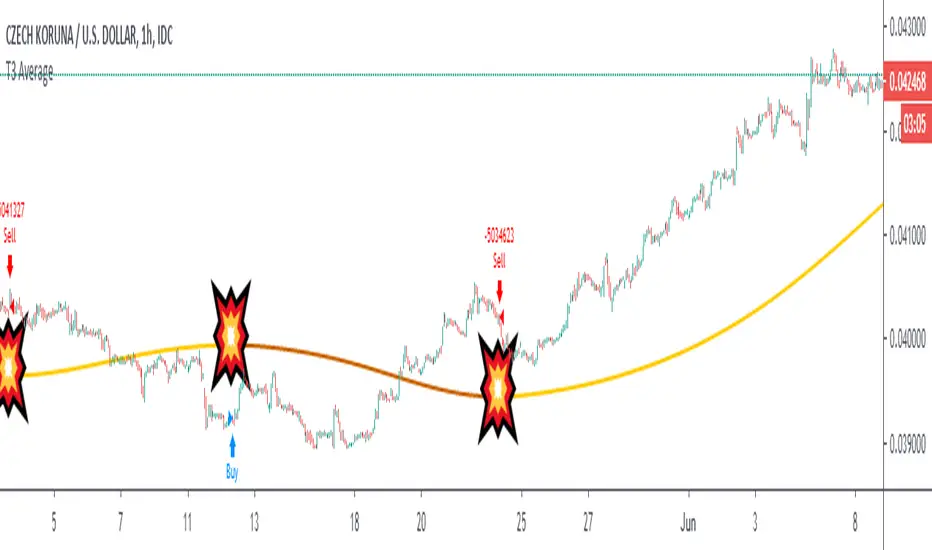
T3 Explosive Moving Average BacktestA simple backtesting algorithm for my joke indicator T Explosive Moving Average
• Buys when it starts to ascend
• Sells when it starts to descend
• Switch the wires to reverse this logic
Some currencies show good results with 75 on daily, 65 (reverse wires) on 4h and 210 (reverse wires) on 1h
To be clear, this strategy has no stop-loss which leads to large drawdowns and unreliability of the backtesting data. It shows some performance but it is still a joke. And unless you like T3 moving average calculation, don't use it, perhaps.
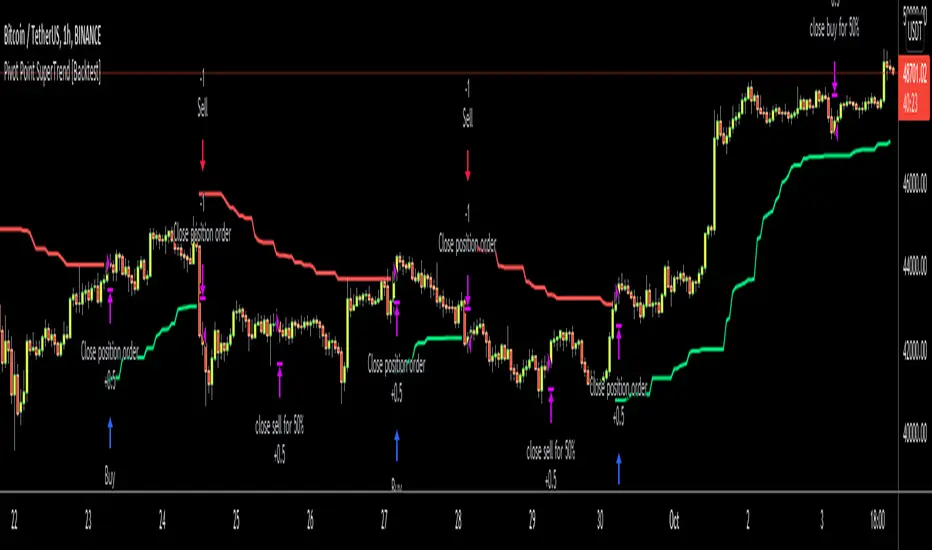
Pivot Point SuperTrend [Backtest]Hello All,
This is backtesting result of following indicator/strategy. I didn't work on adding other indicators. maybe in the future I can try to combine this with other indicators.
You can visit following link to see "Pivot Point SuperTrend" . by using this backtesting tool, you can test&find better options
There is option "Use Center Line to Close Entry for 50%" . by default it's not enabled. if you enable this option, pivot point center line may push you to close your entry for 50% (can be used as early stoploss/take profit line if you think it's risky)
Enjoy!
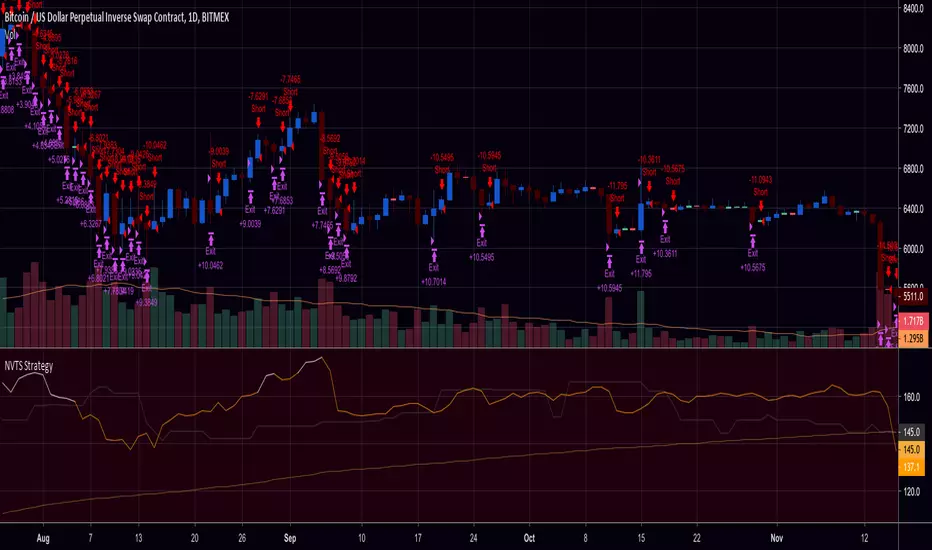
NVT Signal with RMA and Thresholds (Strategy / Backtest)This is the strategy w/ backtester and trailing-stop / stop-loss for kishin's NVT alerts
Ergotic MACD Strategy [forked from HPotter]Ergotic MACD Strategy forked from HPotter
In addition to this fine script you will find some additional features:
- Backtester
- Alerts
- Filters: RSI, MFI, Price trend
- Trailing Stop Loss
- Other minor adjustments

Strategy Backtester TemplateA template for building a strategy tester:
- date range selector
- stop loss
- take profit
- long and short strategy type selector

Stochastiques Divergences [BACKTEST]Hi.
I'm really angry at TradingView for giving fake results when backtesting with H.A. candles. I had to rethink my strategies and find a workaround.
I'm also relieved I figured it out before losing money.
Anyway. Here is a strategy based on stochastic , and a little of my own feelings.
The access if for sale, a small donation will do, but the source code is more valuable.
Backtesting is done on the maximum time range, with commission included. Only long entries and exits.

TrendIsYourFriend Strategy (SPY,IWM,VYM,XLK,SPXL,BTC,GOLD,VT...)Personal disclaimer
Don’t trust this strategy. Don’t trust any other model either just because of its author or a backtest curve. Overfitting is an easy trap, and beginners often fall into it. This script isn’t meant to impress you. It’s meant to survive reality. If it does, maybe it will raise questions and you’ll remember it.
Legal disclaimer
Educational purposes only. Not financial advice. Past performance is not indicative of future results.
Strategy description
Long-only, trend-based logic with two entry types (trend continuation or excess-move reversion), dynamic stop-losses, and a VIX filter to avoid turbulent markets.
Minimal number of parameters with enough trades to support robustness.
For backtest, each trade is sized at $10,000 flat (no compounding, to focus on raw model quality and the regularity of its results over time).
Fees = $0 (neutral choice, as brokers differ).
Slippage = $0, deliberate choice: most entries occur on higher timeframes, and some assets start their history on charts at very low prices, which would otherwise distort results.
What makes this script original
Beyond a classical trend calculation, both excess-move entries and dynamic stop-loss exits also rely on trend logic. Except for the VIX filter, everything comes from trend functions, with very few parameters.
Pre-configurations are fixed in the code, allowing sincere performance tracking across a dozen cases over the medium to long term.
Allowed
SPY (ARCA) — 2-hour chart: S&P 500 ETF, most liquid equity benchmark
IWM (ARCA) — Daily chart: Russell 2000 ETF, US small caps
VYM (ARCA) — Daily chart: Vanguard High Dividend Yield ETF
XLK (ARCA) — Daily chart: Technology Select Sector SPDR
SPXL (ARCA) — Daily chart: 3× leveraged S&P 500 ETF
BTCUSD (COINBASE) — 4-hour chart: Bitcoin vs USD
GOLD (TVC) — Daily chart: Gold spot price
VT (ARCA) — Daily chart: Vanguard Total World Stock ETF
PG (NYSE) — Daily chart: Procter & Gamble Co.
CQQQ (ARCA) — Daily chart: Invesco China Technology ETF
EWC (ARCA) — Daily chart: iShares MSCI Canada ETF
EWJ (ARCA) — Daily chart: iShares MSCI Japan ETF
How to use and form an opinion on it
Works only on the pairs above.
Feel free to modify the input parameters (slippage, fees, order size, margins, …) to see how the model behaves under your own conditions
Compare it with a simple Buy & Hold (requires an order size of 100% equity).
You may also want to look at its time-in-market — the share of time your capital is actually at risk.
Finally, let me INSIST on this : let it run live for months before forming an opinion!
Share your thoughts in the comments 🚀 if you’d like to discuss its live performance.

Hilega Milega v6 - Pure EMA/SMA (Nitesh Kumar) + Full BacktestHilega to milega
he Hilega Milega Strategy, inspired by the technique of Nitesh Kumar, is designed for intraday and swing traders who want structured entries and exits with clear demand–supply logic.
🔑 Core Features
Demand & Supply Zones – Automatically plots potential strong buying and selling zones for high-probability trades.
Trend Identification – Uses a blend of EMAs/SMA crossovers to identify bullish and bearish market bias.
Buy & Sell Signals – Generates real-time visual signals based on “Hilega Milega” rules for quick decision-making.
Risk Management – Suggested stop-loss levels are derived from recent demand–supply areas to minimize drawdowns.
Backtesting Enabled – Traders can test the performance across multiple assets (stocks, forex, crypto, commodities).
📊 How It Works
Buy Signal → When price action confirms a bullish zone with supporting trend filters.
Sell Signal → When price action confirms a bearish zone or reversal pattern.
Flat/Exit → Position closed when opposite signal triggers or demand–supply imbalance fades.
⚡ Best Use Cases
Intraday trading (5m, 15m, 1H charts).
Swing trading (4H, Daily charts).
Works across stocks, crypto, commodities, and forex.
⚠️ Disclaimer: This strategy is for educational purposes. Backtest thoroughly and apply proper risk management before live trading.

Enhanced Gold Scalping Strategy (Backtest with Time Filter)Enhanced Gold Scalping Strategy (Backtest with Time Filter)
This script is a scalping strategy designed specifically for trading gold on lower timeframes, incorporating popular technical indicators and a session filter for optimal performance. The strategy aims to achieve consistency by combining trend-following and volatility-based conditions.
Key Features:
Indicators Used:
Exponential Moving Average (EMA): Filters trades based on the trend direction using a 50-period EMA.
Relative Strength Index (RSI): Ensures trades are taken in favorable momentum conditions (above 30 for longs and below 70 for shorts).
MACD Crossover: Identifies potential trade entries based on MACD line crossing above/below the signal line.
Average True Range (ATR): Used to dynamically calculate Stop Loss and Take Profit levels and ensure trades occur in high-volatility conditions.
Risk-Reward Optimization:
The strategy uses a customizable Risk-Reward Ratio (default is 2:1) for setting Stop Loss (SL) and Take Profit (TP) levels, ensuring that winning trades outweigh losses.
Volatility Filter:
Trades are only executed when the current ATR exceeds the 14-period ATR moving average by a defined threshold, filtering out low-volatility periods.
Session Filter:
The strategy only trades during active market hours (8:00 AM to 8:00 PM Amsterdam Time) on weekdays. This ensures trades align with periods of high liquidity and market activity.
Dynamic Entry and Exit Levels:
SL and TP levels are plotted dynamically on the chart to provide a clear visual of potential risk and reward for each trade.
Buy and Sell Signals:
Visual markers (green triangles for buy, red triangles for sell) on the chart to highlight entry points for better trade visibility.
How It Works:
Long Conditions:
MACD crossover (MACD line above the signal line).
RSI above 30.
Price is above the 50-period EMA.
ATR-based volatility condition is met.
Trade must occur within the defined session hours.
Short Conditions:
MACD crossunder (MACD line below the signal line).
RSI below 70.
Price is below the 50-period EMA.
ATR-based volatility condition is met.
Trade must occur within the defined session hours.
The strategy calculates dynamic SL and TP levels based on the ATR, ensuring flexibility to market conditions.
Customization Options:
EMA length, RSI length, and MACD parameters.
Risk-Reward Ratio for SL/TP calculations.
Volatility threshold for filtering trades.
Session start and end times for active trading hours.
Recommended Use:
Best suited for scalping gold on lower timeframes (15-min charts).
Disclaimer:
This strategy is intended for educational and backtesting purposes. Past performance is not indicative of future results. Use appropriate risk management and test thoroughly before applying to live trading.

Ehlers Combo Strategy🚀 Presenting the Enhanced Ehlers Combo Strategy 🚀
Hello Traders! 👋 I'm thrilled to share the latest version of the Ehlers Combo Strategy v2.0. This powerful algorithm combines Ehlers Elegant Oscillator, Decycler, Instantaneous Trendline, Spearman Rank, and introduces the Signal to Noise Ratio for even more precise trading signals.
📊 Strategy Highlights:
Ehlers Elegant Oscillator: Captures market momentum and turning points.
Ehlers Decycler: Filters out market noise for clearer trend signals.
Instantaneous Trendline: Offers a dynamic view of the market trend.
Spearman Rank: Analyzes market rank correlations for enhanced insights.
Signal to Noise Ratio (SNR): Filters out noise for more accurate signals.
💡 Key Features & Customizations:
Adaptive Length: Enable adaptive length based on the market's current conditions.
SNR Threshold: Set your desired SNR threshold for filtering signals.
Exit Length: Define the length for exit signals.
📈 Trading Signals:
Long Entry: Elegant Oscillator and Decycler cross above 0, source crosses above Decycler, source is greater than an increasing Instantaneous Trendline, Spearman Rank is positive, and SNR exceeds the threshold.
Long Exit: Source crosses below the Instantaneous Trendline after entering a long position.
Short Entry: Elegant Oscillator and Decycler cross below 0, source crosses below Decycler, source is less than a decreasing Instantaneous Trendline, Spearman Rank is negative, and SNR exceeds the threshold.
Short Exit: Source crosses above the Instantaneous Trendline after entering a short position.
📊 Insights & Enhancements:
Dynamic Length: The strategy adapts its length dynamically based on market conditions.
Improved SNR: Signal to Noise Ratio ensures better filtering of signals.
Enhanced Visualization: The Elegant Oscillator now features improved color coding for a clearer interpretation.
🚨 Disclaimer:
Trading involves risk, and this script should be used judiciously. It's not a guaranteed profit machine, but with careful use, it can be a valuable addition to your toolkit.
Feel free to backtest, tweak, and make it your own! Let's conquer the markets together! 💪📈
🚀✨ Happy Trading! ✨🚀
---
🙌 Credits:
A big shoutout to the original contributors:
@blackcat1402
@cheatcountry
@DasanC

X48 - Strategy | MA Type Cross + TPSL | Future&Spot | V.2Thank You For Open Source Code, This Strategy Ref. By 1.Simple Strategy Like MA Crossover For Long/Short or Spot Trade, 2. CDC Action Zone V.2 for BarPaint
This Strategy Mixing With MA Crossover Strategy and BarPaint By CDC Action Zone and TP/SL by Varbara
### How To Use Strategy : Setting EMA/SMA Crossover EMA/SMA, Any Value If You Want
For Long Position : Cross Up
For Short Position : Cross Down
Can Use With Spot Trade : Cross Up = Buy, Cross Down = Sell
TP/SL When Your OrderSize Change From any % Of Your TP/SL Value
### In Strategy Setting
Intitial Capital = Ex. 200
Order Size = Should Be Money Management Not Use 100% of Capital Ex. 10% of Capital (200$) = Order Size 20$
StopLoss and Take Profit = If You Run Trend TF 4H+ or 1D+ You Can Change TP% = 1,000% for nonlimit and Stop Loss 5 - 20% from your order size
Ex. Stoploss 15% = OrderSize / 100 x %SL = 20$/100 x 15% = 3$ Loss from order size 20$ (if you not set stop loss.)
Base Currency = (Your Currency) # Ex. USD
Commission = (Your Trading Fee) # Ex. Future Fee Can Check At Binance Fee Rate > www.binance.com > Choose Your Fee Type, Ex. USD M Future (Regular User) = 0.02 (Maker), 0.04 (Taker)
Commission Symbol Type = % # (Ref. By Binance Fee Rate)
### Notice ####
Default Setting It's Realistic From Normal Life Ex. Capital 200$ / Ordersize 20$ (10%)/ Commission 0.1% (Buy+Sell) / Slippage = 2 / TP = 1000% (nonlimit) / SL = 15%/OrderSize
Low Risk But High Return, Good Luck
### Bot Auto Trade by X4815162342 ###
if you wanna try my bot auto trade X48-3in1-bot : Contact My Line ID : x4815x
Full Command Alert For This Strategy If You Wanna See It's
'{"ex":"'+markettype+'","side": "'+longcommand+'", "amount": "@{{strategy.order.contracts}}", "symbol": "{{ticker}}", "passphrase": "'+passphrase+'","leverage":"'+str.tostring(leveragex)+'"}'
'{"ex":"'+markettype+'","side": "'+shortcommand+'", "amount": "@{{strategy.order.contracts}}", "symbol": "{{ticker}}", "passphrase": "'+passphrase+'","leverage":"'+str.tostring(leveragex)+'"}'
But Easy Than Full Command Just Use Thisssssss !! Strategy Be Manage Auto Long and Short or TPSL Position
You Don't Do Anything Just Use This Message to Alerts Message
{{strategy.order.alert_message}}
### If you don't use bot but just looking for strategy test ####
Just Pass Bot Setting Function It's Nothing Effect For Strategy !!!!!!
Let's Enjoy With Your Strategy BackTest 😁
Remember Beware Max drawdown%. I'm Recommend Lower Than 10% It's Very Good.

action zone - ATR stop reverse order strategy v0.1 by 9nckACTION ZONE-ATR MOD v0.1 DOCUMENTATION
Overview
This tradingview pine script strategy is mainly created to enrich my coding skill. It is a combination of “CDC-ACTIONZONE” and my personal studies of trading techniques in various sources e.g.book, course or blog. This strategy purposefully built to connect with my automatic trading bot. However, It will be very useful to aid your trading routine by diminishing mental distraction which possibly leads to bad trades.
How does it work?
This strategy will do a basic simple thing that most traders do by creating entry signals on both sides long/short and also set the stop loss. Furthermore, It will also reverse the order (from long to short and vice versa (if long/short conditions are met). Finally, it will recalculate the stop loss/take profit price in every complete bar to increase the chance of winning and limit our loss.
Entry rules(Long/Short)
If you have no open order, an order will be created when a fast EMA crosses(up(long)/down(short) the slow EMA(It’s as simple as that).
If you have an open order, the current order will be (sold if long, covered if short) and the opposite side order will be created.
Exit and Reverse rules(Long/Short)
If fast EMA cross (DOWN(long), UP(short)), the current order will be closed, THE OPPOSITE SIDE ORDER WILL ALSO BE CREATED.
Risk management
FLEX STOP PRICE : initial value will be set at the bar which order created. It is a fast ema (+/-) MIDDLE ATR value.
If MIDDLE ATR value rises, it will be our new stop price.
If MIDDLE ATR value falls, stop price unchanged
If Price OVERBOUGHT(long)/SOLD(short), LOW of that bar will be a new stop price.
Minimum position hold period
In order to eliminate risk of repeatedly open, close orders in sideway trends. Minimum hold period must be passed to start exit our position. However, It always respects stop loss prices. The value refers to the number of bars.
MUST READ!!!
This strategy uses only MARKET ORDER. If you trade with a bot, make sure you choose only enormous market cap tokens.
This strategy is bi-direction strategy. It will work best in the DERIVATIVE market.
It was initially designed to compete in the cryptocurrency market which has very high volume and volatility.
I only use this strategy in 1HR (acceptable change rate, optimum trade frequency)
How (should) we use it?
Choose crypto future pairs (recommend only top 10-15 market volume pairs in Binance, let’s say 1000M+ trade value)
Choose your time frame (1H is strongly recommended)
Setup your portfolio profile (Setting->Properties) such as Initial cap, order size, commission. DO NOT USE CAL ON EVERY TICK IT WILL CAUSE REPAINTING AND YOUR CAPITAL IS BLEEDING !!!
BACKTEST FIRST!! Back test is a combination of art, math and statis(and a bit of luck). You can apply to train and test methods or whatever you are familiar with. In my opinion, your test period should include UPTREND, SIDEWAY, DOWNTREND. Fine tune fast, slow ema first(my best ema length of 1H timeframe around 7-10, 17-22). Try to eliminate fault breakout trade and use other options only necessary. Hopefully we can use automatic optimization on Pine Script soon.
Don’t forget to turn off using a specific backtest date option to start your strategy.A
THIS IS NOT A PERFECT (OR EVEN PROFITABLE) STRATEGY. USE AT YOUR OWN RISK AND TRADE RESPONSIBLY. DYOR DUDE.

AlphaScalp [Backtest, No RealTime]AlphaScalp tries to find volatility moves and profits from the small pullbacks.
Even though the performance of this script in a fair amount of cases will beat HODL it is not the purpose. AlphaScalp aims for a high accuracy and profitfactor to ensure a more or less stable profit taking.
The properties like " MA Length " and the " Short - " or " Long line % " tweaks the risk by increasing or lowering the requirements for a buy (Long or Short). Close/Exit of each order is then handled by TP, SL or volatility stop.
For high volatility assets it is recommended to use the " Sell LONG on Volatility DOWN " and " Sell SHORT on Volatility UP " to ensure a TA approach for StopLoss. Normal SL is also possible to set but is not recommended on high volatility assets since you quickly can be stopped out by wicks.
AlphaScalp works best on high volatility assets with a solid liquidity and volume - but it will also work on stocks and low volatility assets.
AlphaScalp is designed for scalping and is thereby recommended to use between 5M-1H.
This version is free for your to backtest on all assets - but be aware that alerts on RealTime bars are disabled - meaning you can add alerts but they will not trigger in real time. To ensure you have the latest backtesting results, you need to have the script added to your chart, save your chart and the refresh the page.
Enjoy and please let me know if you have any questions

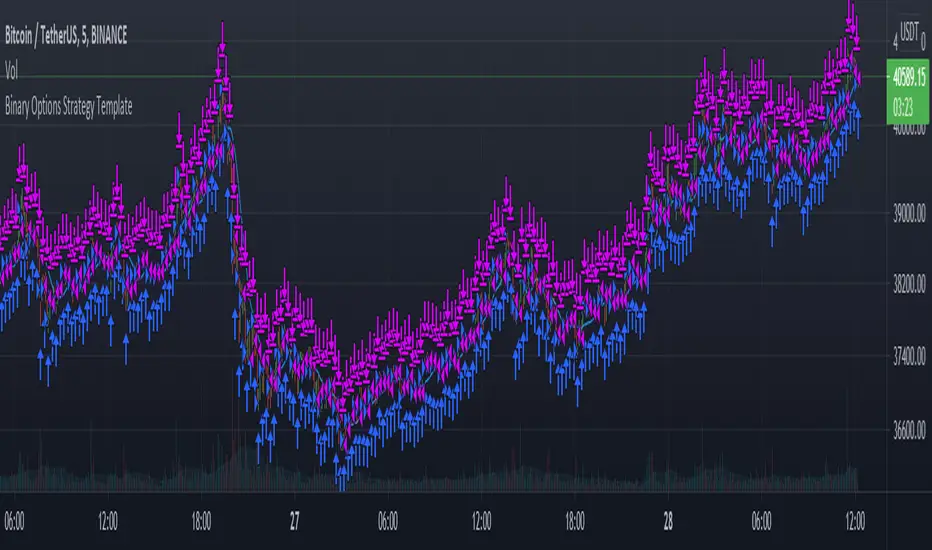
Binary Options Strategy TemplateWith the hype around Binary Options trading (more like gambling instead of trading) it is good to be able to backtest a strategy before using it in the live markets.
In a Binary Options trade the trade get's closed after a specific amount of time and the only thing that matters is if the market has increased in price or decreased after that amount of time.
Because of this a strategy backtest should close all positions after a specific amount of time. In this super small script the number of bars since the trade was opened is used as a way to close the position. So for example if you use this strategy on the 1 minute charts with number of bars set to 5 it will close the position 5 minutes after opening it. Purpose of this script is using it as a strategy on already existing scripts to check viability for options trading.
With the limited pine knowledge that I have I do not know if it is possible to create a more realistic binary options strategy which also calculated the profit. If someone knows a more advanced version of this please let me know.
RSI-VWAP Indicator %█ OVERALL
Simple and effective script that, as you already know, uses vwap as source of the rsi, and with good results as long as the market has no long-term downtrend.
RsiVwap = rsi (vwap (close), Length)
The default settings are for BTC in a 30 minute time frame. For other pairs and time frames you just have to play with the settings.
█ FEATURES
• The option to start trading from a certain date has been added.
• To make the profit more progressive, a percentage of your equity is used for entries and a percentage of your position is used for closings.
• The option to trade in Spot mode has been added, since, for the TradingView backtest, the money is infinite and if you do not limit it somehow,
it would offer you much better profits than the live trading.
QuantityOnLong = Spot ? (EquityPercent / 100) * ((strategy.equity / close) - strategy.position_size) : (EquityPercent / 100) * (strategy.equity / close)
• The option to stop the system when the drawdown exceeds the fixed limit has been added.
Drawdown, as you already know, is a very important measure of risk in trading systems.
The maximum drawdown will tell us what the maximum loss of a trading system has been during a period. This maximum loss is determined by:
strategy.risk.max_drawdown(Risk, strategy.percent_of_equity)
• Leverage plotted on labels added.
█ ALERTS
To enjoy the benefits of automatic trading, TradingView alerts can be used as direct buy-sell orders on spot, or long-close orders with leverage.
Currently there are Chrome extensions that act as a bridge between TradingView and your Exchange or Broker.
This is an example of syntax for this type of extensions. Copy and paste a message like this into the alert window:
{{strategy.order.action}} @ {{strategy.order.price}} | e = {{exchange}} a = account s = {{ticker}} b = {{strategy.order.action}} {{strategy.order.alert_message}}
█ NOTE
Certain Risks of Live Algorithmic Trading You Should Know:
• Backtesting cannot assure actual results.
• The relevant market might fail or behave unexpectedly.
• Your broker may experience failures in its infrastructure, fail to execute your orders in a correct or timely fashion or reject your orders.
• The system you use for generating trading orders, communicating those orders to your broker, and receiving queries and trading results from your broker may fail.
• Time lag at various point in live trading might cause unexpected behavior.
• The systems of third parties in addition to those of the provider from which we obtain various services, your broker, and the applicable securities market may fail or malfunction.
█ THANKS
Thanks to TradingView, its Pine code, its community and especially those Pine wizards who post their ideas that helps us to learn.
If the world is heading toward a equitable new world economic order, let's get rich first ...
Happy trading!

SmoothOps v1 - StrategyThe purpose of this script was to fine tune an indicator on BTCUSDT. I think the results speak for themselves.
This is a script that uses the MACD to predict future price movement. The original MACD signal lags too much for my taste so I went searching for something that could give signals sooner. I decided a smooth macd would help filter out noise and grabbing the highest values and lowest values over the past number of bars. I spent several days backtesting different settings and combinations of signals to arrive at what you see now. This strategy has been fine tuned for BTC/USDT on Binance, so I suggest you only use it for that. Any other coin/pair and exchange will need a new backtest since the data will be different. This is not a generalized indicator like everything else. It's specifically good at one thing: prediction BTCUSDT on Binance.
Use this in combination with the Study version so you can visually see what is happening when you change settings.
How to use:
Use only on BTCUSDT Binance
Set the preset to the timeframe you want. I HIGHLY suggest only using the 1h timeframe. It gives the best profit over time
Set the preset to custom if you want to try using your own settings.
You can change the source input if you want. ohlc4 usually works best for 1h
Change the date range if you want to do a specific timeframe.
Change the stop loss % if you want, but I didn't find much of a difference when using it on 1h

BANKNIFTY - PRICE ACTION TRADING SYSTEM (BackTestable + Alerts)This study is based on several Price Action parameters of :-
• Candle Pattern,
• Supply Demands,
• Support and Resistance ,
• Breakouts.
► How To Use This Study ?
• Suitable Trade Session for this study 10:15 AM to 02:30 PM ( UTC +05:30)
• Buy Whenever a Up Arrow Appears on Chart with text "TYPE: LE".
• Sell Whenever a Down Arrow Appears on Chart with text "TYPE: SE".
• Exit Buy Whenever a Down Arrow Appears with text "TYPE: LX" After A Buy call and Exit Sell Whenever a up Arrow Appears with text "TYPE: SX" After A Sell Call.
• Take Only 1 trade Per Trading Session.
Backtest Values Used:-
Initial Capital : 1000000
Order Size (Lots) : 1 (Contract) Lots
Pyramiding : 0 orders
Commission : 0.001%
Test Yourself and give feedback.
PM us to obtain access.

1337 MoonStar H4 RVI Exit Backtest- H4 BTC/USD
simple Trendfollowing Strategy :
- based on Vwaps and Hull
- early Exit on RVI Signals
it try to catch the Trend, thats why in Consolidation it switches very often between long/short
you can switch between longonly/shortonly or both
you can define a Backtestperiod to check different marketbehaviour

How To Set Trade Dates
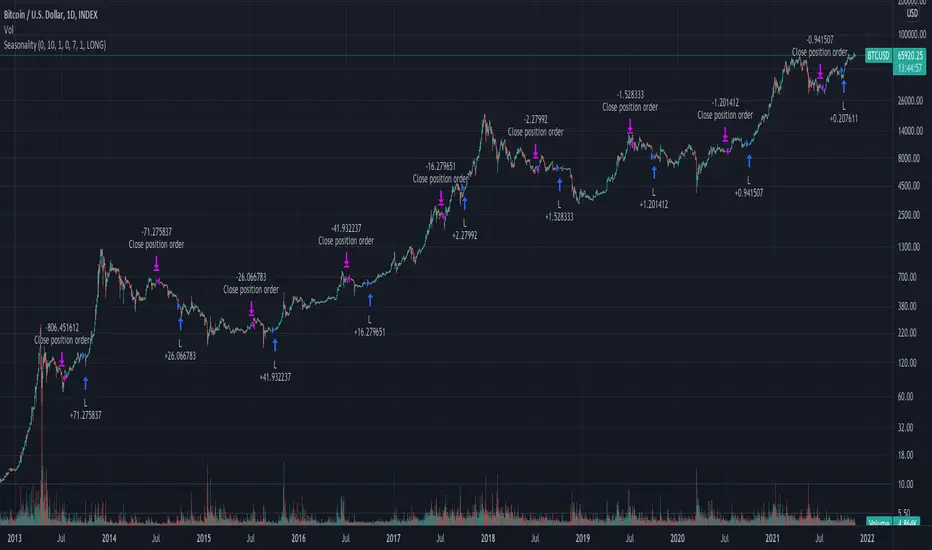
Example how to backtest specific date(s) which can be useful for testing seasonality strategy ideas such as "Sell in May", etc.
If using Daily period with wild card dates it will not trade on 1st day of month. If market is closed will trade on next open day.
Works only with Daily or lower timeframes. When using on Daily timeframe set dates 1 day earlier to execute on desired dates.
Entering 0 in any of the date fields acts a wild card. Example -> Entry Year: 0 is "Every Year", Exit Month: 0 is "Every Month", etc.
NOTICE: This is an example script and not meant to be used as an actual strategy. By using this script or any portion thereof, you acknowledge that you have read and understood that this is for research purposes only and I am not responsible for any financial losses you may incur by using this script!
Kite Crossing Oscillator, backtester (v2.1)This is an older version of Kite-Crossing-Oscillator-backtester/ .

kiska clouds backtest editionkiska clouds: crypto twitter's next cloud meme
Crypto is a fast-paced, highly-volatile asset, therefore, many traditional strategies are thrown out of the window when applied to cryptocurrency markets. In trading, there are only two things known for sure: price and volume . Price and volume data is then manipulated using various math equations in an effort to discover patterns and/or make predictions. kiska clouds are no different.
The kiska clouds are a simple crossover strategy. The clouds are different because of the unique averages being used and the embedded momentum indicator .
To use the clouds is simple:
When the green line crosses above the pink line, you buy/long.
When the green line crosses below the pink line, you sell/short.
The clouds are indicative of the trend's momentum. Using the power of math, the larger the cloud indicates a higher amount of buying/selling pressure. As the cloud thins, momentum is slowing, and the trend may be reversing.
At the time of testing, the strategy had a profitability of 54.55% accuracy with 1133.41% net profit. While I think this could be automated into a bot, adding a human element with stop losses and further analysis will significantly improve the accuracy/profitability.
This indicator is the backtest version of the kiska clouds (). For a trial or to purchase this indicator, send me a message on Twitter @moonkiska or here on TradingView. You will be granted a 2-3 day trial period to the backtesting strategy.

Cuban's MTF Fisher BacktesterA multi-timeframe Fisher indicator that has been updated to Pine version 3, added linear regression and RMA lines with up down colour coding, alert conditions for ease and autoview automatic trading, and a few other little tricks.
This indicator will no longer repaint and will provide more accurate signals. I've also added a backtester to allow you to find something that works for you. Just search 'Cuban's MTF Fisher Backtester'.
If you would like any features added, DM me on Tradingview or Twitter.
