RF+ Replay for Heikin AshiRF+ Replay for Heikin Ashi
RF+ Replay for Heikin Ashi generates fully customisable Heikin Ashi candlesticks presented on a standard chart, enabling traders to utilise the Tradingview Replay feature with Heikin Ashi candlesticks when analysing and backtesting HA style strategies.
The features of this indicator include:
- Fully customisable Heikin Ashi Candles, including custom colour options for candle bodies, borders and wicks.
- Optional real-time, real-price close dots painted onto each candlestick.
- A optional set of 2 x Range Filters designed to indicate short term trend identification upon color change, ideal for low timeframe scalping.
- A optional set of 3 x fully customisable Moving Averages.
- An option to enable Heikin Ashi calculated data for the Range Filters and Moving Averages, so they present as they would on a Heikin Ashi non-standard chart type, without having to use an actual Heikin Ashi chart. Enabled by default.
- An optional sessions indicator, to highlight your prefered trading session for the purpose of backtesting.
- An optional watermark featuring customisable text and well as symbol and timeframe information, as seen in the screenshot of this indicator.
Instructions for use:
1) Because this indicator generates candlesticks and presents them onto your chart, you will need to hide the existing candlesticks so you do not see two sets of candles. You can do this by going into your Tradingview chart settings and making the candle bodies, borders and wicks fully transparent. You can then save this as a layout template. You can access your Chart Settings by clicking on the cog icon, or by right clicking on the chart itself and selecting 'Chart Settings' from the list.
2) Ensure you have the standard chart type selected - you do not need to select a Heikin Ashi type chart.
3) You will now be able to analyise and even backtest your Heikin Ashi style strategies including the use of the Tradingview Replay feature found at the top of the chart.
Heikin Ashi means 'average bar' in Japanese, which speaks to the fact that Heikin Ashi candles are calculated differently to standard Japanese candlesticks. The general idea of Heikin Ashi candles is to 'smooth' the appearance of price movement, by the use of averages within their calculation. It is important to understand that the Open and Close values of a Heikin Ashi candlestick do not reflect real Open and Close prices. You can use the real price dots feature to clearly see the real time and real price Close of each candle.
The formula for calculating a Heikin Ashi candlestick is as follows:
High = Maximum of High, Open, or Close (whichever is highest)
Low = Minimum of Low, Open, or Close (whichever is lowest)
Open = Open (previous bar) + Close (previous bar) /2
Close = (Open + High + Low + Close) / 4
If you found this useful, be sure to leave a like, comment and subscribe to show your support.
Until next time.
在脚本中搜索"backtest"

TTP RSI drawdownThis indicator offers a way to trade the RSI drawdown combined together with its value.
Parameters
- Lookback. How many candles in the past are used to calculate the drawdown of the RSI
- RSI strength and timeframe
- Lower and Upper RSI limits. These are used to colour the drawdown chart, the greener the closed to your specified lower limit and the more red the closer to the upper limit. These limits are also used to confirm that the signal occurs with an RSI value within the given limits.
- Signal threshold. Buy signals will only be triggered when the drawdown of the RSI is higher than the provided value.
Buy signals
The signal will trigger in white color and will plot a 1 to allow backtesting.
TradingView alerts can be set for buy signals.
Buy signals will be trigger only when:
- RSI value is within the provided lower and upper limit values
- RSI drawdown is higher than the provided threshold.
Features
- Back-testable (plots 1 for buy)
- TV alerts
Chart modes
- show RSI
- show highest RSI
- show RSI drawdown
In the short time I've been playing with this new idea I noticed it can be used both for swing trading and for long term analysis like for example finding market bottoms.
Here's an example setup to find BTC past market cycle bottoms:
- load a chart with INDEX:BTCUSD
- set the chart timeframe to daily
- set the chart to logarithmic scale
- zoom out to see the full chart
- add the RSI drawdown indicator
- use the following parameters in the indicator: timeframe: week, gaps: off, show RSI drawdown: on, lookback:30, length:14, lower: 20, upper: 30: threshold: 40

Original Strategy - Backtest & Alerts [AlgoRider]█ OVERVIEW
This indicator simulates an efficient trading strategy developed by our team in a simple and effective way, the primary objective when designing it was to make its reading and use as simple as possible for TradingView users. The Backtesting feature has been designed to keep only the most essential information to obtain clear and precise results directly on the graph. The settings interface has also been designed for ergonomic and simplified use. The user is free to customize the parameters as he wishes and according to his trading profile by having the choice, for example, of using options to reduce the risk of loss, to increase the win rate, to optimize profits. Automation is made possible and facilitated thanks to preconfigured alert conditions.
█ CONCEPTS
How the strategy works :
When the price is close to its equilibrium (represented by an exponential moving average - EMA) and it starts to take an upward or downward direction the script will issue Long or Short entry orders. If the price turns and goes to the opposite direction, the script quickly cuts the position by issuing a Stop Loss order. When the price takes a real clear direction, this is where the script will be able to accumulate profits.
What makes this script unique is :
• That it is entirely developed by us, inspired by a strategy that is little known and little used in the trading world, in particular because it often involves a greater number of losing trades than winning trades.
• Its ease of reading and use. The backtesting feature was designed to clearly display the most important information in a data table directly on the chart. The user is not lost with dozens of superfluous data and can directly access the most essential information to see how the strategy has performed in the past.
• Its ease of configuration and customization. Once in the configuration window, again the user is not lost, because there is only one main parameter to modify, it is the length of the EMA, which will influence the timing of entries and exits trades. Then there are a few other non-mandatory parameters to fine-tune risk management and maximize profits. (Detailed description of the settings further down the page)
• Strategy automation made easy and fast thanks to several types of alerts which are differentiated for entries, for auto-exits and for Custom TP and SL. These alerts can be configured to send the messages by email or via Webhooks.
• The indicator has several custom options allowing its user to go further than the basic strategy. Several confirmations for entries are available as well as the possibility of adding or not a personalized TP and/or SL.
• There is no repaint, once an entry/exit symbol or drawing is displayed it doesn't change anymore. The Short, Long and auto-Exit signals appear only at the open of the candles, just after the signal was confirmed at the close of the previous candle. The custom TP and custom SL signals can appear when a candle is not yet finished, but once displayed they don't change.
█ HOW TO PROCEED
1 — Once the script is applied to your chart, it already works with its default settings. You can already see the performance of the strategy in the data table directly on the chart (in the top right corner by default).
2 — You can customize the strategy and influence the results/performance by modifying its parameters. 3 types of parameters are present and can be modified.
3 — This strategy is designed for the cryptocurrency market in priority, but you can also try it on other types of assets. It works on Futures but you can also try it on Spot market mainly for LONG trades.
4 — You can apply the script in every timeframe. We do not recommend using it below m30 because in most cases the statistics are unfavorable largely because of the fees. (This is not a financial advice but only for the use of the indicator)
█ FEATURES
Screenshot on BYBIT:EGLDUSDT Bybit Futures, H1, with default parameters, from 2022-01-01 to 2022-09-27, to show the settings window
• Settings For Backtesting
- Strategy : Choose from a drop-down list if the strategy should execute only Long trades or only Short trades or both. Default Both.
- Invest. : Choose the amount you want to invest in the simulation. Default 10000.
- Position : Choose the amount of the position (Size order) that will be used during the simulation. This will be the $ amount staked/involved for each trade entry.
Ex: If you put 20000 in position and 10000 in Invest. We consider that you use at least a leverage x2. Default 10000.
- Slipp. TP : Choose the amount in percentage of average slippage for Take Profits. This parameter makes it possible to predict a potential gap between the theoretical exit price for each TP (On the graph) and the real exit price on an exchange when implementing the strategy for real (slippage may be due to a time lag of a few seconds from execution time of the order on the exchange and/or due to the execution of a market order).
Ex: If a TP exit order of a Long trade, with entry $19000 (on BTCUSDT), is carried out in theory on the chart at $20000, in practice on the exchange the script have indeed sent an exit order at 20000 , but if the true exit price is 20050, the TP slippage is then +0.25%. Default 0.
- Slipp. SL : Choose the amount in percentage of average slippage for Stop Losses. This parameter makes it possible to predict a potential gap between the theoretical exit price for each SL (On the graph) and the real exit price on an exchange when implementing the strategy for real.
Ex: If an SL exit order of a Long trade, entry $19000 (on BTCUSDT), is carried out in theory on the chart at $18000, in practice on the exchange the script have indeed sent an exit order at 18000 $, but if the true exit price is 17950, the slippage SL is then +0.278% . Default 0.
- Fees % : Choose the percentage amount of fees applied to each trade to simulate the application of the strategy on the exchange of your choice. Applies to the entry and exit of each trade. Ex: For Binance Futures: 0.04; For Bybit futures: 0.06; For Ftx Futures: 0.075. Default 0.
- Cumulate Trades : If you check this, the Backtest will use 100% of the balance as Order Size (Position) for All or in the next X consecutive trades. Default not checked.
⚠️ Be Careful please, this option is available to show the full extent and possibilities of the algorithm when pushed to its limits thanks to the accumulation of profits (cumulative earnings), but it is a strategy that involves great risk. If a bad trade suffers a -50% loss, 50% of the account balance is lost, if the position is liquidated, the entire account balance is lost.
- All : If you check this All trades will be accumulated. Default not checked.
- Consecutive Trades : Choose the number of trades to accumulate. After X consecutive trades, the algorithm reassigns the initial order size to the current one and starts again for X consecutive trades. Minimum Value 2, Default 2.
• Settings To Optimize Performances and Risk Management
- (Main Parameter) EMA Length : Choose the length of the EMA. This value will determine the exponential moving average plot (blue line) that represents the equilibrium in this strategy. Depending on the positioning of the price around this equilibrium, the algorithm will decide to trigger Long or Short entry alerts, and exit alerts. Default 200.
- 1 - Confirm (After X Bar(s)) : If you check this, when the algorithm will detect an entry, it will wait for the number of bars you have entered to actually trigger the entry alert. Default not checked.
- Nb Bar : Enter here the number of bar you want, will be taken into account only if you check (1) Confirm (After X Bar(s)). Default 2.
- 2 - Confirm (Trend) : If you check this, when the algorithm will detect an entry, it will check that the trend is similar to the direction of the trade, if not, it will wait that the trade goes in the same direction as the trend to actually trigger the entry alert. Default not checked.
- OR/AND : This choice is taken into account only if you tick both confirmations. If you choose OR: The first of the 2 confirmations to be validated will trigger the entry alert. If you choose AND : once confirmation (1) is validated, the algorithm waits for confirmation (2) to be validated to actually trigger the entry alert. Default OR.
- Use TP / Use SL : If you check these, the algorithm will trigger personalized trade exit alerts when the price evolution has reached the amounts indicated since the trade entry. Default not Checked.
- % TP - SL : Indicate here the personalized amount in percentage that you want for your Take Profit and Stop Loss of each trade. Default 15-5.
• Settings For Appearances
- Small-size Data Table : If you check this, the data table will become smaller to free up more space on the chart to make it visually more pleasing. Default not checked.
Hide Table /
- Hide Labels / : You can check these to get a cleaner chart and focus only on what interests you in the indicator. Default not checked.
Hide Risk-Reward Areas
█ MAIN PARAMETERS TO USE
• In the default settings none of the box settings are checked. Basic strategy is made to be applied this way.
• The main parameter (the length of the EMA) is by default 200 because it is a known value that many traders rely on in many trading strategies. Moreover in this strategy it works in many cases and on different timeframes.
• To go further the user of the indicator is free to modify the parameters of the category "Leading Parameters - Risk Management" to reduce risks and to optimize profits.
• You can find below our recommendations for the EMA length value corresponding to the main timeframes.
m30 — EMA Length = 400 | 800
H1 — EMA Length = 200 | 400
H2 — EMA Length = 200 | 250
H4 — EMA Length = 100 | 200
D — EMA Length = 20 | 40
⚠️ We have chosen to recommend these settings because they will work in most cases, on most cryptoassets, but of course they will not work 100% of the time on all assets and will not always give positive results in the backtest, and they are not the most optimized parameters either. The user of the indicator is free to optimize the asset on which he wants to trade in his own way. Just as we do not give financial advice, we do not encourage to trade any asset in particular.
█ STATISTICS
The statistics presented below are an example of the results that the strategy can provide. (Reminder: These statistics are made over a past period and there is no guarantee that the same performance will reproduce in the future) .
For the demonstration we chose to apply the strategy on the Top 5 marketcap cryptos in September 2022. They are not the most favorable coins for this strategy but at least this way we don't take the most suitable assets to show wonderful and biased results. Likewise for the parameters used which are the default ones and which are not the most optimized parameters, much better results are possible. We chose Binance because it has the highest volumes and liquidity and the most historical data. We chose H1 because it is one of the most used timeframes.
BTC
Screenshot on BINANCE:BTCUSDTPERP Binance Futures, H1, with default parameters (EMA : 400), from 2022-01-01 to 2022-09-27
ETH
Screenshot on BINANCE:ETHUSDTPERP Binance Futures, H1, with default parameters (EMA : 400), from 2022-01-01 to 2022-09-27
BNB
Screenshot on BINANCE:BNBUSDTPERP Binance Futures, H1, with default parameters (EMA : 400), from 2022-01-01 to 2022-09-27
XRP
Screenshot on BINANCE:XRPUSDTPERP Binance Futures, H1, with default parameters (EMA : 200), from 2022-01-01 to 2022-09-27
ADA
Screenshot on BINANCE:ADAUSDTPERP Binance Futures, H1, with default parameters (EMA : 400), from 2022-01-01 to 2022-09-27
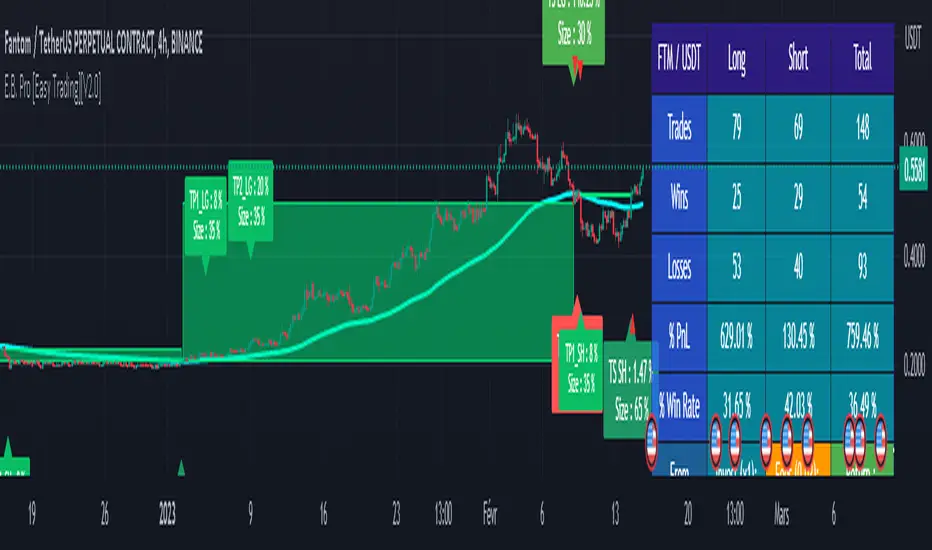
To show the potential of the indicator and push it to its limits, here is an example of the strategy applied for about 2 years (Up to the maximum of historical data available).
⚠️ It must be taken into account that during the period of this backtest the last Bullrun took place and it was a very favorable period for the strategy and for this altcoin (FTM), nothing ensures that it will happen again. ⚠️
FTM
Screenshot on BINANCE:FTMUSDTPERP Binance Futures, H4, with default parameters ( without cumulative earnings) and EMA : 400, start on 2020/12/03 to 2022/09/27
✅ All of the above statistics are verifiable by anyone using the indicator's backtesting system.
█ LIMITATIONS
• Despite the fact that we can see good performances when we backtest the strategy, we must take into account the fact that these are results performed in the past and that in no case does this guarantee that these same performances will be repeated again in the future.
• The automation of this strategy is made possible and is facilitated by alerts, but you must be aware of the fact that if you decide to put this strategy into practice in real life, you are solely responsible for the results that you will be able to obtain and you must be aware of the possibility at all times of partial or even total losses of your invested capital.
• Keep in mind that generating profits in trading is difficult. A strategy can perform very well at one time in the past during a period that is favorable to it, then from one day to the next it can give really bad results for several months or years.
• When backtesting a strategy, there are many factors to consider, not just trade entries to which you add a Take Profit and sometimes a Stop Loss. You must at least take into account the size of the position in relation to the capital you want to invest, the trading fees, the slippages (which can be really important depending on the exchange on which you are trading and depending on the asset you are trading), trading frequency, risk management, momentum, volumes and even more.
• This indicator has been optimized for crypto, you can try to use it on other type of assets but again, at your own risk.
The information published here on TradingView is not prohibited, doesn't constitute investment advice, and isn't created solely for qualified investors.
═════════════════════════════════════════════════════════════════════════
Important to note : our indicators with the same backtesting system are published in separate publications, because putting them together in a single script would considerably slow down the execution of the script. In addition each indicator, even when it is based on a simple technical indicator, has several options, parameters and entry/exit conditions specific to the underlying technical indicator. Finally, we want to keep the simplicity of use, configuration and understanding of our indicator by not mixing strategies that have nothing to do with each other.
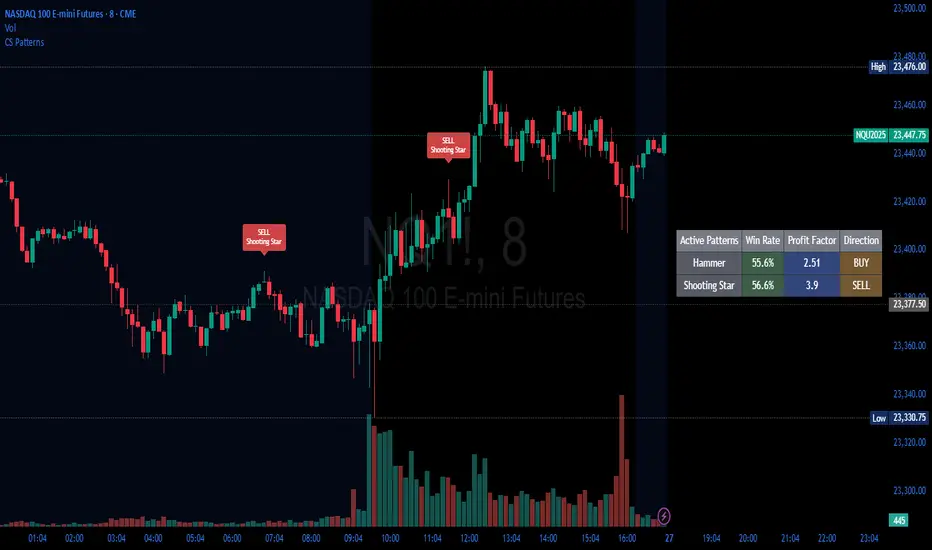
Candlestick Patterns Backtester [Optimized]Candlestick Patterns Backtester
What this is: This indicator is based on a really cool candlestick pattern backtester that I found (I'll update this later when I remember where I got it from or find the actual author). The original had this massive table showing win/loss ratios for a bunch of candlestick patterns, and according to the built-in backtester, it was actually profitable - which was pretty impressive.
The Problem: I played around with the original for a while but honestly wasn't really able to get it to work well at all for actual trading. It was still pretty cool to look at though! The main issues were:
It was just a big static table - hard to do anything useful with it
Couldn't send signals out to other strategies
The code was a monster - like 2,000+ lines of repetitive mess
What I Did: I completely refactored this thing and got it down from 2,000+ lines to just a few hundred lines. Much cleaner now! Here's what it does:
45+ Candlestick Patterns - All the classics are in there
Dynamic Filtering - Set your own requirements (minimum win rate, profit factor, total trades, etc.)
Flexible Logic - Choose AND/OR logic for your filters
Signal Generation - Creates actual buy/sell signals you can use with other strategies
Visual Badges - Shows pattern badges on chart when they meet your criteria
Active Patterns Table - Only shows patterns that are currently profitable based on your settings
Settings You Can Adjust:
Minimum win rate threshold
Minimum profit factor
Minimum number of trades required
Whether to use AND or OR logic for filtering
Colors, badge display, debug options
Reality Check: Trading these patterns really wasn't for me, but it was still a great learning experience. The backtesting results look good on paper, but as always, past performance doesn't guarantee future results. Use this as a research tool and educational resource more than anything else.
Credit: This is based on someone else's original work that I heavily modified and optimized. I'll update this description once I track down the original author to give proper credit where it's due.
This introduction captures your casual, honest tone while explaining the technical improvements you made and setting realistic expectations about the indicator's practical use.
ZCrypto 3commas - All in oneIntroducing the "3commas All Built-in Indicators in One Script" for TradingView!
Tired of wondering which 3commas-built-in indicators to use and how to combine them? This script is here to make your life easier by answering this question for you.
Instead of spending hours paper trading on 3commas and hoping for the best combined indicator signals, save time and find more accurate results on TradingView.
This indicator combines any of the 3commas-built-in indicators into one signal, allowing you to verify which indicators work best together.
You can combine two or more indicators, up to a maximum of 17, and backtest your combined signal with the Zendog integration - it's simple and easy!
The script includes the following indicators:
• TV Technical Rating x 3
• RSI x 3
• ULT x 1
• BB x 3
• MACD x 2
• MFI x 1
• CCI x 1
• PSAR x 1
• BTC, DXY Filter x 1
• QFL
• Zendog integration
The indicator fires two types of signals: entry signals and exit signals.
To fire entry signals, the script uses the following conditions:
• TV Technical Rating: If the rating is "Buy" or "Strong Buy”, then the signal is fired.
• RSI: If the RSI value is below the RSI threshold, then the signal is fired.
• ULT: If the Ultimate Oscillator value is below the ULT threshold, then the signal is fired.
• BB: If the candle is closed below the channel (lower band), then the signal is fired.
• MACD: If the value of the MACD line is < 0 and the MACD line crosses the Signal line from bottom to top, then the signal is fired.
• MFI: If the candle is closed and its value crosses the MFI threshold from bottom to top, then the signal is fired.
• CCI: If the CCI Value crosses the CCI threshold, then the signal is fired.
• PSAR: If the current price is above the Parabolic SAR, then the signal is fired.
• QFL: If the QFL base (support level) is cracked and the price is <= the crack % of drop, then the signal is fired.
• BTC, DXY Filter: If the current price is higher than the SMA length of Bitcoin (BTC) and the US Dollar Index (DXY) is below it, then the signal is fired.
To fire exit signals, the script uses the following conditions:
• TV Technical Rating: If the rating is "Sell" or "Strong Sell”, then the signal is fired.
• RSI: If the RSI value is above the RSI threshold, then the signal is fired.
• QFL SELL: If the QFL peak (resistance level) is cracked and the price is >= the crack % of pump, then the signal is fired.
to use it with Zendog Backtester here is how you could set it up
Say goodbye to the guessing game and save time with the "3commas All Built-in Indicators in One Script" on TradingView.

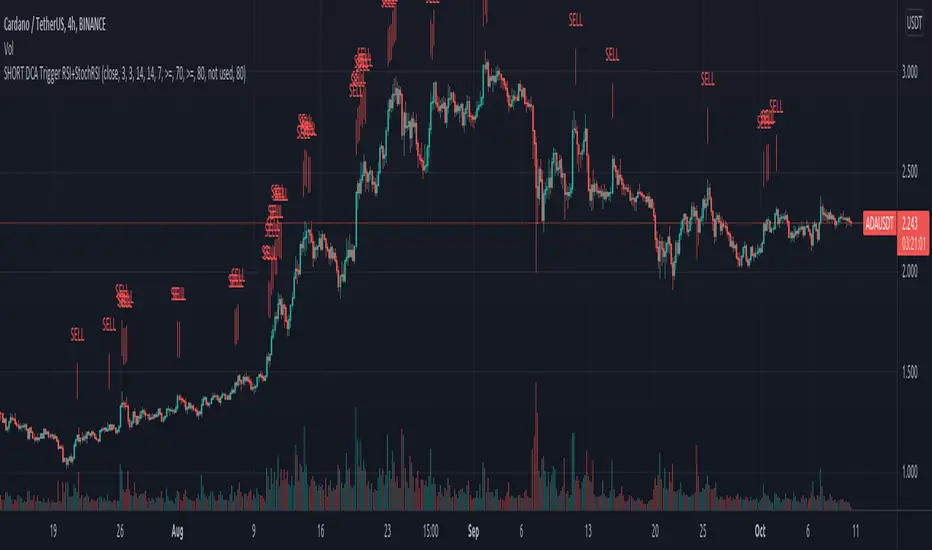
Zendog SHORT DCA Trigger RSI+StochRSIThis is a script that generates a SELL signal by combining RSI and Stochastic RSI into the same script and that can easily be integrated into an external Backtester like the one I published.
The script uses default values for RSI and Stochastic RSI overbought conditions.
They should be adjusted for specific assets and timeframes so they better match the current trend. Please beware you might overfit settings to match a short timeframe trend (like a few days or hours). If this is the case once the trend changes the signals will not be accurate.
The purpose of this script is to provide some pine code that can be used to further combine multiple indicators into a SHORT Deal Start signal.
Integration with the Zendog Backtster:
- add the backtester on the chart
- add this script on the chart
- in the Zendog backtester Deal start type select "External indicator"
- in the Zendog backtester Indicator source and value select "Zendog SHORT DCA Trigger RSI+StochRSI: SIGNAL"
Zendog LONG DCA Trigger RSI+StochRSIThis is a script that generates a BUY signal by combining RSI and Stochastic RSI into the same script and that can easily be integrated into an external Backtester like the one I published.
The script uses default values for RSI and Stochastic RSI oversold conditions.
They should be adjusted for specific assets and timeframes so they better match the current trend. Please beware you might overfit settings to match a short timeframe trend (like a few days or hours). If this is the case once the trend changes the signals will not be accurate.
The purpose of this script is to provide some pine code that can be used to further combine multiple indicators into a LONG Deal Start signal.
Integration with the Zendog Backtster:
- add the backtester on the chart
- add this script on the chart
- in the Zendog backtester Deal start type select "External indicator"
- in the Zendog backtester Indicator source and value select "Zendog LONG DCA Trigger RSI+StochRSI: SIGNAL"

Walk Forward PatternsINTRO
In Euclidean geometry, every mathematical output has a planar projection. 'Walk Forward Patterns' can be considered a practical example of this concept. On the other hand, this indicator might also be viewed as an experiment in 'how playing with Lego as a child contributes to time series analysis' :)
OVERVIEW
This script dynamically generates the necessary optimization and testing ranges for Walk Forward Analysis based on user-defined bar count and length inputs. It performs automatic calculations for each step, offers 8 different window options depending on the inputs, and visualizes the results dynamically. I should also note that most of the window models consist of original patterns I have created.
ADDITIONAL INFO : WHAT IS WALK FORWARD ANALYSIS?
Although it is not the main focus of this indicator, providing a brief definition of Walk Forward Analysis can be helpful in correctly interpreting the results it generates. Walk Forward Analysis (WFA) is a systematic method for optimizing parameters and validating trading strategies. It involves dividing historical data into variable segments, where a strategy is first optimized on an in-sample period and then tested on an out-of-sample period. This process repeats by shifting the windows forward, ensuring that each test evaluates the strategy on unseen data, helping to assess its robustness and adaptability in real market conditions.
ORIGINALITY
There are very few studies on Walk Forward Analysis in TradingView. Even worse, there are no any open-source studies available. Someone has to start somewhere, I suppose. And in my personal opinion, determining the optimization and backtest intervals is the most challenging part of WFA. These intervals serve as a prerequisite for automated parameter optimization. I felt the need to publish this pattern module, which I use in my own WFA models, partly due to this gap on community scripts.
INDICATOR MECHANICS
To use the indicator effectively, you only need to perform four simple tasks:
Specify the total number of bars in your chart in the 'Bar Index' parameter.
Define the optimization (In-Sample Test) length.
Define the testing (Out-Of-Sample Test) length.
Finally, select the window type.
The indicator automatically models everything else (including the number of steps) based on your inputs. And the result; you now have a clear idea of which bars to use for your Walk Forward tests!
A COMMONLY USED WINDOW SELECTION METHOD: ROLLING
A more concrete definition of Walk Forward Analysis, specifically for the widely used Rolling method, can be described as follows:
Parameters that have performed well over a certain period are identified (Optimization: In-Sample).
These parameters are then tested on a shorter, subsequent period (Backtest: Out-of-Sample).
The process is repeated forward in time (At each step, the optimization and backtest periods are shifted by the backtest length).
If the cumulative percentage profit obtained from the backtest results is greater than half of the historical optimization profit, the strategy is considered "successful."
If the strategy is successful, the most recent (untested) optimization values are used for live trading.
OTHER WINDOW OPTIONS
ANCHORED: That's a pattern based on progressively expanding optimization ranges at each step. Backtest ranges move forward in a staircase-like manner.
STATIC: Optimization ranges remain fixed, while backtest ranges are shifted forward.
BLOCKED: Optimization ranges are shifted forward in groups of three blocks. Backtest ranges are also shifted in a staircase manner, even at the cost of creating gaps from the optimization end bars.
TRIANGULAR: Optimization ranges are shifted forward in triangular regions, while backtest ranges move in a staircase pattern.
RATIO: The optimization length increases by 25% of the initial step’s fixed length at each step. In other words, the length grows by 25% of the first step's length incrementally. Backtest ranges always start from the bar where the optimization ends.
FIBONACCI: A variation of the Ratio method, where the optimization shift factor is set to 0.618
RANDOM WALK
Unlike the window models explained above, we can also generate optimization and backtest ranges completely randomly—offering almost unlimited variations! When you select the "Random" option in the "Window" parameter on the indicator interface, random intervals are generated based on various trigonometric calculations. By changing the numerical value in the '🐒' parameter, you can create entirely unique patterns.
WHY THE 🐒 EMOJI?
Two reasons.
First, I think that as humanity, we are a species of tailless primates who become happy when we understand things :). At least evolutionarily. The entire history of civilization is built on the effort to express the universe in a scale we can comprehend. 'Knowledge' is an invention born from this effort, which is why we feel happiness when we 'understand'. Second, I can't think of a better metaphor for randomness than a monkey sitting at a keyboard. See: Monkey Test.
Anyway, I’m rambling :)
NOTES
The indicator generates results for up to 100 steps. As the number of steps increases, the table may extend beyond the screen—don’t forget to zoom out!
FINAL WORDS
I haven’t published a Walk Forward script yet . However, there seem to be examples that can perform parameter optimization in the true sense of the word, producing more realistic results without falling into overfitting in my library. Hopefully, I’ll have the chance to publish one in the coming weeks. Sincerely thanks to Kıvanç Özbilgiç, Robert Pardo, Kevin Davey, Ernest P. Chan for their inspiring publishments.
DISCLAIMER
That's just a script, nothing more. I hope it helps everyone. Do not forget to manage your risk. And trade as safely as possible. Best of luck!
© dg_factor

Average True Range BandsThis is a simple script to assist you in manual backtesting! Perfect for the NNFX crowd or anyone that enjoys manual backtesting.
Usage
1. Slap this bad boy on your chart.
2. Adjust period and multiplier (defaults are 14 period and 1.5x).
3. Put on the indicator/system you are testing.
4. Enter bar replay mode.
5. Drag your long/short position take profit and stop loss to the upper and lower bands.
(long/short positions are available on the left-hand toolbar)
6. Profit!
If you enjoy/use this script, drop me a follow and please note me in your code!
I'm *almost* always available for collabs and questions.

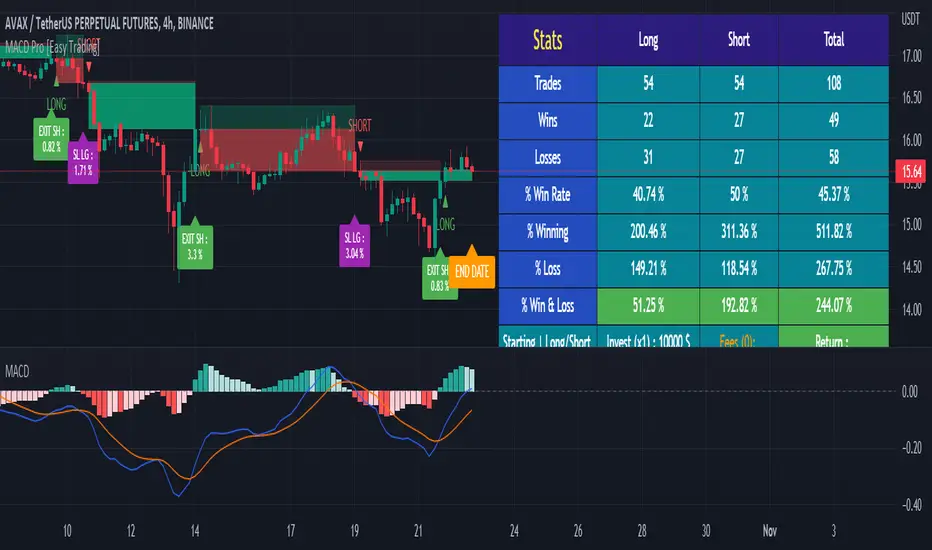
MACD Strategy - Backtest [AlgoRider]█ OVERVIEW
Hello dear Tradingviewers !
We are excited to share with you this new indicator which simulates a trading strategy based solely on the well-known technical indicator MACD . We designed it for the sole educational and analytical purposes of showing novice traders and new investors that basing a trading strategy only on one such technical indicator is not necessarily a good thing to do. We do not recommend to apply this strategy for real.
Thanks to this indicator redesigned in our own way by incorporating our simple and easy-to-use Backtest functionality, you will be able to see and report on the performance and results that such a strategy has produced in the past.
The configuration window has also been designed to be easily readable and simple to use. Our goal is to make parameter customization as easy as possible.
█ HOW THE STRATEGY WORKS
• The script will simply trigger Long entries when bullish MACD crossings appear (the Macd line crosses the Signal line upwards) and Short entries when bearish MACD crossings appear (the Macd line crosses below the signal line).
• A Short signal ends a Long trade, a Long signal ends a Short trade.
• The script also allows setting up custom TP and SL.
• An option allows you to trigger early crossings, which will influence entries and exits.
• There is no repaint, once an entry/exit symbol or drawing is displayed it doesn't change anymore. The Short and Long signals appear at the open of the candles, just after the signal was confirmed at the close of the previous candle. The custom TP and custom SL signals can appear when a candle is not yet finished, but once displayed they don't change.
█ HOW TO PROCEED
1 — Once the script is applied to your chart, it already works with its default settings. You can already see the performance of the strategy in the data table directly on the chart (in the top right corner by default).
2 — You can customize the strategy and influence the results/performance by modifying its parameters. 3 types of parameters are present and can be modified.
3 — You can use this indicator in all types of markets.
4 — You can apply the script in every timeframe.
█ PARAMETERS
• Settings For Backtesting
- Strategy : Choose from a drop-down list if the strategy should execute only Long trades or only Short trades or both. Default Both.
- Invest. : Choose the amount you want to invest in the simulation. Default 10000.
- Position : Choose the amount of the position (Size order) that will be used during the simulation. This will be the $ amount staked/involved for each trade entry.
Ex: If you put 20000 in position and 10000 in Invest. We consider that you use at least a leverage x2. Default 10000.
- Slipp. TP : Choose the amount in percentage of average slippage for Take Profits. This parameter makes it possible to predict a potential gap between the theoretical exit price for each TP (On the graph) and the real exit price on an exchange when implementing the strategy for real (slippage may be due to a time lag of a few seconds from execution time of the order on the exchange and/or due to the execution of a market order).
Ex: If a TP exit order of a Long trade, with entry $19000 (on BTCUSDT ), is carried out in theory on the chart at $20000, in practice on the exchange the script have indeed sent an exit order at 20000 , but if the true exit price is 20050, the TP slippage is then +0.25%. Default 0.
- Slipp. SL : Choose the amount in percentage of average slippage for Stop Losses. This parameter makes it possible to predict a potential gap between the theoretical exit price for each SL (On the graph) and the real exit price on an exchange when implementing the strategy for real.
Ex: If an SL exit order of a Long trade, entry $19000 (on BTCUSDT ), is carried out in theory on the chart at $18000, in practice on the exchange the script have indeed sent an exit order at 18000 $, but if the true exit price is 17950, the slippage SL is then +0.278%. Default 0.
- Fees % : Choose the percentage amount of fees applied to each trade to simulate the application of the strategy on the exchange of your choice. Applies to the entry and exit of each trade. Ex: For Binance Futures: 0.04; For Bybit futures: 0.06; For Ftx Futures: 0.075. Default 0.
- Cumulate Trades : If you check this, the Backtest will use 100% of the balance as Order Size (Position) for All or in the next X consecutive trades. Default not checked.
⚠️ Be Careful please, this option is available to show the full extent and possibilities of the algorithm when pushed to its limits thanks to the accumulation of profits (cumulative earnings ), but it is a strategy that involves great risk. If a bad trade suffers a -50% loss, 50% of the account balance is lost, if the position is liquidated, the entire account balance is lost.
- All : If you check this All trades will be accumulated. Default not checked.
- Consecutive Trades : Choose the number of trades to accumulate. After X consecutive trades, the algorithm reassigns the initial order size to the current one and starts again for X consecutive trades. Minimum Value 2, Default 2.
• Settings To Optimize Performances and Risk Management
- Fast_MA : Choose the length of the Fast Moving Average. Default 12.
- Slow_MA : Choose the length of the Slow Moving Average. Default 26.
- Enable Early Crossings : If you check this, when the algorithm will detect an early crossing wethere bullish or bearish , it will trigger the Long or Short entries. Default not checked.
- Oscillator MA Type : Choose if the Macd line should be an Exponential Moving Average or a Simple Moving Average . Default Expo.
- Signal Line MA Type : Choose if the Signal line should be an Exponential Moving Average or a Simple Moving Average . Default Expo.
- Use TP / Use SL : If you check these, the algorithm will trigger personalized trade exit signals when the price evolution has reached the amounts indicated since the trade entry. Default not Checked.
- % TP - SL : Indicate here the personalized amount in percentage that you want for your Take Profit and Stop Loss of each trade. Default 15-5.
• Settings For Appearances
- Small-size Data Table : If you check this, the data table will become smaller to free up more space on the chart to make it visually more pleasing. Default not checked.
Hide Table /
- Hide Labels / : You can check these to get a cleaner chart and focus only on what interests you in the indicator. Default not checked.
Hide Risk-Reward Areas
█ LIMITATIONS
• ⚠️ We repeat it once again, this strategy is not intended to be reproduced in real conditions, we have designed it for educational and analytical purposes only.
• Even if you see good performances when you backtest the strategy, you must take into account that these results are performed in the past and that in no case does this guarantee that these same performances will be repeated again in the future.
• When you run for real a trading strategy you must be aware of the fact that you are solely responsible for the results that you will be able to obtain and you must be aware of the possibility at all times of partial or even total losses of your invested capital.
• Keep in mind that generating profits in trading is difficult. A strategy can perform very well at one time in the past during a period that is favorable to it, then from one day to the next it can give really bad results for several months or years.
• When backtesting a trading strategy, there are many factors to consider, not just trade entries to which you add a Take Profit and sometimes a Stop Loss. You must at least take into account the size of the position in relation to the capital you want to invest, the trading fees, the slippages (which can be really important depending on the exchange on which you are trading and depending on the asset you are trading), trading frequency, risk management, momentum, volumes and even more.
The information published here on TradingView is not prohibited, doesn't constitute investment advice, and isn't created solely for qualified investors.
═════════════════════════════════════════════════════════════════════════
Important to note : our indicators with the same backtesting system are published in separate publications, because putting them together in a single script would considerably slow down the execution of the script. In addition each indicator, even when it is based on a simple technical indicator, has several options, parameters and entry/exit conditions specific to the underlying technical indicator. Finally, we want to keep the simplicity of use, configuration and understanding of our indicator by not mixing strategies that have nothing to do with each other.
RSI Strategy - Backtest [AlgoRider]█ OVERVIEW
Hello dear Tradingviewers !
We share with you this new indicator which simulates a trading strategy based solely on the well-known technical indicator RSI . We designed it for the sole educational and analytical purposes of showing novice traders and new investors that basing a trading strategy only on one such technical indicator is not necessarily a good thing to do. We do not recommend to apply this strategy for real.
Thanks to this indicator redesigned in our own way by incorporating our simple and easy-to-use Backtest functionality, you will be able to see and report on the performance and results that such a strategy has produced in the past.
The configuration window has also been designed to be easily readable and simple to use. Our goal is to make parameter customization as easy as possible.
█ HOW THE STRATEGY WORKS
• The script will trigger Long entries when the price crosses upwards the Oversold zone (Default 38.2) and Short entries when the price crosses downward the Overbought zone (Default 61.8).
• A Short signal ends a Long trade, a Long signal ends a Short trade.
• The script also allows setting up custom TP and SL.
• Several options allow you to reverse entry and exit conditions of trades. You can choose to reverse entries or/and exits (Ex: when the script detects a Long Entry, it will actually trigger a Short trade).
• You can also change the entry conditions of the strategy. Instead of entering oversold/overbought zone conditions, it will trigger entries when the Rsi changes direction and reverses (Ex: when the rsi has been going down for 5 candles, and the rsi starts going up) , regardless of the area in which the RSI is located.
• There is no repaint, once an entry/exit symbol or drawing is displayed it doesn't change anymore. The Short and Long signals appear at the open of the candles, just after the signal was confirmed at the close of the previous candle. The custom TP and custom SL signals can appear when a candle is not yet finished, but once displayed they don't change.
█ HOW TO PROCEED
1 — Once the script is applied to your chart, it already works with its default settings. You can already see the performance of the strategy in the data table directly on the chart (in the top right corner by default).
2 — You can customize the strategy and influence the results/performance by modifying its parameters. 4 types of parameters are present and can be modified.
3 — You can use this indicator in all types of markets.
4 — You can apply the script in every timeframe.
█ PARAMETERS
• Settings For Backtesting
- Strategy : Choose from a drop-down list if the strategy should execute only Long trades or only Short trades or both. Default Both.
- Invest. : Choose the amount you want to invest in the simulation. Default 10000.
- Position : Choose the amount of the position (Size order) that will be used during the simulation. This will be the $ amount staked/involved for each trade entry.
Ex: If you put 20000 in position and 10000 in Invest. We consider that you use at least a leverage x2. Default 10000.
- Slipp. TP : Choose the amount in percentage of average slippage for Take Profits. This parameter makes it possible to predict a potential gap between the theoretical exit price for each TP (On the graph) and the real exit price on an exchange when implementing the strategy for real (slippage may be due to a time lag of a few seconds from execution time of the order on the exchange and/or due to the execution of a market order).
Ex: If a TP exit order of a Long trade, with entry $19000 (on BTCUSDT ), is carried out in theory on the chart at $20000, in practice on the exchange the script have indeed sent an exit order at 20000 , but if the true exit price is 20050, the TP slippage is then +0.25%. Default 0.
- Slipp. SL : Choose the amount in percentage of average slippage for Stop Losses. This parameter makes it possible to predict a potential gap between the theoretical exit price for each SL (On the graph) and the real exit price on an exchange when implementing the strategy for real.
Ex: If an SL exit order of a Long trade, entry $19000 (on BTCUSDT ), is carried out in theory on the chart at $18000, in practice on the exchange the script have indeed sent an exit order at 18000 $, but if the true exit price is 17950, the slippage SL is then +0.278%. Default 0.
- Fees % : Choose the percentage amount of fees applied to each trade to simulate the application of the strategy on the exchange of your choice. Applies to the entry and exit of each trade. Ex: For Binance Futures: 0.04; For Bybit futures: 0.06; For Ftx Futures: 0.075. Default 0.
- Cumulate Trades : If you check this, the Backtest will use 100% of the balance as Order Size (Position) for All or in the next X consecutive trades. Default not checked.
⚠️ Be Careful please, this option is available to show the full extent and possibilities of the algorithm when pushed to its limits thanks to the accumulation of profits (cumulative earnings ), but it is a strategy that involves great risk. If a bad trade suffers a -50% loss, 50% of the account balance is lost, if the position is liquidated, the entire account balance is lost.
- All : If you check this All trades will be accumulated. Default not checked.
- Consecutive Trades : Choose the number of trades to accumulate. After X consecutive trades, the algorithm reassigns the initial order size to the current one and starts again for X consecutive trades. Minimum Value 2, Default 2.
• Change Entry & Exit conditions
- Rsi Turns Up/Down : Enable this option to change conditions for trade entries. For Long entries : It will start a Long trade when RSI turns up and the RSI was falling on the last X bar(s). For Short entries : It will start a Short trade when RSI turns down and the RSI was rising on the last X bar(s). Default not checked.
- After Falling/Rising Bars(s) : Choose the number of bars/candles since which the price was falling/rising. Default 5.
- Reverse Entries : Enable this option to reverse conditions for trade entries. When a Short signal appears, it will actually start a Long trade. When a Long signal appears, it will actually start a Short trade. Default not checked.
- Reverse Exits : Enable this option to reverse conditions for trade exits. Default not checked.
- Safety Stop Loss : Enable this option to quickly cut the trade when the price turns quickly. For a Long trade : if the price returns to the oversold zone, it ends the trade. For a Short trade : if the price returns to the overbought zone, it ends the trade. Mainly useful for basic strategy (overbought/oversold conditions). Default not checked.
• Settings To Optimize Performances and Risk Management
- Len RSI : The length of RSI . Default 14.
- Overbuy : You can change the limit value of the overbought zone of the RSI . Default 61.8.
- Oversell : You can change the limit value of the oversell zone of the RSI . Default 38.2.
- Use TP / Use SL : If you check these, the algorithm will trigger personalized trade exit signals when the price evolution has reached the amounts indicated since the trade entry. Default not Checked.
- % TP - SL : Indicate here the personalized amount in percentage that you want for your Take Profit and Stop Loss of each trade. Default 15-5.
• Settings For Appearances
- Small-size Data Table : If you check this, the data table will become smaller to free up more space on the chart to make it visually more pleasing. Default not checked.
Hide Table /
- Hide Labels / : You can check these to get a cleaner chart and focus only on what interests you in the indicator. Default not checked.
Hide Risk-Reward Areas
█ LIMITATIONS
• ⚠️ We repeat it once again, this strategy is not intended to be reproduced in real conditions, we have designed it for educational and analytical purposes only.
• Even if you see good performances when you backtest the strategy, you must take into account that these results are performed in the past and that in no case does this guarantee that these same performances will be repeated again in the future.
• When you run for real a trading strategy you must be aware of the fact that you are solely responsible for the results that you will be able to obtain and you must be aware of the possibility at all times of partial or even total losses of your invested capital.
• Keep in mind that generating profits in trading is difficult. A strategy can perform very well at one time in the past during a period that is favorable to it, then from one day to the next it can give really bad results for several months or years.
• When backtesting a trading strategy, there are many factors to consider, not just trade entries to which you add a Take Profit and sometimes a Stop Loss. You must at least take into account the size of the position in relation to the capital you want to invest, the trading fees, the slippages (which can be really important depending on the exchange on which you are trading and depending on the asset you are trading), trading frequency, risk management, momentum, volumes and even more.
The information published here on TradingView is not prohibited, doesn't constitute investment advice, and isn't created solely for qualified investors.
═════════════════════════════════════════════════════════════════════════
Important to note : our indicators with the same backtesting system are published in separate publications, because putting them together in a single script would considerably slow down the execution of the script. In addition each indicator, even when it is based on a simple technical indicator, has several options, parameters and entry/exit conditions specific to the underlying technical indicator. Finally, we want to keep the simplicity of use, configuration and understanding of our indicator by not mixing strategies that have nothing to do with each other.

Price Change Scalping Indicator v1.0 - 3Commas EditionIntroduction
This indicator implements the Price Change Scalping (PCS) strategy specifically for the 3Commas platform. The Input settings have been redesigned to match the same inputs as the 3Commas My Bot Settings page. Only the "Deal Start Condition" section will echo the required PCS-related settings found in the original Price Change Scalping Indicator v1.0 to successfully implement the strategy.
The indicator uses a price rate of change (ROC) momentum calculation to determine the percent change in price between a defined range of bars. The calculated ROC value is then compared to the Upper Threshold and Lower Threshold values to determine if a trade setup is to be activated. If the threshold is crossed, a trade setup will occur based on the indicator settings. Entry, Take Profit, and Stop Loss prices are calculated and displayed on the chart. Once the Entry Price is crossed, a long or short position is created (depending on the direction) and once the Take Profit price is crossed, the position is closed. If the Entry Price is not crossed within a specific number of bars, the trade setup is canceled, and it will proceed to monitor price changes for the next set up.
How is it original and useful?
This indicator is unique in that the strategy version fully supports the TradingView backtester, which will enable you to perform experiments with various settings to evaluate performance using the historical chart data. The study version implements the "Start Deal" and "Close Deal" alerts for you to integrate with 3Comma's "Trading View Custom Signal" start condition. Both script versions will provide the same configuration abilities. The following list is a brief description of its usefulness:
Full support for all possible 3Commas bot settings.
Define a short or long trading strategy.
Price change data source and offset settings.
Your layering placement relative to the entry price.
Your trading parameters like take profit and stop loss offsets, trailing take profit support, exchange commission rates, trading start time, and order size multiplication for each layer.
Flexible trade eligibility rules that can use other chart indicators, like RSI or EMA, to exclude the selection of entry prices for trading.
The visibility of detailed statistics from the chart history pertaining to trading sessions started and closed, session durations, win rate, price action drops and bounces, as well as layer utilization.
The visibility of detailed Used Amount for Each Step table that details how each layer will be allocated for trading.
How does it compare to other scripts in the Public Library?
The indicator offers a very detailed, comprehensive settings to address all types of markets found on TradingView where you can implement the price change scalping strategy. The strategy version can be considered the first of its kind on TradingView to leverage the backtester to provide informative, detailed performance measurements surrounding this unique trading strategy. The study version will implement the latest alert framework called "Any Alert() Function" where you can create a single alert to handle multiple events, which include:
Deal Start
Deal Close
Strategy Results
The default settings are designed to define a "loose" price change settings to ensure that the indicator will render chart elements when first loaded as well as to allow the backtester to gather order executions and display performance summary. The strategy version is using $10,000 initial capital, a commission rate of 0.1% for both entries and exits, and a 1 tick slippage setting. It is also using 3.4881% of the equity for the Base Order Size, 4.7097% of equity for the first Safety Order Size. The Maximum Safety Trade Count is 7 with a Safety Order Volume Scale of 1.33, and a take profit of 2% with no stop loss. All other settings are defaults.
It is recommended that the indicator be "tuned" for your specific market to best implement the price change strategy and obtain better desirable results. You do so by scrolling through the chart's history and observing moments when prices tend to move rapidly. Measure the number or bars it typically takes for the price to change at a specific rate. Using this information, you can adjust the Price Change Settings accordingly to configure the indicator for the chart.
Always keep in mind that past performance may not be indicative of future results. Settings that seem favorable for one market may be found to be disastrous in another. Therefore, do take the time needed to understand how the settings will behave with the given chart symbol.
Enjoy! 😊👍
How to obtain access to the script?
You have two choices:
Use the "Website" link below to obtain access to this indicator, or
Send us a private message (PM) in TradingView itself.

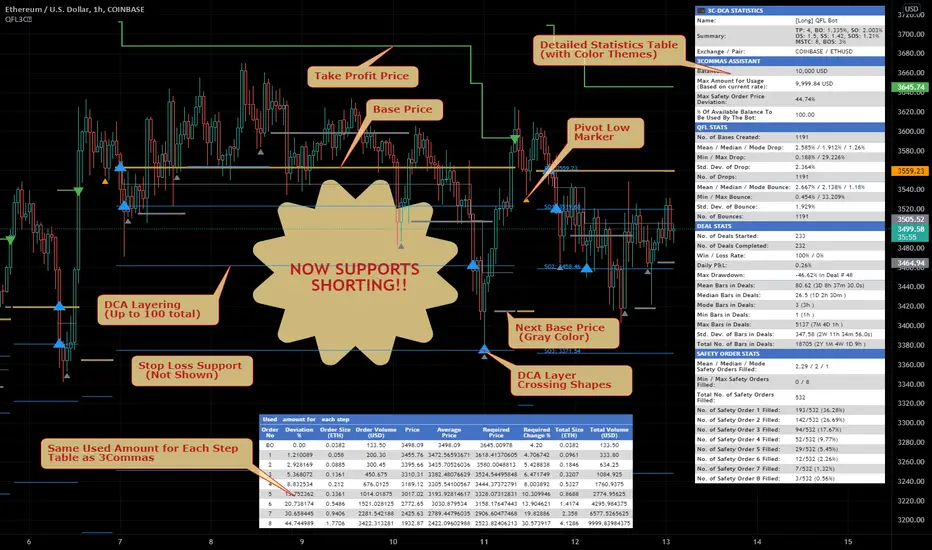
Quickfingers Lucs Base Breaking Indicator v2.5 - 3Commas EditionIntroduction
The indicator attempts to implement a popular price action strategy by Luc Thomas (a.k.a. Quickfingers Luc) typically referred to as a QFL base-breaking strategy specifically for the 3Commas platform. The Input settings have been redesigned to match the same inputs as the 3Commas My Bot Settings page. Only the "Deal Start Condition" section will echo the required QFL-related settings found in the original Quickfingers Luc's Base Breaking Indicator v2.5 to successfully implement the strategy.
The strategy revolves around price action movements that reveal “bases”, which are price levels of support that have a significant, rapid price surges called “bounces”. Once a base is revealed, the base price level is used as reference to implement multiple entries below the base using a layering technique of dollar-cost averaging to place multiple limit orders at various price levels below the base price. As price action breaks below the base price, the limit orders will be filled, and the take profit, breakeven and stop loss prices will be recalculated.
How is it original and useful?
This indicator is unique in that the strategy version fully supports the TradingView backtester, which will enable you to perform experiments with various settings to evaluate performance using the historical chart data. The study version implements the "Start Deal" and "Close Deal" alerts for you to integrate with 3Comma's "Trading View Custom Signal" start condition. Both script versions will provide the same configuration abilities. The following list is a brief description of its usefulness:
The ability to define the QFL base confirmation settings, including volume analysis.
The ability to define your preferred layering strategy of either dollar-cost averaging (DCA) or grid-like layers along with precise layer placement.
The ability to define your trading parameters like take profit and stop loss offsets, exchange commission rates, trading start time, and position size multiplication for each layer.
The ability to define flexible trade eligibility rules that can use other chart indicators, like RSI or EMA, to exclude the selection of base prices for trading.
The ability to set the visibility & color theme of the detailed statistics from the chart history pertaining to trading sessions started and closed, session durations, win rate, price action drops and bounces, as well as layer utilization.
How does it compare to other scripts in the Public Library?
The indicator offers a very detailed, comprehensive settings to implement the QFL base-breaking strategy ion 3Commas. The strategy version leverages the full features of the TradingView backtester to provide informative, detailed performance measurements surrounding this unique trading strategy. The study version will implement the latest alert framework called "Any Alert() Function" where you can create a single alert to handle multiple events, which include:
Deal Start
Deal Close
What does it do and how does it do it?
The strategy can be applied to any chart at any time frame, but the minimum should be no lower than 10 minutes. When applied to the chart for the first time, the default settings will work to render base price levels in orange and 8 DCA layers in thin blue lines. As you scroll through the chart's history you should see price action crossing the DCA layers, denoted with blue triangles, and a green take-profit line will render with green triangle denoting the crossing. Lastly, when a deal session begins upon the crossing of the first layer, the indicator will continue to identify base price levels, but the color of the price lines will be gray. When the trade session concludes upon the crossing of the take profit line, the indicator will switch the most recent base price line from gray to orange to make it active and eligible for trading.
As price action develops, the indicator will use the "Base Confirmation Settings" to look back by counting the number of bars to the left and right of a pivot low point, measure the price drops and bounces, and volume amounts to validate that they are within the specified values. If so, the indicator will draw an orange triangle beneath the candle bar to denote it as the pivot low point and begin rendering the orange line as the base price. The DCA layers will be calculated and offset relative to the base price using thin blue lines.
Optionally, the breakeven price line will be drawn to help visualize the true breakeven price which takes into consideration the exchange fees being applied. Base line, take profit, stop loss and DCA layer crossings will be denoted with colorful shapes to help visually recognize the events on the chart.
The volume is validated only at the pivot low candle. It will measure the volume against the moving average to determine base confirmation. A volume factor of 1 will mean that the volume must be at least the same value as the moving average value. A volume factor of 2 means it must be twice the moving average value.
Lastly, a table of statistics is positioned to the upper-right corner of the chart that summarize all the events that have taken place since the indicator began simulating deal sessions from the chart's history.
Strategy Results
The default settings are designed to define a "weak" QFL base to ensure that the indicator will render chart elements when first loaded as well as to allow the backtester to gather order executions and display performance summary. The strategy version is using $10,000 initial capital, a commission rate of 0.1% for both entries and exits, and a 1 tick slippage setting. It is also using 3.4881% of the equity for the Base Order Size, 4.7097% of equity for the first Safety Order Size. The Maximum Safety Trade Count is 7 with a Safety Order Volume Scale of 1.35, and a take profit of 5% with no stop loss. All other settings are defaults.
It is recommended that the indicator be "tuned" for your specific market in order to best implement the QFL trading strategy and obtain better desirable results. You do so by using the statistics table and observe the Mean Price Drop and Bounce values to learn what the indicator is detecting when it measures from the pivot low points. Using this information, you can adjust the Base Confirmation Settings accordingly, along with any volume specifications you require, to configure the indicator for the chart.
Always keep in mind that past performance may not be indicative of future results. Settings that seem favorable for one market may be found to be disastrous in another. Therefore, do take the time needed to understand how the settings will behave with the given chart symbol.
Enjoy! 😊👍
How to obtain access to the script?
You have two choices:
Use the "Website" link below to obtain access to this indicator, or
Send us a private message (PM) in TradingView itself.
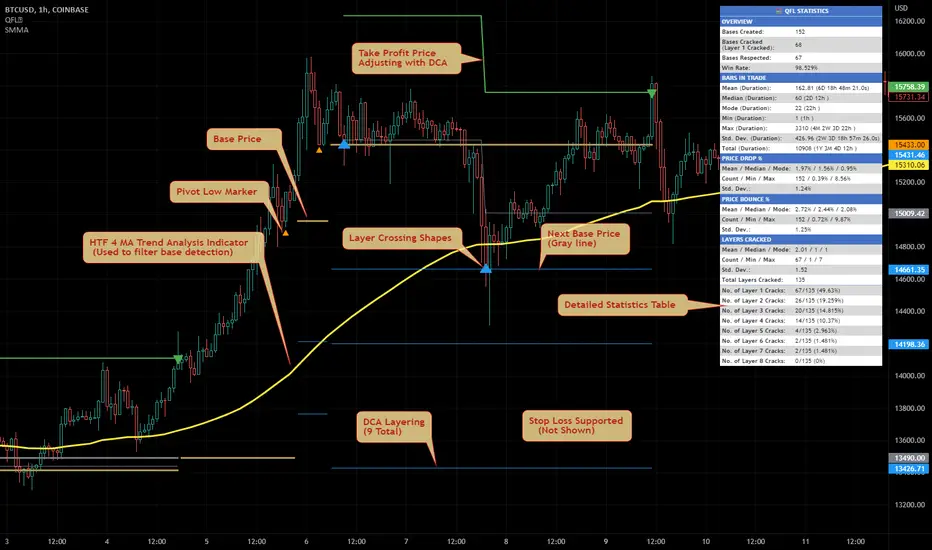
Quickfingers Luc's Base Breaking Indicator v2.5Introduction
The indicator attempts to implement a popular price action strategy by Luc Thomas (a.k.a. Quickfingers Luc) typically referred to as a QFL base-breaking strategy. The strategy revolves around price action movements that reveal “bases”, which are price levels of support that have a significant, rapid price surges called “bounces”. Once a base is revealed, the base price level is used as reference to implement multiple entries below the base using a layering technique of dollar-cost averaging to place multiple limit orders at various price levels below the base price. As price action breaks below the base price, the limit orders will be filled, and the take profit, breakeven and stop loss prices will be recalculated.
How is it original and useful?
This indicator is unique in that the strategy version fully supports the TradingView backtester, which will enable you to perform experiments with various settings to evaluate performance using the historical chart data. The study version implements numerous custom alerts for you to build TradingView notifications around specific price action events and stay informed with market activity in real-time. Both script versions will provide the same configuration abilities where you can define:
Base confirmation settings, including volume analysis.
Your preferred layering strategy of either Dollar-cost averaging (DCA) or grid-like layers along with precise layer placement.
Your trading parameters like take profit and stop loss offsets, exchange commission rates, trading start time, and position size multiplication for each layer.
Flexible trade eligibility rules that can use other chart indicators, like RSI or EMA, to exclude the selection of base prices for trading.
The visibility of detailed statistics from the chart history pertaining to trading sessions started and closed, session durations, win rate, price action drops and bounces, as well as layer utilization.
How does it compare to other scripts in the Public Library?
The indicator offers a very detailed, comprehensive settings to address all types of markets found on TradingView where you can implement the QFL base-breaking strategy. The strategy version can be considered the first of its kind on TradingView to leverage the backtester to provide informative, detailed performance measurements surrounding this unique trading strategy. The study version will contain numerous custom alerts to aid in your notification preferences and stay informed on the indicator's activities:
Base Created
Base Cracked
Base Respected
Any Layer Cracked
Layer 1 Cracked
Layer 2 Cracked
Layer 3 Cracked
Layer 4 Cracked
Layer 5 Cracked
Layer 6 Cracked
Layer 7 Cracked
Layer 8 Cracked
Layer 9 Cracked
Layer 1 Respected
Layer 2 Respected
Layer 3 Respected
Layer 4 Respected
Layer 5 Respected
Layer 6 Respected
Layer 7 Respected
Layer 8 Respected
Take Profit Crossed
Stop Loss Crossed
What does it do and how does it do it?
It is recommended that you start with a chart that is on an hourly timeframe with the "Scale Price Chart Only" chart setting enabled. When applied to the chart for the first time, the default settings will work to render base price levels in orange and 8 DCA layers in blue using a Fibonacci-like sequence for the deviation offset relative to the base price. As you scroll through the chart's history you should see price action crossing the DCA layers, denoted with blue triangles, and a green take-profit line will render with green triangle denoting the crossing. Lastly, when a trade session begins upon the crossing of the first layer, the indicator will continue to identify base price levels, but the color of the price lines will be gray. When the trade session concludes upon the crossing of the take profit line, the indicator will switch the most recent base price line from gray to orange to make it active and eligible for trading.
As price action develops, the indicator will use the "Base Confirmation Settings" to look back by counting the number of bars to the left and right of a pivot low point, measure the price drops and bounces, and volume amounts to validate that they are within the specified values. If so, the indicator will draw an orange triangle beneath the candle bar to denote it as the pivot low point and begin rendering the orange line as the base price. The DCA layers will be calculated and offset relative to the base price using thin blue lines.
Optionally, the breakeven price line will be drawn to help visualize the true breakeven price which takes into consideration the exchange fees being applied. Base line, take profit, stop loss and DCA layer crossings will be denoted with colorful shapes to help visually recognize the events on the chart.
The volume is validated only at the pivot low candle. It will measure the volume against the moving average to determine base confirmation. A volume factor of 1 will mean that the volume must be at least the same value as the moving average value. A volume factor of 2 means it must be twice the moving average value.
Lastly, the very last bar will render a table of statistics that summarize all the events that have taken place since the indicator began simulating trading sessions from the chart's history.
Strategy Results
The default settings are designed to define a "weak" QFL base to ensure that the indicator will render chart elements when first loaded as well as to allow the backtester to gather order executions and display performance summary. The strategy version is using $10,000 initial capital, a commission rate of 0.1% for both entries and exits, and a 1 tick slippage setting. It is also using 3.4887% of the equity with a Position Size Multiplier of 1.35, using 8 total DCA layers, and a take profit of 5% with no stop loss. All other settings are defaults.
It is recommended that the indicator be "tuned" for your specific market in order to best implement the QFL trading strategy and obtain better desirable results. You do so by using the statistics table and observe the Mean Price Drop and Bounce values to learn what the indicator is detecting when it measures from the pivot low points. Using this information, you can adjust the Base Confirmation Settings accordingly, along with any volume specifications you require, to configure the indicator for the chart.
Always keep in mind that past performance may not be indicative of future results. Settings that seem favorable for one market may be found to be disastrous in another. Therefore, do take the time needed to understand how the settings will behave with the given chart symbol.
Enjoy! 😊👍
How to obtain access to the script?
You have two choices:
Use the "Website" link below to obtain access to this indicator, or
Send us a private message (PM) in TradingView itself.
Fourier For Loop [BackQuant]Fourier For Loop
PLEASE Read the following, as understanding an indicator's functionality is essential before integrating it into a trading strategy. Knowing the core logic behind each tool allows for a sound and strategic approach to trading.
Introducing BackQuant's Fourier For Loop (FFL) — a cutting-edge trading indicator that combines Fourier transforms with a for-loop scoring mechanism. This innovative approach leverages mathematical precision to extract trends and reversals in the market, helping traders make informed decisions. Let's break down the components, rationale, and potential use-cases of this indicator.
Understanding Fourier Transform in Trading
The Fourier Transform decomposes price movements into their frequency components, allowing for a detailed analysis of cyclical behavior in the market. By transforming the price data from the time domain into the frequency domain, this indicator identifies underlying patterns that traditional methods may overlook.
In this script, Fourier transforms are applied to the specified calculation source (defaulted to HLC3). The transformation yields magnitude values that can be used to score market movements over a defined range. This scoring process helps uncover long and short signals based on relative strength and trend direction.
Why Use Fourier Transforms?
Fourier Transforms excel in identifying recurring cycles and smoothing noisy data, making them ideal for fast-paced markets where price movements may be erratic. They also provide a unique perspective on market volatility, offering traders additional insights beyond standard indicators.
Calculation Logic: For-Loop Scoring Mechanism
The For Loop Scoring mechanism compares the magnitude of each transformed point in the series, summing the results to generate a score. This score forms the backbone of the signal generation system.
Long Signals: Generated when the score surpasses the defined long threshold (default set at 40). This indicates a strong bullish trend, signaling potential upward momentum.
Short Signals: Triggered when the score crosses under the short threshold (default set at -10). This suggests a bearish trend or potential downside risk.'
Thresholds & Customization
The indicator offers customizable settings to fit various trading styles:
Calculation Periods: Control how many periods the Fourier transform covers.
Long/Short Thresholds: Adjust the sensitivity of the signals to match different timeframes or risk preferences.
Visualization Options: Traders can visualize the thresholds, change the color of bars based on trend direction, and even color the background for enhanced clarity.
Trading Applications
This Fourier For Loop indicator is designed to be versatile across various market conditions and timeframes. Some of its key use-cases include:
Cycle Detection: Fourier transforms help identify recurring patterns or cycles, giving traders a head-start on market direction.
Trend Following: The for-loop scoring system helps confirm the strength of trends, allowing traders to enter positions with greater confidence.
Risk Management: With clearly defined long and short signals, traders can manage their positions effectively, minimizing exposure to false signals.
Final Note
Incorporating this indicator into your trading strategy adds a layer of mathematical precision to traditional technical analysis. Be sure to adjust the calculation start/end points and thresholds to match your specific trading style, and remember that no indicator guarantees success. Always backtest thoroughly and integrate the Fourier For Loop into a balanced trading system.
Thus following all of the key points here are some sample backtests on the 1D Chart
Disclaimer: Backtests are based off past results, and are not indicative of the future .
INDEX:BTCUSD
INDEX:ETHUSD
BINANCE:SOLUSD

MetaFOX DCA (ASAP-RSI-BB%B-TV)Welcome To ' MetaFOX DCA (ASAP-RSI-BB%B-TV) ' Indicator.
This is not a Buy/Sell signals indicator, this is an indicator to help you create your own strategy using a variety of technical analyzing options within the indicator settings with the ability to do DCA (Dollar Cost Average) with up to 100 safety orders.
It is important when backtesting to get a real results, but this is impossible, especially when the time frame is large, because we don't know the real price action inside each candle, as we don't know whether the price reached the high or low first. but what I can say is that I present to you a backtest results in the worst possible case, meaning that if the same chart is repeated during the next period and you traded for the same period and with the same settings, the real results will be either identical to the results in the indicator or better (not worst). There will be no other factors except the slippage in the price when executing orders in the real trading, So I created a feature for that to increase the accuracy rate of the results. For more information, read this description.
Below I will explain all the properties and settings of the indicator:
A) 'Buy Strategies' Section: Your choices of strategies to Start a new trade: (All the conditions works as (And) not (OR), You have to choose one at least and you can choose more than one).
- 'ASAP (New Candle)': Start a trade as soon as possible at the opening of a new candle after exiting the previous trade.
- 'RSI': Using RSI as a technical analysis condition to start a trade.
- 'BB %B': Using BB %B as a technical analysis condition to start a trade.
- 'TV': Using tradingview crypto screener as a technical analysis condition to start a trade.
B) 'Exit Strategies' Section: Your choices of strategies to Exit the trades: (All the conditions works as (And) not (OR), You can choose more than one, But if you don't want to use any of them you have to activate the 'Use TP:' at least).
- 'ASAP (New Candle)': Exit a trade as soon as possible at the opening of a new candle after opening the previous trade.
- 'RSI': Using RSI as a technical analysis condition to exit a trade.
- 'BB %B': Using BB %B as a technical analysis condition to exit a trade.
- 'TV': Using tradingview crypto screener as a technical analysis condition to exit a trade.
C) 'Main Settings' Section:
- 'Trading Fees %': The Exchange trading fees in percentage (trading Commission).
- 'Entry Price Slippage %': Since real trading differs from backtest calculations, while in backtest results are calculated based on the open price of the candle, but in real trading there is a slippage from the open price of the candle resulting from the supply and demand in the real time trading, so this feature is to determine the slippage Which you think it is appropriate, then the entry prices of the trades will calculated higher than the open price of the start candle by the percentage of slippage that you set. If you don't want to calculate any slippage, just set it to zero, but I don't recommend that if you want the most realistic results.
Note: If (open price + slippage) is higher than the high of the candle then don't worry, I've kept this in consideration.
- 'Use SL': Activate to use stop loss percentage.
- 'SL %': Stop loss percentage.
- 'SL settings options box':
'SL From Base Price': Calculate the SL from the base order price (from the trade first entry price).
'SL From Avg. Price': Calculate the SL from the average price in case you use safety orders.
'SL From Last SO.': Calculate the SL from the last (lowest) safety order deviation.
ex: If you choose 'SL From Avg. Price' and SL% is 5, then the SL will be lower than the average price by 5% (in this case your SL will be dynamic until the price reaches all the safety orders unlike the other two SL options).
Note: This indicator programmed to be compatible with '3COMMAS' platform, but I added more options that came to my mind.
'3COMMAS' DCA bots uses 'SL From Base Price'.
- 'Use TP': Activate to use take profit percentage.
- 'TP %': Take profit percentage.
- 'Pure TP,SL': This feature was created due to the differences in the method of calculations between API tools trading platforms:
If the feature is not activated and (for example) the TP is 5%, this means that the price must move upward by only 5%, but you will not achieve a net profit of 5% due to the trading fees. but If the feature is activated, this means that you will get a net profit of 5%, and this means that the price must move upward by (5% for the TP + the equivalent of trading fees). The same idea is applied to the SL.
Note: '3COMMAS' DCA bots uses activated 'Pure TP,SL'.
- 'SO. Price Deviation %': Determines the decline percentage for the first safety order from the trade start entry price.
- 'SO. Step Scale': Determines the deviation multiplier for the safety orders.
Note: I'm using the same method of calculations for SO. (safety orders) levels that '3COMMAS' platform is using. If there is any difference between the '3COMMAS' calculations and the platform that you are using, please let me know.
'3COMMAS' DCA bots minimum 'SO. Price Deviation %' is (0.21)
'3COMMAS' DCA bots minimum 'SO. Step Scale' is (0.1)
- 'SO. Volume Scale': Determines the base order size multiplier for the safety orders sizes.
ex: If you used 10$ to buy at the trade start (base order size) and your 'SO. Volume Scale' is 2, then the 1st SO. size will be 20, the 2nd SO. size will be 40 and so on.
- 'SO. Count': Determines the number of safety orders that you want. If you want to trade without safety orders set it to zero.
'3COMMAS' DCA bots minimum 'SO. Volume Scale' is (0.1)
- 'Exchange Min. Size': The exchange minimum size per trade, It's important to prevent you from setting the base order Size less than the exchange limit. It's also important for the backtest results calculations.
ex: If you setup your strategy settings and it led to a loss to the point that you can't trade any more due to insufficient funds and your base order size share from the strategy becomes less than the exchange minimum trade size, then the indicator will show you a warning and will show you the point where you stopped the trading (It works in compatible with the initial capital). I recommend to set it a little bit higher than the real exchange minimum trade size especially if you trade without safety orders to not stuck in the trade if you hit the stop loss
- 'BO. Size': The base order size (funds you use at the trade entry).
- 'Initial Capital': The total funds allocated for trading using your strategy settings, It can be more than what is required in the strategy to cover the deficit in case of a loss, but it should not exceed the funds that you actually have for trading using this strategy settings, It's important to prevent you from setting up a strategy which requires funds more than what you have. It's also has other important benefits (refer to 'Exchange Min. Size' for more information).
- 'Accumulative Results': This feature is also called re-invest profits & risk reduction. If it's not activated then you will use the same funds size in each new trade whether you are in profit or loss till the (initial capitals + net results) turns insufficient. If it's activated then you will reuse your profits and losses in each new trade.
ex: The feature is active and your first trade ended with a net profit of 1000$, the next trade will add the 1000$ to the trade funds size and it will be distributed as a percentage to the BO. & SO.s according to your strategy settings. The same idea in case of a loss, the trade funds size will be reduced.
D) 'RSI Strategy' Section:
- 'Buy': RSI technical condition to start a trade. Has no effect if you don't choose 'RSI' option in 'Buy Strategies'.
- 'Exit': RSI technical condition to exit a trade. Has no effect if you don't choose 'RSI' option in 'Exit Strategies'.
E) 'TV Strategy' Section:
- 'Buy': TradingView Crypto Screener technical condition to start a trade. Has no effect if you don't choose 'TV' option in 'Buy Strategies'.
- 'Exit': TradingView Crypto Screener technical condition to exit a trade. Has no effect if you don't choose 'TV' option in 'Exit Strategies'.
F) 'BB %B Strategy' Section:
- 'Buy': BB %B technical condition to start a trade. Has no effect if you don't choose 'BB %B' option in 'Buy Strategies'.
- 'Exit': BB %B technical condition to exit a trade. Has no effect if you don't choose 'BB %B' option in 'Exit Strategies'.
G) 'Plot' Section:
- 'Signals': Plots buy and exit signals.
- 'BO': Plots the trade entry price (base order price).
- 'AVG': Plots the trade average price.
- 'AVG options box': Your choice to plot the trade average price type:
'Avg. With Fees': The trade average price including the trading fees, If you exit the trade at this price the trade net profit will be 0.00
'Avg. Without Fees': The trade average price but not including the trading fees, If you exit the trade at this price the trade net profit will be a loss equivalent to the trading fees.
- 'TP': Plots the trade take profit price.
- 'SL': Plots the trade stop loss price.
- 'Last SO': Plots the trade last safety order that the price reached.
- 'Exit Price': Plots a mark on the trade exit price, It plots in 3 colors as below:
Red (Default): Trade exit at a loss.
Green (Default): Trade exit at a profit.
Yellow (Default): Trade exit at a profit but this is a special case where we have to calculate the profits before reaching the safety orders (if any) on that candle (compatible with the idea of getting strategy results at the worst case).
- 'Result Table': Plots your strategy result table. The net profit percentage shown is a percentage of the 'initial capital'.
- 'TA Values': Plots your used strategies Technical analysis values. (Green cells means valid condition).
- 'Help Table': Plots a table to help you discover 100 safety orders with its deviations and the total funds needed for your strategy settings. Deviations shown in red is impossible to use because its price is <= 0.00
- 'Portfolio Chart': Plots your Portfolio status during the entire trading period in addition to the highest and lowest level reached. It's important when evaluating any strategy not only to look at the final result, but also to look at the change in results over the entire trading period. Perhaps the results were worryingly negative at some point before they rose again and made a profit. This feature helps you to see the whole picture.
- 'Welcome Message': Plots a welcome message and showing you the idea behind this indicator.
- 'Green Net Profit %': It plots the 'Net Profit %' in the result table in green color if the result is equal to or above the value that you entered.
- 'Green Win Rate %': It plots the 'Win Rate %' in the result table in green color if the result is equal to or above the value that you entered.
- 'User Notes Area': An empty text area, Feel free to use this area to write your notes so you don't forget them.
The indicator will take care of you. In some cases, warning messages will appear for you. Read them carefully, as they mean that you have done an illogical error in the indicator settings. Also, the indicator will sometimes stop working for the same reason mentioned above. If that happens then click on the red (!) next to the indicator name and read the message to find out what illogical error you have done.
Please enjoy the indicator and let me know your thoughts in the comments below.

LSMA Z-Score [BackQuant]LSMA Z-Score
Main Features and Use in the Trading Strategy
- The indicator normalizes the LSMA into a detrended Z-Score, creating an oscillator with standard deviation levels to indicate trend strength.
- Adaptive coloring highlights the rate of change and potential reversals, with different colors for positive and negative changes above and below the midline.
- Extreme levels with adaptive coloring indicate the probability of a reversion, providing strategic entry or exit points.
- Alert conditions for crossing the midline or significant shifts in trend direction enhance its utility within a trading strategy.
1. What is an LSMA?
The Least Squares Moving Average (LSMA) is a technical indicator that smoothens price data to help identify trends. It uses the least squares regression method to fit a straight line through the selected price points over a specified period. This approach minimizes the sum of the squares of the distances between the line and the price points, providing a more statistically grounded moving average that can adapt more smoothly to price changes.
2. What is a Z-Score?
A Z-Score is a statistical measurement that describes a value's relationship to the mean of a group of values, measured in terms of standard deviations from the mean. If a Z-Score is 0, it indicates that the data point's score is identical to the mean score. A Z-Score helps in understanding if a data point is typical for a given data set or if it is atypical. In finance, a Z-Score is often used to measure how far a piece of data is from the average of a set, which can be helpful in identifying outliers or unusual data points.
3. Why Turning LSMA into a Z-Score is Innovative and Its Benefits
Converting LSMA into a Z-Score is innovative because it combines the trend identification capabilities of the LSMA with the statistical significance testing of Z-Scores. This transformation normalizes the LSMA, creating a detrended oscillator that oscillates around a mean (zero line), with standard deviation levels to show trend strength. This method offers several benefits:
Enhanced Trend Detection:
- By normalizing the LSMA, traders can more easily identify when the price is deviating significantly from its trend, which can signal potential trading opportunities.
Standardization:
- The Z-Score transformation allows for comparisons across different assets or time frames, as the score is standardized.
Objective Measurement of Trend Strength:
- The use of standard deviation levels provides an objective measure of trend strength and volatility.
4. How It Can Be Used in the Context of a Trading System
This indicator can serve as a versatile tool within a trading system for a range of things:
Trend Confirmation:
- A positive Z-Score can confirm an uptrend, while a negative Z-Score can confirm a downtrend, providing traders with signals to enter or exit trades.
Oversold/Overbought Conditions:
- Extreme Z-Score levels can indicate overbought or oversold conditions, suggesting potential reversals or pullbacks.
Volatility Assessment:
- The standard deviation levels can help traders assess market volatility, with wider bands indicating higher volatility.
5. How It Can Be Used for Trend Following
For trend following strategies, this indicator can be particularly useful:
Trend Strength Indicator:
- By monitoring the Z-Score's distance from zero, traders can gauge the strength of the current trend, with larger absolute values indicating stronger trends.
Directional Bias:
- Positive Z-Scores can be used to establish a bullish bias, while negative Z-Scores can establish a bearish bias, guiding trend following entries and exits.
Color-Coding for Trend Changes :
- The adaptive coloring of the indicator based on the rate of change and extreme levels provides visual cues for potential trend reversals or continuations.
Thus following all of the key points here are some sample backtests on the 1D Chart
Disclaimer: Backtests are based off past results, and are not indicative of the future.
This is using the Midline Crossover:
INDEX:BTCUSD
INDEX:ETHUSD
BINANCE:SOLUSD
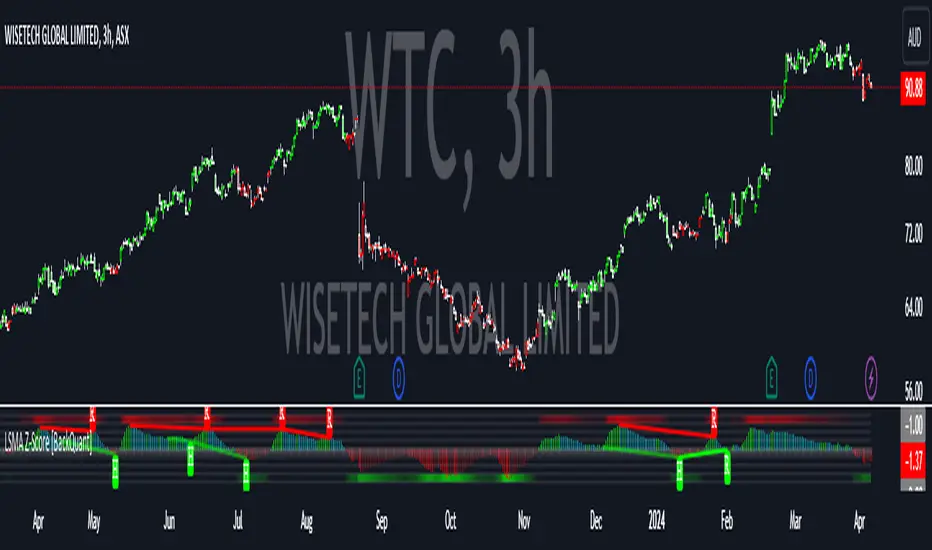
Customizable MACD (how to detect a strong convergence)Helloooo traders
I wondered once if a MACD was based on an EMA/EMA/SMA or SMA/SMA/EMA (or WHATEVA/WHATEVA/WHATEVA).
Seems they're so many alternatives out there.
I decided to empower my audience more by choosing the type of moving averages you want for your MACD.
More options doesn't always mean better performance - but who knows - some might find a config that they like with it for their favorite asset/timeframe.
I added also a multi-timeframe component because I'm a nice guy ^^
Convergence is my BEST friend
An oscillator (like MACD) is to measure how strong a momentum is - generally, traders use those indicators to confirm a trend.
So understand that a MACD (or any other indicator not based on convergence ) won't likely be sufficient for doing great on the market.
Combined with your favorite indicator, however, you may get great results.
My indicators fav cocktail is mixing :
1) an oscillator (momentum confirmation)
2) a trendline/key level break (momentum confirmation)
3) adding-up on a different trading method but still converging with the first entry.
The reason I'm deep with convergence detection is because I'm obsessed with removing those fakeout signals. You know which ones I'm talking about :)
Those trades when the market goes sideways but our capital goes South (pun 100% intended) - 2 days later, the price hasn't changed much but some lost some capital due to fees, being overexposed, buying the top/selling the bottom of a range they didn't identify.
It's publicly known that ranges are the worst traders' enemy. It's boring, not fun, and .... end up moving in the direction we expected when we go to sleep or outside.
NO ONE/BROKER/EX-GF is tracking your computer - I checked also for mine as it happened for me way too often in the past.
I surely preferred blaming a few external unknown conditions than improving my TA back in the days #bad #dave
But my backtest sir...
Our backtests show what they're being told to show . A backtest without a stop-loss/hard exit logic will show incredible results.
Then trying that backtest with live trading is like in the Matrix movie - discovering the real world is tough and we must choose between the blue pill (learning how to evaluate properly risk/opportunity caught) and the red pill (increasing the position sizing, not setting a stop loss, holding the positions hoping for the best)
Last few words
Convergences aren't invented because it's cool to mix indicators with others. (it is actually and even fun)
They're created to remove most of the fakeouts . For those that can't be removed - a strong risk management would cut most of the remaining potential big losses.
No system works 100% of the time - so a convergence system needs a back-up plan in case the converged signal is wrong (could be stop-loss, hard exit, reducing position sizing, ...)
Wishing you the BEST and happy beginning of your week
Daveatt

Put Option Profits inspired by Travis Wilkerson; SPX BacktesterPut Option Profits — Travis Wilkerson inspired. This tester evaluates a simple monthly SPX at-the-money credit-spread timing idea: enter on a fixed calendar rule (e.g., 1st Friday or 8th day with business-day shifting) at Open or Close, then exit exactly N calendar days later (first tradable day >= target, at Close). A trade is marked WIN if price at exit is above the entry price (1:1 risk proxy).
The book suggests forward testing 60-day and 180-day expirations to prove the concept. This tool lets you backtest both (and more) to see what actually works best. In the book, profits are taken when the spread reaches ~80% of max credit; losers are left to expire and cash-settle. This backtester does not model early profit-taking—every trade is held to the configured hold period and evaluated on price vs entry at the exit close. Think of it as a pure “set it and forget it” stress test. In live trading, you can still follow Travis’s 80% take-profit rule; TradingView just doesn’t simulate that here. Happy trading!
Features:
Schedule: Day-of-Month (with Prev/Next business-day shift, optional “stay in month”) or Nth Weekday (e.g., 1st Friday).
Entry timing: Open or Close.
Exit: N calendar days later at Close (holiday/weekend aware).
Filters: Optional EMA-200 “risk-on” filter.
Scope: Date range limiter.
Visuals: Entry/exit bubbles (paired colors) or simple win/loss dots.
Table: Overall Win% and N (within range).
Alerts: Entry alert (static condition + dynamic alert() message).
How to use:
[* ]Choose Start Mode (NthWeekday or DayOfMonth) and parameters (e.g., 1st Friday or DOM=8, PrevBizDay).
Pick Entry Timing (Open or Close).
Set Days In Trade (e.g., 150).
(Optional) Enable EMA filter and set Date Range.
Turn Bubbles on/off and/or Dots on/off.
Create alert:
Simple ping: Condition = this indicator -> Monthly Entry Signal -> “Once per bar” (Open) or “Once per bar close” (Close).
Rich message: Condition = this indicator -> Any alert() function call.
Notes:
Keep DOM shift in same month: when a DOM falls on a weekend/holiday, PrevBizDay/NextBizDay shift will stay inside the month if enabled; otherwise it can spill into the prior/next month. (Ignored for NthWeekday.)
Credits: Concept sparked by “Put Option Profits – How to turn ten minutes of free time into consistent cash flow each month” by Travis Wilkerson; this script is a neutral research tool (not financial advice).

[DEM] MLR Signal (With Backtesting) MLR Signal (With Backtesting) is designed to generate buy signals using a machine learning regression model that analyzes multiple technical indicators from a reference symbol (default NDX) to predict market direction and identify optimal entry points. It also includes a comprehensive backtesting framework to evaluate the historical performance of these signals. The indicator overlays directly on the price chart, plotting signals and displaying performance statistics in a table while coloring bars green for bullish predictions and red for bearish predictions. The MLR model processes ten input features including RSI, MACD components, moving average relationships, and price momentum changes, applying predetermined coefficients to generate a prediction score that determines market bias, with buy signals triggered only when specific sequential patterns of bullish predictions occur (requiring particular arrangements of consecutive bullish and bearish predictions over recent bars) to filter for higher-confidence entry opportunities while tracking signal accuracy and returns through integrated backtesting.

CAGR - Candle based BackTesterThe "CAGR - Candle based BackTester" is a tool for traders and investors seeking precise insights into individual candle performance!
Do you want to backtest based on candles and understand their CAGR? Curious about the average CAGR of all candles? Interested in comparing how an individual candle performs against others? Then this tool is your go-to solution.
How It Works:
Candle Selection: Specify a start date, and watch as the script tracks investments from that point forward.
Dynamic Calculations: Experience real-time CAGR calculations that adapt as market conditions evolve.
CAGR Display: At the final candle, gain insights into individual CAGR, average CAGR of all candles, alpha (difference), and outperformance percentage—all conveniently displayed for informed decision-making.
Key Features:
Accurate Candle-based CAGR Calculation: Gain clarity on investment performance with precise CAGR metrics.
Lumpsum Investment Tracking: Track lumpsum investments seamlessly with detailed share and investment calculations.
Outperformance Metrics: Measure how your investment performs relative to others with dedicated outperformance metrics.
User-Friendly Visualization: Access intuitive charts and visuals that simplify complex financial data.

[blackcat] L2 VWAP CCI Trading SystemLevel: 2
Background
Volume-Weighted Average Price (VWAP) is a trading benchmark used by traders that indicates the average price that a security has traded for throughout the day based on volume and price. This is important as it gives traders insight into the trend and value of a security.
The Commodity Channel Index (CCI) indicator was created to identify bullish and bearish market cycles, as well as to define market turning points and the strongest and weakest market periods. CCI was developed for commodities and quickly found application in other markets, including forex.
Function
blackcat L2 VWAP CCI Trading System is an innovative indicator that combines vwap and cci indicator together. Not only long and short entries can be disclosed, but also the overbought and oversold zones are clearly observed.
Key Signal
cci ---> vwap cci indicator output
long --> long entry condition
short --> short entry condition
backtest --> indicator backtest scheme "NLX-L3 Backtest" required input source for strategy backtest
longentry --> visual long entry
shortentry --> visual short entry
Pros and Cons
Pros:
1. exact long and short entries are produced by overbought and oversold conditions
2. support "NLX-L3 Backtest" framework
Cons:
1. noise may be produced under extreme market condition
2. due to this is un-optimized version, time frame and trading pairs need to be selected
Remarks
Courtesy of @nilux "NLX-L3 Backtest" easy backtest framework for dummies.
Step by step backtest guide with "NLX-L3 Backtest" framework:
STEP1: Add this indicator into your chart
STEP2: Add "NLX-L3 Backtest" into your chart
STEP3: Click "Settings" gear icon of "NLX-L3 Backtest" to select "Select L2 Indicator" in the 1st line as "blackcat L2 VWAP CCI Trading System: backtest"
STEP4: Configure your backtest other settings under "NLX-L3 Backtest" framework
STEP5: Click "OK" and view the results in "Strategy Tester" tab
Readme
In real life, I am a prolific inventor. I have successfully applied for more than 60 international and regional patents in the past 12 years. But in the past two years or so, I have tried to transfer my creativity to the development of trading strategies. Tradingview is the ideal platform for me. I am selecting and contributing some of the hundreds of scripts to publish in Tradingview community. Welcome everyone to interact with me to discuss these interesting pine scripts.
The scripts posted are categorized into 5 levels according to my efforts or manhours put into these works.
Level 1 : interesting script snippets or distinctive improvement from classic indicators or strategy. Level 1 scripts can usually appear in more complex indicators as a function module or element.
Level 2 : composite indicator/strategy. By selecting or combining several independent or dependent functions or sub indicators in proper way, the composite script exhibits a resonance phenomenon which can filter out noise or fake trading signal to enhance trading confidence level.
Level 3 : comprehensive indicator/strategy. They are simple trading systems based on my strategies. They are commonly containing several or all of entry signal, close signal, stop loss, take profit, re-entry, risk management, and position sizing techniques. Even some interesting fundamental and mass psychological aspects are incorporated.
Level 4 : script snippets or functions that do not disclose source code. Interesting element that can reveal market laws and work as raw material for indicators and strategies. If you find Level 1~2 scripts are helpful, Level 4 is a private version that took me far more efforts to develop.
Level 5 : indicator/strategy that do not disclose source code. private version of Level 3 script with my accumulated script processing skills or a large number of custom functions. I had a private function library built in past two years. Level 5 scripts use many of them to achieve private trading strategy.
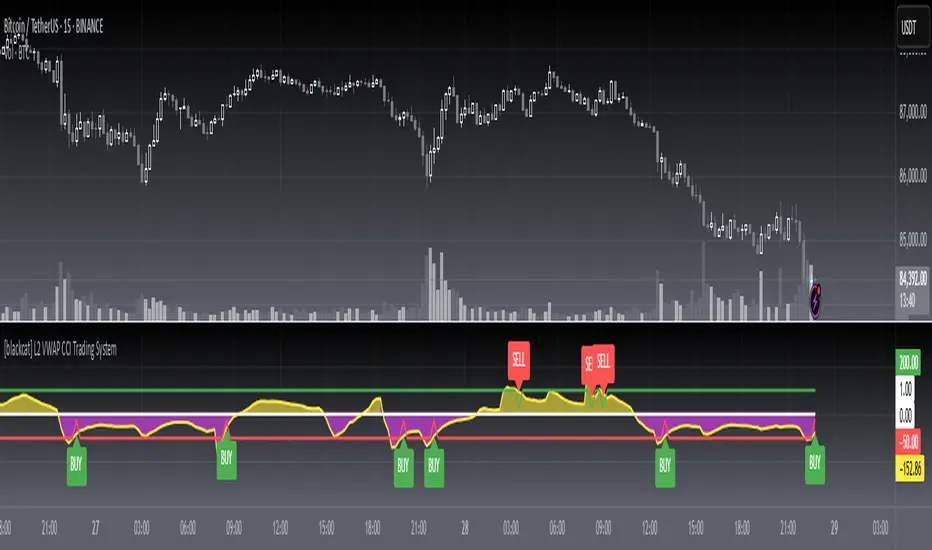
Candle Crawler V1 [Moon]Candle Crawler is designed to crawl back through candle and bar data to retrieve specific values of interest.
The first implementation shows
Total bars or candles on any specific time frame or asset to the beginning of the chart. This can be used for backtesting or looking for specific assets / time frames that have a lot of backtest data.
- *usually* More backtest data = More accurate strategy implementation or live testing.
Crawls back and counts Red vs Green candles in a defined period (the max is 4999 total bars).
Use this to identify bearish or bullish trends and assets.
- *hint* if an asset through time is leaning heavily one way, a long-only or short-only strategy may be worth investigating.
Plots days of the week on each candle within it's specific day (turned off by default).
Default view of Total Candles + R/G (note if you want to turn off the labels go to the "Style" tab and just uncheck "Labels" at the bottom).
Works on any asset or timeframe including stocks and forex.
Easily filter days on or off to identify specific patterns or trends (check the "days of the week" box for ON|OFF) or head to the "style" tab to customize days or colors.
Most precise on the Daily (D) timeframe, but applicable on any.
If interested send me a DM.
