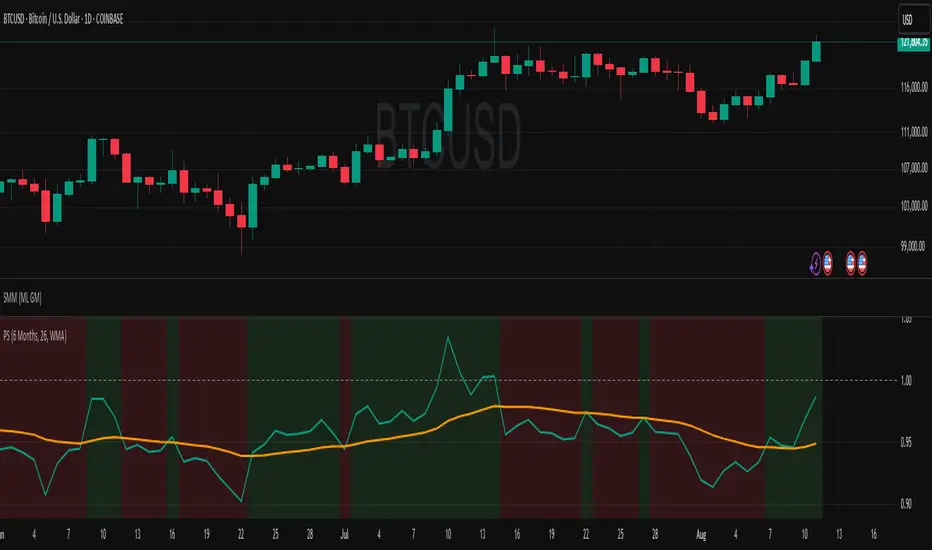
Relative StrengthDescription:
This indicator provides a simplified yet powerful method for measuring a stock's momentum based on its proximity to its recent high. It is a direct implementation of a trading concept discussed in a lecture from the New York Institute of Finance.
Core Concept
The underlying theory, supported by academic research, is that a stock making a new high is one of the most bullish signals possible. Such stocks have a statistical tendency to continue making new highs in the near term.
Instead of requiring complex relative strength calculations against a universe of stocks, this indicator uses a simple and elegant ratio to act as a proxy for momentum:
Indicator Value = Current Close / Highest High of Lookback Period
A value approaching 1.0 indicates the stock is strong and nearing a new high. A value at 1.0 means a new high has just been made.
How to Use This Indicator
The indicator consists of two primary components:
RS Line (Teal): The core momentum calculation (Close / High).
Signal MA (Orange): A moving average of the NHRS Line, which acts as the trigger for signals.
The signals are generated based on the crossover between these two lines:
BUY Signal: When the RS Line crosses ABOVE its moving average. This suggests that short-term momentum is accelerating and a new uptrend may be starting. The background will turn green.
SELL Signal: When the RS Line crosses BELOW its moving average. This indicates that momentum is fading and it may be prudent to exit the position to avoid a decline. The background will turn red.
Indicator Settings
You can customize the indicator to fit your trading style and the timeframe you are analyzing:
High Lookback Period: Choose the period for the "Highest High" calculation. Options range from 1 Month to 12 Months (52 weeks), allowing you to measure short-term or long-term strength.
Moving Average Length: Adjust the length of the signal line's moving average. The lecturer defaults to 26 weeks for a six-month view.
Moving Average Type: Select the type of moving average for the signal line (SMA, EMA, WMA, HMA).
Credits and Inspiration
Proper credit is essential. This script is a practical application of a concept that builds upon foundational academic work.
The core idea that a stock's proximity to its 52-week high is an investable anomaly was detailed in the 2004 Journal of Finance paper:
"The 52 Week High and Momentum Investing" by Thomas J. George and Chuan-Yang Hwang.
The lecturer's contribution, which this script implements, was to simplify this concept into an actionable trading tool by applying a moving average crossover to generate clear and objective buy and sell signals.
Disclaimer: This tool is for educational and informational purposes only. It is not financial advice. All trading involves risk, and you should always perform your own research and backtesting before making any trading decisions.
在脚本中搜索"backtesting"
Crypto Risk-Weighted Allocation SuiteCrypto Risk-Weighted Allocation Suite
This indicator is designed to help users explore dynamic portfolio allocation frameworks for the crypto market. It calculates risk-adjusted allocation weights across major crypto sectors and cash based on multi-factor momentum and volatility signals. Best viewed on INDEX:BTCUSD 1D chart. Other charts and timeframes may give mixed signals and incoherent allocations.
🎯 How It Works
This model systematically evaluates the relative strength of:
BTC Dominance (CRYPTOCAP:BTC.D)
Represents Bitcoin’s share of the total crypto market. Rising dominance typically indicates defensive market phases or BTC-led trends.
ETH/BTC Ratio (BINANCE:ETHBTC)
Gauges Ethereum’s relative performance versus Bitcoin. This provides insight into whether ETH is leading risk appetite.
SOL/BTC Ratio (BINANCE:SOLBTC)
Measures Solana’s performance relative to Bitcoin, capturing mid-cap layer-1 strength.
Total Market Cap excluding BTC and ETH (CRYPTOCAP:TOTAL3ES)
Represents Altcoins as a broad category, reflecting appetite for higher-risk assets.
Each of these series is:
✅ Converted to a momentum slope over a configurable lookback period.
✅ Standardized into Z-scores to normalize changes relative to recent behavior.
✅ Smoothed optionally using a Hull Moving Average for cleaner signals.
✅ Divided by ATR-based volatility to create a risk-weighted score.
✅ Scaled to proportionally allocate exposure, applying user-configured minimum and maximum constraints.
🪙 Dynamic Allocation Logic
All signals are normalized to sum to 100% if fully confident.
An overall confidence factor (based on total signal strength) scales the allocation up or down.
Any residual is allocated to cash (unallocated capital) for conservative exposure.
The script automatically avoids “all-in” bias and prevents negative allocations.
📊 Outputs
The indicator displays:
Market Phase Detection (which asset class is currently leading)
Risk Mode (Risk On, Neutral, Risk Off)
Dynamic Allocations for BTC, ETH, SOL, Alts, and Cash
Optional momentum plots for transparency
🧠 Why This Is Unique
Unlike simple dominance indicators or crossovers, this model:
Integrates multiple cross-asset signals (BTC, ETH, SOL, Alts)
Adjusts exposure proportionally to signal strength
Normalizes by volatility, dynamically scaling risk
Includes configurable constraints to reflect your own risk tolerance
Provides a cash fallback allocation when conviction is low
Is entirely non-repainting and based on daily closing data
⚠️ Disclaimer
This script is provided for educational and informational purposes only.
It is not financial advice and should not be relied upon to make investment decisions.
Past performance does not guarantee future results.
Always consult a qualified financial advisor before acting on any information derived from this tool.
🛠 Recommended Use
As a framework to visualize relative momentum and risk-adjusted allocations
For research and backtesting ideas on portfolio allocation across crypto sectors
To help build your own risk management process
This script is not a turnkey strategy and should be customized to fit your goals.
✅ Enjoy exploring dynamic crypto allocations responsibly!

Random Coin Toss Strategy📌 Overview
This strategy is a probability-based trading simulation that randomly decides trade direction using a coin-toss mechanism and executes trades with a customizable risk-reward ratio. It's designed primarily for testing entry frequency and risk dynamics, not predictive accuracy.
🎯 Core Concept
Every N bars (configurable), the strategy performs a pseudo-random coin toss.
Based on the result:
If heads → Buy
If tails → Sell
Once a position is opened, it sets a Stop-Loss (SL) and Take-Profit (TP) based on a multiple of the current ATR (Average True Range) value.
⚙️ Configurable Inputs
ATR Length Period for ATR calculation, determines volatility basis.
SL Multiplier SL distance = ATR × multiplier (e.g., 1.0 means 1x ATR) .
TP Multiplier TP distance = ATR × multiplier (e.g., 2.0 = 2x ATR) .
Entry Frequency Bars to wait between each new coin toss decision.
Show TP/SL Zones Toggle on/off for drawing visual TP and SL zones.
Box Size Number of bars used to define the width of the TP/SL boxes.
🔁 Entry & Exit Logic
Entry:
Happens only when no current position exists and it's the correct bar interval.
Entry direction is randomly decided.
Exit:
Positions exit at either:
Take-Profit (TP) level
Stop-Loss (SL) level
Both are calculated using the configured ATR-based distances.
🖼️ Visual Features
TP and SL zones:
Rendered as shaded rectangles (boxes) only once per trade.
Green box for TP zone, red box for SL zone.
Automatically deleted and redrawn for each new trade to avoid chart clutter.
ATR Display Table:
A minimal info table at the top-right shows the current ATR value.
Updates every few bars for performance.
🧪 Use Cases
Ideal for risk-reward modeling, strategy prototyping, and understanding how volatility-based SL/TP behavior affects results.
Great for backtesting frequency, RR tweaks (e.g., 2:5 or 3:1), and execution structure in random conditions.
⚠️ Disclaimer
Since the trade direction is random, this script is not meant for predictive trading but serves as a powerful experiment framework for studying how SL, TP, and volatility interact with random chance in a controlled, repeatable system.

Trend Tracker ProTrend Tracker Pro - Advanced Trend Following Indicator
Overview
Trend Tracker Pro is a sophisticated trend-following indicator that combines the power of Exponential Moving Average (EMA) and Average True Range (ATR) to identify market trends and generate precise buy/sell signals. This indicator is designed to help traders capture trending moves while filtering out market noise.
🎯 Key Features
✅ Dynamic Trend Detection
Uses EMA and ATR-based bands to identify trend direction
Automatically adjusts to market volatility
Clear visual trend line that changes color based on market direction
✅ Precise Signal Generation
Buy signals when trend changes to bullish
Sell signals when trend changes to bearish
Reduces false signals by requiring actual trend changes
✅ Visual Clarity
Green trend line: Bullish trend
Red trend line: Bearish trend
Gray trend line: Sideways/neutral trend
Triangle arrows for buy/sell signals
Clear BUY/SELL text labels
✅ Customizable Settings
Trend Length: Adjustable period for EMA and ATR calculation (default: 14)
ATR Multiplier: Controls sensitivity of trend bands (default: 2.0)
Show/Hide Signals: Toggle signal arrows on/off
Show/Hide Labels: Toggle text labels on/off
✅ Built-in Information Panel
Real-time trend direction display
Current trend level value
ATR value for volatility reference
Last signal information
✅ TradingView Alerts
Buy signal alerts
Sell signal alerts
Customizable alert messages
🔧 How It Works
Algorithm Logic:
1.
Calculate EMA: Uses exponential moving average for trend baseline
2.
Calculate ATR: Measures market volatility
3.
Create Bands: Upper band = EMA + (ATR × Multiplier), Lower band = EMA - (ATR × Multiplier)
4.
Determine Trend:
Price above upper band → Bullish trend (trend line = lower band)
Price below lower band → Bearish trend (trend line = upper band)
Price between bands → Continue previous trend
5.
Generate Signals: Signal occurs when trend direction changes
📊 Best Use Cases
✅ Trending Markets
Excellent for capturing strong directional moves
Works well in both bull and bear markets
Ideal for swing trading and position trading
✅ Multiple Timeframes
Effective on all timeframes from 15 minutes to daily
Higher timeframes provide more reliable signals
Can be used for both scalping and long-term investing
✅ Various Asset Classes
Stocks, Forex, Cryptocurrencies, Commodities
Particularly effective in volatile markets
Adapts automatically to different volatility levels
⚙️ Recommended Settings
Conservative Trading (Lower Risk)
Trend Length: 20
ATR Multiplier: 2.5
Best for: Long-term positions, lower frequency signals
Balanced Trading (Default)
Trend Length: 14
ATR Multiplier: 2.0
Best for: Swing trading, moderate frequency signals
Aggressive Trading (Higher Risk)
Trend Length: 10
ATR Multiplier: 1.5
Best for: Day trading, higher frequency signals
🎨 Visual Elements
Trend Line: Main indicator line that follows the trend
Signal Arrows: Triangle shapes indicating buy/sell points
Text Labels: Clear "BUY" and "SELL" text markers
Information Table: Real-time status panel in top-right corner
Color Coding: Intuitive green/red color scheme
⚠️ Important Notes
Risk Management
Always use proper position sizing
Set stop-losses based on ATR values
Consider market conditions and volatility
Not recommended for ranging/sideways markets
Signal Confirmation
Consider using with other indicators for confirmation
Pay attention to volume and market structure
Be aware of major news events and market sessions
Backtesting Recommended
Test the indicator on historical data
Optimize parameters for your specific trading style
Consider transaction costs in your analysis

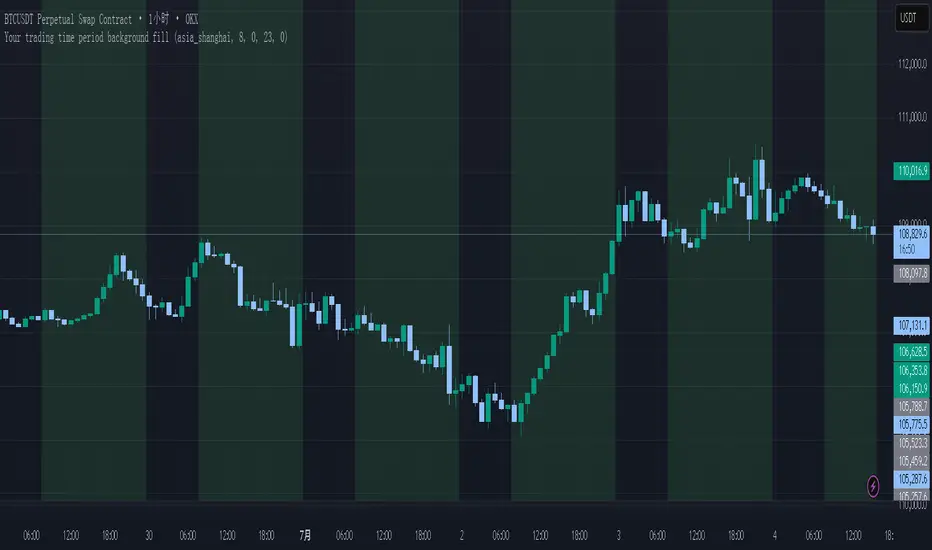
Your trading time period background fillThis script allows you to add background highlights to charts during any regional trading session, customize your own trading time, and is precise and customizable yet simple and easy to use, making it more convenient to review transactions.
Support global mainstream time zones: The drop-down list includes 30 commonly used IANA time zones (default is Asia/Shanghai) (such as Asia/Shanghai, America/New_York, Europe/London, etc.), one-click switching, no need to manually calculate the time difference.
Fully localized time input: "Start hour/minute" and "End hour/minute" are filled in with the local time of the selected time zone. The end hour defaults to 23:00 and can be adjusted to 0-23 at will.
Accurate time difference splitting: The script internally splits the time zone offset into whole hours and remainder minutes (supports half-hour zones, such as UTC+5:30), and ensures that all parameters are integers when calling timestamp to avoid errors.
Dynamic background rendering: Each K-line is judged according to the UTC timestamp whether it falls within the set range. If it meets the time period, it will be marked with a semi-transparent green background, and it will return to its original state after crossing the time period, helping you to identify the opening, closing or active period of any market at a glance.
Wide range of scenarios: It can be used for time-sharing highlighting of all-weather varieties of foreign exchange and cryptocurrency, and can also be used in conjunction with backtesting and timing strategies to only send signals during the active period of the target market, greatly improving trading efficiency and strategy accuracy.
Just select the region and set the time, and the script will automatically complete all complex time zone conversions and drawing, allowing you to focus on the transaction itself.
Warrior Trading Momentum Strategy
# 🚀 Warrior Trading Momentum Strategy - Day Trading Excellence
## Strategy Overview
This comprehensive Pine Script strategy replicates the proven methodologies taught by Ross Cameron and the Warrior Trading community. Designed for active day traders, it identifies high-probability momentum setups with strict risk management protocols.
## 📈 Core Trading Setups
### 1. Gap and Go Trading
- **Primary Focus**: Stocks gapping up 2%+ with volume confirmation
- **Entry Logic**: Breakout above gap open with momentum validation
- **Volume Filter**: 2x average volume requirement for quality setups
### 2. ABCD Pattern Recognition
- **Pattern Detection**: Automated identification of classic ABCD reversal patterns
- **Validation**: A-B and C-D move relationship analysis
- **Entry Trigger**: D-point breakout with volume confirmation
### 3. VWAP Momentum Plays
- **Strategy**: Entries near VWAP with bounce confirmation
- **Distance Filter**: Configurable percentage distance for optimal entries
- **Direction Bias**: Above VWAP bullish momentum validation
### 4. Red to Green Reversals
- **Setup**: Reversal patterns after consecutive red candles
- **Confirmation**: Volume spike with bullish close required
- **Momentum**: Trend change validation with RSI support
### 5. Breakout Momentum
- **Logic**: Breakouts above recent highs with volume
- **Filters**: EMA20 and RSI confirmation for quality
- **Trend**: Established momentum direction validation
## ⚡ Key Features
### Smart Risk Management
- **Position Sizing**: Automatic calculation based on account risk percentage
- **Stop Loss**: 2 ATR-based stops for volatility adjustment
- **Take Profit**: Configurable risk-reward ratios (default 1:2)
- **Trailing Stops**: Profit protection with adjustable triggers
### Advanced Filtering System
- **Time Filters**: Market hours trading with lunch hour avoidance
- **Volume Confirmation**: Multi-timeframe volume analysis
- **Momentum Indicators**: RSI and moving average trend validation
- **Quality Control**: Multiple confirmation layers for signal accuracy
### PDT-Friendly Design
- **Trade Limiting**: Built-in daily trade counter for accounts under $25K
- **Selective Trading**: Priority scoring system for A+ setups only
- **Quality over Quantity**: Maximum 2-3 high-probability trades per day
## 🎯 Optimal Usage
### Best Timeframes
- **Primary**: 5-minute charts for entry timing
- **Secondary**: 1-minute for precise execution
- **Context**: Daily charts for gap analysis
### Ideal Market Conditions
- **Volatility**: High-volume, momentum-driven markets
- **Stocks**: Market cap $100M+, average volume 1M+ shares
- **Sectors**: Technology, biotech, growth stocks with news catalysts
### Account Requirements
- **Minimum**: $500+ for proper position sizing
- **Recommended**: $25K+ for unlimited day trading
- **Risk Tolerance**: Active day trading experience preferred
## 📊 Performance Optimization
### Entry Criteria (All Must Align)
1. ✅ Time filter (market hours, avoid lunch)
2. ✅ Volume spike (2x+ average volume)
3. ✅ Momentum confirmation (RSI 50-80)
4. ✅ Trend alignment (above EMA20)
5. ✅ Pattern completion (setup-specific)
### Risk Parameters
- **Maximum Risk**: 1-2% per trade
- **Position Size**: 25% of account maximum
- **Stop Loss**: 2 ATR below entry
- **Take Profit**: 2:1 risk-reward minimum
## 🔧 Customization Options
### Gap Trading Settings
- Minimum gap percentage threshold
- Volume multiplier requirements
- Gap validation criteria
### Pattern Recognition
- ABCD ratio parameters
- Swing point sensitivity
- Pattern completion filters
### Risk Management
- Risk-reward ratio adjustment
- Maximum daily trade limits
- Trailing stop trigger levels
### Time and Session Filters
- Trading session customization
- Lunch hour avoidance toggle
- Market condition filters
## ⚠️ Important Disclaimers
### Risk Warning
- **High Risk**: Day trading involves substantial risk of loss
- **Capital Requirements**: Only trade with risk capital
- **Experience**: Strategy requires active monitoring and experience
- **Market Conditions**: Performance varies with market volatility
### PDT Considerations
- **Day Trading Rules**: Accounts under $25K limited to 3 day trades per 5 days
- **Compliance**: Strategy includes trade counting for PDT compliance
- **Alternative**: Consider swing trading modifications for smaller accounts
### Backtesting vs Live Trading
- **Slippage**: Real trading involves execution delays and slippage
- **Commissions**: Factor in broker fees for accurate performance
- **Market Impact**: Large positions may affect fill prices
- **Psychological Factors**: Live trading involves emotional challenges
## 📚 Educational Value
This strategy serves as an excellent learning tool for understanding:
- Professional day trading methodologies
- Risk management principles
- Pattern recognition techniques
- Volume and momentum analysis
- Multi-timeframe analysis
## 🤝 Community and Support
Based on proven Warrior Trading methodologies with active community support. Strategy includes comprehensive plotting and information tables for educational purposes and trade analysis.
---
**Disclaimer**: This strategy is for educational purposes. Past performance does not guarantee future results. Always practice proper risk management and never risk more than you can afford to lose.
**Tags**: #DayTrading #Momentum #WarriorTrading #GapAndGo #ABCD #VWAP #PatternTrading #RiskManagement

Aetherium Institutional Market Resonance EngineAetherium Institutional Market Resonance Engine (AIMRE)
A Three-Pillar Framework for Decoding Institutional Activity
🎓 THEORETICAL FOUNDATION
The Aetherium Institutional Market Resonance Engine (AIMRE) is a multi-faceted analysis system designed to move beyond conventional indicators and decode the market's underlying structure as dictated by institutional capital flow. Its philosophy is built on a singular premise: significant market moves are preceded by a convergence of context , location , and timing . Aetherium quantifies these three dimensions through a revolutionary three-pillar architecture.
This system is not a simple combination of indicators; it is an integrated engine where each pillar's analysis feeds into a central logic core. A signal is only generated when all three pillars achieve a state of resonance, indicating a high-probability alignment between market organization, key liquidity levels, and cyclical momentum.
⚡ THE THREE-PILLAR ARCHITECTURE
1. 🌌 PILLAR I: THE COHERENCE ENGINE (THE 'CONTEXT')
Purpose: To measure the degree of organization within the market. This pillar answers the question: " Is the market acting with a unified purpose, or is it chaotic and random? "
Conceptual Framework: Institutional campaigns (accumulation or distribution) create a non-random, organized market environment. Retail-driven or directionless markets are characterized by "noise" and chaos. The Coherence Engine acts as a filter to ensure we only engage when institutional players are actively steering the market.
Formulaic Concept:
Coherence = f(Dominance, Synchronization)
Dominance Factor: Calculates the absolute difference between smoothed buying pressure (volume-weighted bullish candles) and smoothed selling pressure (volume-weighted bearish candles), normalized by total pressure. A high value signifies a clear winner between buyers and sellers.
Synchronization Factor: Measures the correlation between the streams of buying and selling pressure over the analysis window. A high positive correlation indicates synchronized, directional activity, while a negative correlation suggests choppy, conflicting action.
The final Coherence score (0-100) represents the percentage of market organization. A high score is a prerequisite for any signal, filtering out unpredictable market conditions.
2. 💎 PILLAR II: HARMONIC LIQUIDITY MATRIX (THE 'LOCATION')
Purpose: To identify and map high-impact institutional footprints. This pillar answers the question: " Where have institutions previously committed significant capital? "
Conceptual Framework: Large institutional orders leave indelible marks on the market in the form of anomalous volume spikes at specific price levels. These are not random occurrences but are areas of intense historical interest. The Harmonic Liquidity Matrix finds these footprints and consolidates them into actionable support and resistance zones called "Harmonic Nodes."
Algorithmic Process:
Footprint Identification: The engine scans the historical lookback period for candles where volume > average_volume * Institutional_Volume_Filter. This identifies statistically significant volume events.
Node Creation: A raw node is created at the mean price of the identified candle.
Dynamic Clustering: The engine uses an ATR-based proximity algorithm. If a new footprint is identified within Node_Clustering_Distance (ATR) of an existing Harmonic Node, it is merged. The node's price is volume-weighted, and its magnitude is increased. This prevents chart clutter and consolidates nearby institutional orders into a single, more significant level.
Node Decay: Nodes that are older than the Institutional_Liquidity_Scanback period are automatically removed from the chart, ensuring the analysis remains relevant to recent market dynamics.
3. 🌊 PILLAR III: CYCLICAL RESONANCE MATRIX (THE 'TIMING')
Purpose: To identify the market's dominant rhythm and its current phase. This pillar answers the question: " Is the market's immediate energy flowing up or down? "
Conceptual Framework: Markets move in waves and cycles of varying lengths. Trading in harmony with the current cyclical phase dramatically increases the probability of success. Aetherium employs a simplified wavelet analysis concept to decompose price action into short, medium, and long-term cycles.
Algorithmic Process:
Cycle Decomposition: The engine calculates three oscillators based on the difference between pairs of Exponential Moving Averages (e.g., EMA8-EMA13 for short cycle, EMA21-EMA34 for medium cycle).
Energy Measurement: The 'energy' of each cycle is determined by its recent volatility (standard deviation). The cycle with the highest energy is designated as the "Dominant Cycle."
Phase Analysis: The engine determines if the dominant cycles are in a bullish phase (rising from a trough) or a bearish phase (falling from a peak).
Cycle Sync: The highest conviction timing signals occur when multiple cycles (e.g., short and medium) are synchronized in the same direction, indicating broad-based momentum.
🔧 COMPREHENSIVE INPUT SYSTEM
Pillar I: Market Coherence Engine
Coherence Analysis Window (10-50, Default: 21): The lookback period for the Coherence Engine.
Lower Values (10-15): Highly responsive to rapid shifts in market control. Ideal for scalping but can be sensitive to noise.
Balanced (20-30): Excellent for day trading, capturing the ebb and flow of institutional sessions.
Higher Values (35-50): Smoother, more stable reading. Best for swing trading and identifying long-term institutional campaigns.
Coherence Activation Level (50-90%, Default: 70%): The minimum market organization required to enable signal generation.
Strict (80-90%): Only allows signals in extremely clear, powerful trends. Fewer, but potentially higher quality signals.
Standard (65-75%): A robust filter that effectively removes choppy conditions while capturing most valid institutional moves.
Lenient (50-60%): Allows signals in less-organized markets. Can be useful in ranging markets but may increase false signals.
Pillar II: Harmonic Liquidity Matrix
Institutional Liquidity Scanback (100-400, Default: 200): How far back the engine looks for institutional footprints.
Short (100-150): Focuses on recent institutional activity, providing highly relevant, immediate levels.
Long (300-400): Identifies major, long-term structural levels. These nodes are often extremely powerful but may be less frequent.
Institutional Volume Filter (1.3-3.0, Default: 1.8): The multiplier for detecting a volume spike.
High (2.5-3.0): Only registers climactic, undeniable institutional volume. Fewer, but more significant nodes.
Low (1.3-1.7): More sensitive, identifying smaller but still relevant institutional interest.
Node Clustering Distance (0.2-0.8 ATR, Default: 0.4): The ATR-based distance for merging nearby nodes.
High (0.6-0.8): Creates wider, more consolidated zones of liquidity.
Low (0.2-0.3): Creates more numerous, precise, and distinct levels.
Pillar III: Cyclical Resonance Matrix
Cycle Resonance Analysis (30-100, Default: 50): The lookback for determining cycle energy and dominance.
Short (30-40): Tunes the engine to faster, shorter-term market rhythms. Best for scalping.
Long (70-100): Aligns the timing component with the larger primary trend. Best for swing trading.
Institutional Signal Architecture
Signal Quality Mode (Professional, Elite, Supreme): Controls the strictness of the three-pillar confluence.
Professional: Loosest setting. May generate signals if two of the three pillars are in strong alignment. Increases signal frequency.
Elite: Balanced setting. Requires a clear, unambiguous resonance of all three pillars. The recommended default.
Supreme: Most stringent. Requires perfect alignment of all three pillars, with each pillar exhibiting exceptionally strong readings (e.g., coherence > 85%). The highest conviction signals.
Signal Spacing Control (5-25, Default: 10): The minimum bars between signals to prevent clutter and redundant alerts.
🎨 ADVANCED VISUAL SYSTEM
The visual architecture of Aetherium is designed not merely for aesthetics, but to provide an intuitive, at-a-glance understanding of the complex data being processed.
Harmonic Liquidity Nodes: The core visual element. Displayed as multi-layered, semi-transparent horizontal boxes.
Magnitude Visualization: The height and opacity of a node's "glow" are proportional to its volume magnitude. More significant nodes appear brighter and larger, instantly drawing the eye to key levels.
Color Coding: Standard nodes are blue/purple, while exceptionally high-magnitude nodes are highlighted in an accent color to denote critical importance.
🌌 Quantum Resonance Field: A dynamic background gradient that visualizes the overall market environment.
Color: Shifts from cool blues/purples (low coherence) to energetic greens/cyans (high coherence and organization), providing instant context.
Intensity: The brightness and opacity of the field are influenced by total market energy (a composite of coherence, momentum, and volume), making powerful market states visually apparent.
💎 Crystalline Lattice Matrix: A geometric web of lines projected from a central moving average.
Mathematical Basis: Levels are projected using multiples of the Golden Ratio (Phi ≈ 1.618) and the ATR. This visualizes the natural harmonic and fractal structure of the market. It is not arbitrary but is based on mathematical principles of market geometry.
🧠 Synaptic Flow Network: A dynamic particle system visualizing the engine's "thought process."
Node Density & Activation: The number of particles and their brightness/color are tied directly to the Market Coherence score. In high-coherence states, the network becomes a dense, bright, and organized web. In chaotic states, it becomes sparse and dim.
⚡ Institutional Energy Waves: Flowing sine waves that visualize market volatility and rhythm.
Amplitude & Speed: The height and speed of the waves are directly influenced by the ATR and volume, providing a feel for market energy.
📊 INSTITUTIONAL CONTROL MATRIX (DASHBOARD)
The dashboard is the central command console, providing a real-time, quantitative summary of each pillar's status.
Header: Displays the script title and version.
Coherence Engine Section:
State: Displays a qualitative assessment of market organization: ◉ PHASE LOCK (High Coherence), ◎ ORGANIZING (Moderate Coherence), or ○ CHAOTIC (Low Coherence). Color-coded for immediate recognition.
Power: Shows the precise Coherence percentage and a directional arrow (↗ or ↘) indicating if organization is increasing or decreasing.
Liquidity Matrix Section:
Nodes: Displays the total number of active Harmonic Liquidity Nodes currently being tracked.
Target: Shows the price level of the nearest significant Harmonic Node to the current price, representing the most immediate institutional level of interest.
Cycle Matrix Section:
Cycle: Identifies the currently dominant market cycle (e.g., "MID ") based on cycle energy.
Sync: Indicates the alignment of the cyclical forces: ▲ BULLISH , ▼ BEARISH , or ◆ DIVERGENT . This is the core timing confirmation.
Signal Status Section:
A unified status bar that provides the final verdict of the engine. It will display "QUANTUM SCAN" during neutral periods, or announce the tier and direction of an active signal (e.g., "◉ TIER 1 BUY ◉" ), highlighted with the appropriate color.
🎯 SIGNAL GENERATION LOGIC
Aetherium's signal logic is built on the principle of strict, non-negotiable confluence.
Condition 1: Context (Coherence Filter): The Market Coherence must be above the Coherence Activation Level. No signals can be generated in a chaotic market.
Condition 2: Location (Liquidity Node Interaction): Price must be actively interacting with a significant Harmonic Liquidity Node.
For a Buy Signal: Price must be rejecting the Node from below (testing it as support).
For a Sell Signal: Price must be rejecting the Node from above (testing it as resistance).
Condition 3: Timing (Cycle Alignment): The Cyclical Resonance Matrix must confirm that the dominant cycles are synchronized with the intended trade direction.
Signal Tiering: The Signal Quality Mode input determines how strictly these three conditions must be met. 'Supreme' mode, for example, might require not only that the conditions are met, but that the Market Coherence is exceptionally high and the interaction with the Node is accompanied by a significant volume spike.
Signal Spacing: A final filter ensures that signals are spaced by a minimum number of bars, preventing over-alerting in a single move.
🚀 ADVANCED TRADING STRATEGIES
The Primary Confluence Strategy: The intended use of the system. Wait for a Tier 1 (Elite/Supreme) or Tier 2 (Professional/Elite) signal to appear on the chart. This represents the alignment of all three pillars. Enter after the signal bar closes, with a stop-loss placed logically on the other side of the Harmonic Node that triggered the signal.
The Coherence Context Strategy: Use the Coherence Engine as a standalone market filter. When Coherence is high (>70%), favor trend-following strategies. When Coherence is low (<50%), avoid new directional trades or favor range-bound strategies. A sharp drop in Coherence during a trend can be an early warning of a trend's exhaustion.
Node-to-Node Trading: In a high-coherence environment, use the Harmonic Liquidity Nodes as both entry points and profit targets. For example, after a BUY signal is generated at one Node, the next Node above it becomes a logical first profit target.
⚖️ RESPONSIBLE USAGE AND LIMITATIONS
Decision Support, Not a Crystal Ball: Aetherium is an advanced decision-support tool. It is designed to identify high-probability conditions based on a model of institutional behavior. It does not predict the future.
Risk Management is Paramount: No indicator can replace a sound risk management plan. Always use appropriate position sizing and stop-losses. The signals provided are probabilistic, not certainties.
Past Performance Disclaimer: The market models used in this script are based on historical data. While robust, there is no guarantee that these patterns will persist in the future. Market conditions can and do change.
Not a "Set and Forget" System: The indicator performs best when its user understands the concepts behind the three pillars. Use the dashboard and visual cues to build a comprehensive view of the market before acting on a signal.
Backtesting is Essential: Before applying this tool to live trading, it is crucial to backtest and forward-test it on your preferred instruments and timeframes to understand its unique behavior and characteristics.
🔮 CONCLUSION
The Aetherium Institutional Market Resonance Engine represents a paradigm shift from single-variable analysis to a holistic, multi-pillar framework. By quantifying the abstract concepts of market context, location, and timing into a unified, logical system, it provides traders with an unprecedented lens into the mechanics of institutional market operations.
It is not merely an indicator, but a complete analytical engine designed to foster a deeper understanding of market dynamics. By focusing on the core principles of institutional order flow, Aetherium empowers traders to filter out market noise, identify key structural levels, and time their entries in harmony with the market's underlying rhythm.
"In all chaos there is a cosmos, in all disorder a secret order." - Carl Jung
— Dskyz, Trade with insight. Trade with confluence. Trade with Aetherium.

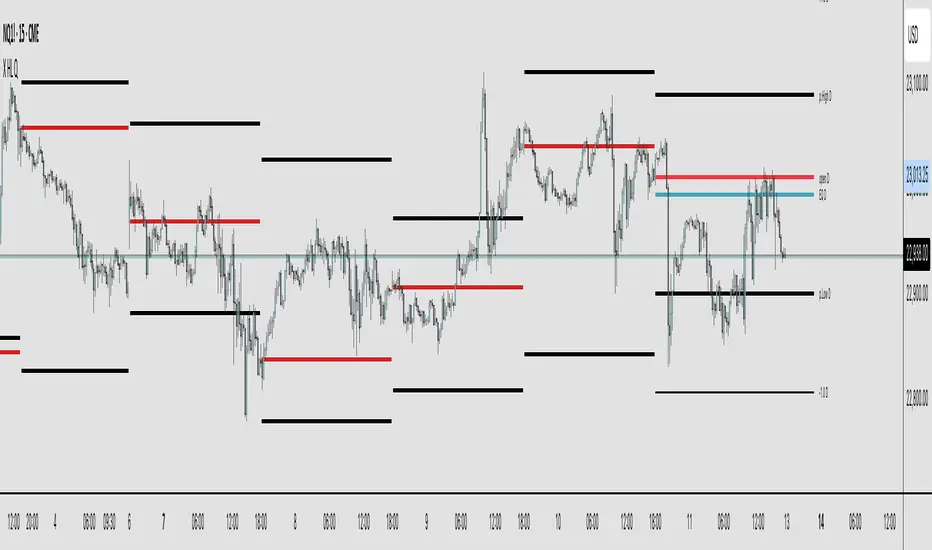
X HL QA market structure tool designed to frame price action within a defined context of prior session dynamics. It accomplishes this by anchoring a set of reference levels to the high, low, and open prices of a user-specified higher timeframe (e.g., 4H, 1D, etc.) and projecting those levels onto the current chart for ongoing analysis.
At its core, the indicator establishes a reference range—derived from the previous completed instance of the selected timeframe—and overlays this on the current timeframe. This range serves as a foundational structure for price interpretation in the current session.
Building upon this framework, the script constructs a set of symmetrical quadrants (or deviation zones) both inside and outside of the prior range. These include:
The midpoint (EQ) of the prior range
Levels at ±0.25x, ±0.75x, ±1.0x, ±1.5x, and ±2.0x the range height
These levels act as contextual zones that traders can use to interpret price behavior—whether it's consolidating within the prior range, approaching fair value (EQ), or expanding into directional continuation or reversal zones beyond the range.
The script operates in both real-time and historical contexts. On live bars, it dynamically updates the key levels to provide an evolving view of current price positioning. Simultaneously, it supports the display of historical levels for past sessions, enabling robust backtesting and comparative analysis of price behavior relative to previous quadrant structures.
Ultimately, this tool serves as a positional map, helping traders assess where price is trading relative to significant levels from the prior session, offering insights into potential support/resistance, overextension, or mean reversion scenarios.
Key Technical Features
Multi-Timeframe Support:
request.security() is used to pull data from a user-defined higher timeframe regardless of the current chart interval.
Visual Flexibility:
Toggle between "line" and "channel" mode.
Line color, width, and visibility are all user-controlled.
Anchoring Options:
Deviation levels can be calculated from either the previous period's open or its EQ (midpoint), giving flexibility depending on analytical preference.
Efficient Labeling:
Labels are only rendered on the last bar and are automatically cleared and redrawn to prevent duplication.
Label style, size, text color, and background color are all user-configurable.
Trading Application
This indicator is especially suited for:
1. Mean Reversion Strategies
When price moves beyond +1.0 or +1.5 deviations from the EQ or open, it may signal overextension and a potential snap back to the midpoint or range.
2. Breakout Confirmation
Sustained price action beyond ±1.0 levels may indicate trend strength or continuation beyond historical balance zones.
3. Contextual Range Awareness
EQ and Open provide structure from which traders can judge whether price is in a state of balance or imbalance.
Labels offer at-a-glance interpretation of key levels across any chosen timeframe.
4. Fractal and Multi-Session Analysis
Analysts can layer daily, weekly, and monthly versions of this indicator to observe confluence or divergence of higher timeframe structure.
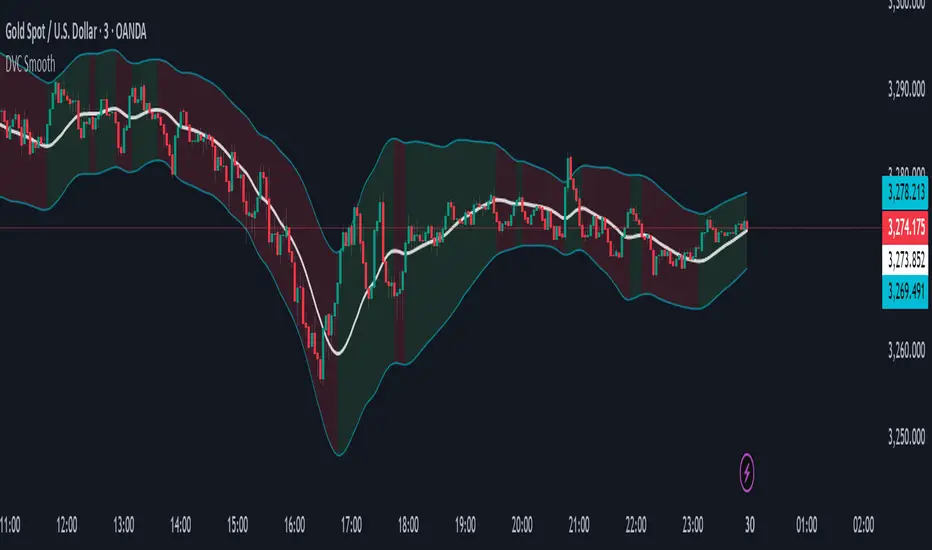
Dynamic Volatility Channel (DVC) - Smooth
The indicator's adaptability comes from a unique blend of well-known concepts:
The Adaptive Engine (ADX): The indicator uses the Average Directional Index (ADX) in the background to analyze the strength of the trend. This acts as the "brain", telling the channel whether the market is trending strongly or moving sideways.
Hybrid Volatility: This is the core of the indicator. The width of the channel is determined by a weighted mix of two volatility measures:
In trending markets (high ADX), the channel gives more weight to the Average True Range (ATR).
In ranging markets (low ADX), the channel gives more weight to Standard Deviation.
Smooth Centerline (HMA): The channel is centered around a Hull Moving Average (HMA), which is known for its smoothness and reduced lag compared to other moving averages.
Advanced Smoothing Layers: This version includes dedicated smoothing for both the volatility components (ATR and StDev) and the logic that switches between regimes. This ensures the channel expands, contracts, and adapts in a very fluid manner, eliminating sudden jumps and reducing market noise.
Mean Reversion: In ranging markets (indicated by a flatter channel), the outer bands can act as dynamic support and resistance levels. Look for opportunities to sell near the upper band and buy near the lower band, always waiting for price action confirmation like reversal candles.
Trend Following: In strong trends (indicated by a steeply sloped channel), the centerline (HMA) often serves as a dynamic level of support (in an uptrend) or resistance (in a downtrend). Pullbacks to the centerline can present opportunities to join the trend. A "band ride," where price action consistently pushes against the upper or lower band, signals a very strong trend.
Volatility Analysis: A "squeeze," where the bands come very close together, indicates low volatility and can foreshadow a significant price breakout. A sudden expansion of the bands signals an increase in volatility and the potential start of a new, powerful move.
All core parameters are fully customizable to suit your trading style and preferred assets:
You can adjust the lengths for the HMA, ATR, StDev, and the ADX filter.
You can change the multipliers for the ATR and Standard Deviation components.
Crucially, you can control the Volatility Smoothing Length and Logic Smoothing Length to find the perfect balance between responsiveness and smoothness.
Disclaimer: This indicator is provided for educational and analytical purposes only. It is not financial advice, and past performance is not indicative of future results. Always conduct your own research and backtesting before risking capital in a live market.
Volatility & Momentum Nexus (VMN)Volatility & Momentum Nexus (VMN)
This indicator was designed to solve a common trader's problem: chart clutter from dozens of indicators that often contradict each other. The Volatility & Momentum Nexus ( VMN ) is not just another indicator; it's a complete analysis system that synthesizes four essential market pillars into a single, clean, and intuitive visual signal.
The goal of VMN is to identify high-probability moments where a period of accumulation (low volatility) is about to erupt into an explosive move, confirmed by trend, momentum, and volume.
VMN analyzes the real-time confluence of four critical elements:
The Trend (The Main Filter): A 100-period Exponential Moving Average (EMA) sets the overall context. The indicator will only look for buy signals above this line (in an uptrend) and sell signals below it (in a downtrend). The line's color changes for quick visualization.
Volatility (Energy Accumulation): Using Bollinger Bands Width (BBW), the indicator identifies "Squeeze" periods—when the price contracts and builds up energy. These zones are marked with a yellow background on the chart, signaling that a major move is imminent.
Momentum (The Trigger): An RSI (Relative Strength Index) acts as the trigger. A signal is only validated if momentum confirms the direction of the breakout (e.g., RSI > 55 for a buy), ensuring we enter the market with force.
Volume (The Final Confirmation): No breakout move is credible without volume. VMN checks if the volume at the time of the signal is significantly higher than its recent average, adding a vital layer of confirmation.
Green Arrow (Buy Signal): Appears ONLY when ALL the following conditions are met simultaneously:
Price is above the 100 EMA (Bullish Trend).
The chart is exiting a Squeeze zone (yellow background on the previous bar).
Price breaks above the upper Bollinger Band.
RSI is above the buy threshold (default 55).
Volume is above average.
Red Arrow (Sell Signal): Appears ONLY when all the opposite conditions are met.
Do not treat signals as blind commands to trade. They are high-probability confirmations.
Look for signals near key Support/Resistance levels for an even higher success rate.
Always set a Stop Loss (e.g., below the low of the signal candle or below the lower Bollinger Band for a buy).
All parameters (EMA, RSI, Bollinger Bands lengths, thresholds, etc.) can be customized from the settings menu to adapt the indicator to any financial asset or timeframe.
Disclaimer: This indicator is a tool for educational and analytical purposes. It does not constitute and should not be interpreted as financial advice. Trading involves significant risk. Always perform your own analysis and backtesting before risking real capital.

KST Strategy [Skyrexio]Overview
KST Strategy leverages Know Sure Thing (KST) indicator in conjunction with the Williams Alligator and Moving average to obtain the high probability setups. KST is used for for having the high probability to enter in the direction of a current trend when momentum is rising, Alligator is used as a short term trend filter, while Moving average approximates the long term trend and allows trades only in its direction. Also strategy has the additional optional filter on Choppiness Index which does not allow trades if market is choppy, above the user-specified threshold. Strategy has the user specified take profit and stop-loss numbers, but multiplied by Average True Range (ATR) value on the moment when trade is open. The strategy opens only long trades.
Unique Features
ATR based stop-loss and take profit. Instead of fixed take profit and stop-loss percentage strategy utilizes user chosen numbers multiplied by ATR for its calculation.
Configurable Trading Periods. Users can tailor the strategy to specific market windows, adapting to different market conditions.
Optional Choppiness Index filter. Strategy allows to choose if it will use the filter trades with Choppiness Index and set up its threshold.
Methodology
The strategy opens long trade when the following price met the conditions:
Close price is above the Alligator's jaw line
Close price is above the filtering Moving average
KST line of Know Sure Thing indicator shall cross over its signal line (details in justification of methodology)
If the Choppiness Index filter is enabled its value shall be less than user defined threshold
When the long trade is executed algorithm defines the stop-loss level as the low minus user defined number, multiplied by ATR at the trade open candle. Also it defines take profit with close price plus user defined number, multiplied by ATR at the trade open candle. While trade is in progress, if high price on any candle above the calculated take profit level or low price is below the calculated stop loss level, trade is closed.
Strategy settings
In the inputs window user can setup the following strategy settings:
ATR Stop Loss (by default = 1.5, number of ATRs to calculate stop-loss level)
ATR Take Profit (by default = 3.5, number of ATRs to calculate take profit level)
Filter MA Type (by default = Least Squares MA, type of moving average which is used for filter MA)
Filter MA Length (by default = 200, length for filter MA calculation)
Enable Choppiness Index Filter (by default = true, setting to choose the optional filtering using Choppiness index)
Choppiness Index Threshold (by default = 50, Choppiness Index threshold, its value shall be below it to allow trades execution)
Choppiness Index Length (by default = 14, length used in Choppiness index calculation)
KST ROC Length #1 (by default = 10, value used in KST indicator calculation, more information in Justification of Methodology)
KST ROC Length #2 (by default = 15, value used in KST indicator calculation, more information in Justification of Methodology)
KST ROC Length #3 (by default = 20, value used in KST indicator calculation, more information in Justification of Methodology)
KST ROC Length #4 (by default = 30, value used in KST indicator calculation, more information in Justification of Methodology)
KST SMA Length #1 (by default = 10, value used in KST indicator calculation, more information in Justification of Methodology)
KST SMA Length #2 (by default = 10, value used in KST indicator calculation, more information in Justification of Methodology)
KST SMA Length #3 (by default = 10, value used in KST indicator calculation, more information in Justification of Methodology)
KST SMA Length #4 (by default = 15, value used in KST indicator calculation, more information in Justification of Methodology)
KST Signal Line Length (by default = 10, value used in KST indicator calculation, more information in Justification of Methodology)
User can choose the optimal parameters during backtesting on certain price chart.
Justification of Methodology
Before understanding why this particular combination of indicator has been chosen let's briefly explain what is KST, Williams Alligator, Moving Average, ATR and Choppiness Index.
The KST (Know Sure Thing) is a momentum oscillator developed by Martin Pring. It combines multiple Rate of Change (ROC) values, smoothed over different timeframes, to identify trend direction and momentum strength. First of all, what is ROC? ROC (Rate of Change) is a momentum indicator that measures the percentage change in price between the current price and the price a set number of periods ago.
ROC = 100 * (Current Price - Price N Periods Ago) / Price N Periods Ago
In our case N is the KST ROC Length inputs from settings, here we will calculate 4 different ROCs to obtain KST value:
KST = ROC1_smooth × 1 + ROC2_smooth × 2 + ROC3_smooth × 3 + ROC4_smooth × 4
ROC1 = ROC(close, KST ROC Length #1), smoothed by KST SMA Length #1,
ROC2 = ROC(close, KST ROC Length #2), smoothed by KST SMA Length #2,
ROC3 = ROC(close, KST ROC Length #3), smoothed by KST SMA Length #3,
ROC4 = ROC(close, KST ROC Length #4), smoothed by KST SMA Length #4
Also for this indicator the signal line is calculated:
Signal = SMA(KST, KST Signal Line Length)
When the KST line rises, it indicates increasing momentum and suggests that an upward trend may be developing. Conversely, when the KST line declines, it reflects weakening momentum and a potential downward trend. A crossover of the KST line above its signal line is considered a buy signal, while a crossover below the signal line is viewed as a sell signal. If the KST stays above zero, it indicates overall bullish momentum; if it remains below zero, it points to bearish momentum. The KST indicator smooths momentum across multiple timeframes, helping to reduce noise and provide clearer signals for medium- to long-term trends.
Next, let’s discuss the short-term trend filter, which combines the Williams Alligator and Williams Fractals. Williams Alligator
Developed by Bill Williams, the Alligator is a technical indicator that identifies trends and potential market reversals. It consists of three smoothed moving averages:
Jaw (Blue Line): The slowest of the three, based on a 13-period smoothed moving average shifted 8 bars ahead.
Teeth (Red Line): The medium-speed line, derived from an 8-period smoothed moving average shifted 5 bars forward.
Lips (Green Line): The fastest line, calculated using a 5-period smoothed moving average shifted 3 bars forward.
When the lines diverge and align in order, the "Alligator" is "awake," signaling a strong trend. When the lines overlap or intertwine, the "Alligator" is "asleep," indicating a range-bound or sideways market. This indicator helps traders determine when to enter or avoid trades.
The next indicator is Moving Average. It has a lot of different types which can be chosen to filter trades and the Least Squares MA is used by default settings. Let's briefly explain what is it.
The Least Squares Moving Average (LSMA) — also known as Linear Regression Moving Average — is a trend-following indicator that uses the least squares method to fit a straight line to the price data over a given period, then plots the value of that line at the most recent point. It draws the best-fitting straight line through the past N prices (using linear regression), and then takes the endpoint of that line as the value of the moving average for that bar. The LSMA aims to reduce lag and highlight the current trend more accurately than traditional moving averages like SMA or EMA.
Key Features:
It reacts faster to price changes than most moving averages.
It is smoother and less noisy than short-term EMAs.
It can be used to identify trend direction, momentum, and potential reversal points.
ATR (Average True Range) is a volatility indicator that measures how much an asset typically moves during a given period. It was introduced by J. Welles Wilder and is widely used to assess market volatility, not direction.
To calculate it first of all we need to get True Range (TR), this is the greatest value among:
High - Low
abs(High - Previous Close)
abs(Low - Previous Close)
ATR = MA(TR, n) , where n is number of periods for moving average, in our case equals 14.
ATR shows how much an asset moves on average per candle/bar. A higher ATR means more volatility; a lower ATR means a calmer market.
The Choppiness Index is a technical indicator that quantifies whether the market is trending or choppy (sideways). It doesn't indicate trend direction — only the strength or weakness of a trend. Higher Choppiness Index usually approximates the sideways market, while its low value tells us that there is a high probability of a trend.
Choppiness Index = 100 × log10(ΣATR(n) / (MaxHigh(n) - MinLow(n))) / log10(n)
where:
ΣATR(n) = sum of the Average True Range over n periods
MaxHigh(n) = highest high over n periods
MinLow(n) = lowest low over n periods
log10 = base-10 logarithm
Now let's understand how these indicators work in conjunction and why they were chosen for this strategy. KST indicator approximates current momentum, when it is rising and KST line crosses over the signal line there is high probability that short term trend is reversing to the upside and strategy allows to take part in this potential move. Alligator's jaw (blue) line is used as an approximation of a short term trend, taking trades only above it we want to avoid trading against trend to increase probability that long trade is going to be winning.
Almost the same for Moving Average, but it approximates the long term trend, this is just the additional filter. If we trade in the direction of the long term trend we increase probability that higher risk to reward trade will hit the take profit. Choppiness index is the optional filter, but if it turned on it is used for approximating if now market is in sideways or in trend. On the range bounded market the potential moves are restricted. We want to decrease probability opening trades in such condition avoiding trades if this index is above threshold value.
When trade is open script sets the stop loss and take profit targets. ATR approximates the current volatility, so we can make a decision when to exit a trade based on current market condition, it can increase the probability that strategy will avoid the excessive stop loss hits, but anyway user can setup how many ATRs to use as a stop loss and take profit target. As was said in the Methodology stop loss level is obtained by subtracting number of ATRs from trade opening candle low, while take profit by adding to this candle's close.
Backtest Results
Operating window: Date range of backtests is 2023.01.01 - 2025.05.01. It is chosen to let the strategy to close all opened positions.
Commission and Slippage: Includes a standard Binance commission of 0.1% and accounts for possible slippage over 5 ticks.
Initial capital: 10000 USDT
Percent of capital used in every trade: 60%
Maximum Single Position Loss: -5.53%
Maximum Single Profit: +8.35%
Net Profit: +5175.20 USDT (+51.75%)
Total Trades: 120 (56.67% win rate)
Profit Factor: 1.747
Maximum Accumulated Loss: 1039.89 USDT (-9.1%)
Average Profit per Trade: 43.13 USDT (+0.6%)
Average Trade Duration: 27 hours
These results are obtained with realistic parameters representing trading conditions observed at major exchanges such as Binance and with realistic trading portfolio usage parameters.
How to Use
Add the script to favorites for easy access.
Apply to the desired timeframe and chart (optimal performance observed on 1h BTC/USDT).
Configure settings using the dropdown choice list in the built-in menu.
Set up alerts to automate strategy positions through web hook with the text: {{strategy.order.alert_message}}
Disclaimer:
Educational and informational tool reflecting Skyrexio commitment to informed trading. Past performance does not guarantee future results. Test strategies in a simulated environment before live implementation.

Ticker Pulse Meter + Fear EKG StrategyDescription
The Ticker Pulse Meter + Fear EKG Strategy is a technical analysis tool designed to identify potential entry and exit points for long positions based on price action relative to historical ranges. It combines two proprietary indicators: the Ticker Pulse Meter (TPM), which measures price positioning within short- and long-term ranges, and the Fear EKG, a VIX-inspired oscillator that detects extreme market conditions. The strategy is non-repainting, ensuring signals are generated only on confirmed bars to avoid false positives. Visual enhancements, such as optional moving averages and Bollinger Bands, provide additional context but are not core to the strategy's logic. This script is suitable for traders seeking a systematic approach to capturing momentum and mean-reversion opportunities.
How It Works
The strategy evaluates price action using two key metrics:
Ticker Pulse Meter (TPM): Measures the current price's position within short- and long-term price ranges to identify momentum or overextension.
Fear EKG: Detects extreme selling pressure (akin to "irrational selling") by analyzing price behavior relative to historical lows, inspired by volatility-based oscillators.
Entry signals are generated when specific conditions align, indicating potential buying opportunities. Exits are triggered based on predefined thresholds or partial position closures to manage risk. The strategy supports customizable lookback periods, thresholds, and exit percentages, allowing flexibility across different markets and timeframes. Visual cues, such as entry/exit dots and a position table, enhance usability, while optional overlays like moving averages and Bollinger Bands provide additional chart context.
Calculation Overview
Price Range Calculations:
Short-Term Range: Uses the lowest low (min_price_short) and highest high (max_price_short) over a user-defined short lookback period (lookback_short, default 50 bars).
Long-Term Range: Uses the lowest low (min_price_long) and highest high (max_price_long) over a user-defined long lookback period (lookback_long, default 200 bars).
Percentage Metrics:
pct_above_short: Percentage of the current close above the short-term range.
pct_above_long: Percentage of the current close above the long-term range.
Combined metrics (pct_above_long_above_short, pct_below_long_below_short) normalize price action for signal generation.
Signal Generation:
Long Entry (TPM): Triggered when pct_above_long_above_short crosses above a user-defined threshold (entryThresholdhigh, default 20) and pct_below_long_below_short is below a low threshold (entryThresholdlow, default 40).
Long Entry (Fear EKG): Triggered when pct_below_long_below_short crosses under an extreme threshold (orangeEntryThreshold, default 95), indicating potential oversold conditions.
Long Exit: Triggered when pct_above_long_above_short crosses under a profit-taking level (profitTake, default 95). Partial exits are supported via a user-defined percentage (exitAmt, default 50%).
Non-Repainting Logic: Signals are calculated using data from the previous bar ( ) and only plotted on confirmed bars (barstate.isconfirmed), ensuring reliability.
Visual Enhancements:
Optional moving averages (SMA, EMA, WMA, VWMA, or SMMA) and Bollinger Bands can be enabled for trend context.
A position table displays real-time metrics, including open positions, Fear EKG, and Ticker Pulse values.
Background highlights mark periods of high selling pressure.
Entry Rules
Long Entry:
TPM Signal: Occurs when the price shows strength relative to both short- and long-term ranges, as defined by pct_above_long_above_short crossing above entryThresholdhigh and pct_below_long_below_short below entryThresholdlow.
Fear EKG Signal: Triggered by extreme selling pressure, when pct_below_long_below_short crosses under orangeEntryThreshold. This signal is optional and can be toggled via enable_yellow_signals.
Entries are executed only on confirmed bars to prevent repainting.
Exit Rules
Long Exit: Triggered when pct_above_long_above_short crosses under profitTake.
Partial exits are supported, with the strategy closing a user-defined percentage of the position (exitAmt) up to four times per position (exit_count limit).
Exits can be disabled or adjusted via enable_short_signal and exitPercentage settings.
Inputs
Backtest Start Date: Defines the start of the backtesting period (default: Jan 1, 2017).
Lookback Periods: Short (lookback_short, default 50) and long (lookback_long, default 200) periods for range calculations.
Resolution: Timeframe for price data (default: Daily).
Entry/Exit Thresholds:
entryThresholdhigh (default 20): Threshold for TPM entry.
entryThresholdlow (default 40): Secondary condition for TPM entry.
orangeEntryThreshold (default 95): Threshold for Fear EKG entry.
profitTake (default 95): Exit threshold.
exitAmt (default 50%): Percentage of position to exit.
Visual Options: Toggle for moving averages and Bollinger Bands, with customizable types and lengths.
Notes
The strategy is designed to work across various timeframes and assets, with data sourced from user-selected resolutions (i_res).
Alerts are included for long entry and exit signals, facilitating integration with TradingView's alert system.
The script avoids repainting by using confirmed bar data and shifted calculations ( ).
Visual elements (e.g., SMA, Bollinger Bands) are inspired by standard Pine Script practices and are optional, not integral to the core logic.
Usage
Apply the script to a chart, adjust input settings to suit your trading style, and use the visual cues (entry/exit dots, position table) to monitor signals. Enable alerts for real-time notifications.
Designed to work best on Daily timeframe.

LANZ Strategy 1.0 [Backtest]🔷 LANZ Strategy 1.0 — Time-Based Session Trading with Smart Reversal Logic and Risk-Controlled Limit Orders
This backtest version of LANZ Strategy 1.0 brings precision to session-based trading by using directional confirmation, pre-defined risk parameters, and limit orders that execute overnight. Designed for the 1-hour timeframe, it allows traders to evaluate the system with configurable SL, TP, and risk settings in a fully automated environment.
🧠 Core Strategy Logic:
1. Directional Confirmation at 18:00 NY:
At 18:00 NY, the system compares the 08:00 open vs the 18:00 close:
If the direction matches the previous day, the signal is reversed.
If the direction differs, the current day's trend is kept.
This logic is designed to avoid momentum exhaustion and capture corrective reversals.
2. Entry Level Definition:
Based on the confirmed direction:
For BUY, the Low of the day is used as Entry Point (EP).
For SELL, the High of the day becomes EP.
The system plots a Stop Loss and Take Profit based on user-defined pip inputs (default: SL = 18 pips, TP = 54 pips → RR 1:3).
3. Time-Limited Entry Execution (LIMIT Orders):
Orders are sent after 18:00 NY and can be triggered anytime between 18:00 and 08:00 NY.
If EP is not touched before 08:00, the order is automatically cancelled.
4. Manual Close Feature:
If the trade is still open at the configured hour (default 09:00 NY), the system closes all positions, simulating realistic intraday exit scenarios.
5. Lot Size Calculation Based on Risk:
Lot size is dynamically calculated using the account size, risk percentage, and SL distance.
This ensures consistent risk exposure regardless of market volatility.
⚙️ Step-by-Step Flow:
08:00 NY → Captures the open of the day.
18:00 NY → Confirms direction and defines EP, SL, and TP.
After 18:00 NY → If conditions are met, a LIMIT order is placed at EP.
Between 18:00–08:00 NY → If price touches EP, the trade is executed.
At 08:00 NY → If EP wasn’t touched, the order is cancelled.
At Configured Manual Close Time (default 09:00 NY) → All open positions are force-closed if still active.
🧪 Backtest Settings:
Timeframe: 1-hour only
Order Type: strategy.entry() with limit=
SL/TP Configurable: Yes, in pips
Risk Input: % of capital per trade
Manual Close Time: Fully adjustable (default 09:00 NY)
👨💻 Credits:
Developed by LANZ
Strategy logic and trading concept built with clarity and precision.
Code structure and documentation by Kairos, your AI trading assistant.
Designed for high-confidence execution and clean backtesting performance.

Quantum Reversal# 🧠 Quantum Reversal
## **Quantitative Mean Reversion Framework**
This algorithmic trading system employs **statistical mean reversion theory** combined with **adaptive volatility modeling** to capitalize on Bitcoin's inherent price oscillations around its statistical mean. The strategy integrates multiple technical indicators through a **multi-layered signal processing architecture**.
---
## ⚡ **Core Technical Architecture**
### 📊 **Statistical Foundation**
- **Bollinger Band Mean Reversion Model**: Utilizes 20-period moving average with 2.2 standard deviation bands for volatility-adjusted entry signals
- **Adaptive Volatility Threshold**: Dynamic standard deviation multiplier accounts for Bitcoin's heteroscedastic volatility patterns
- **Price Action Confluence**: Entry triggered when price breaches lower volatility band, indicating statistical oversold conditions
### 🔬 **Momentum Analysis Layer**
- **RSI Oscillator Integration**: 14-period Relative Strength Index with modified oversold threshold at 45
- **Signal Smoothing Algorithm**: 5-period simple moving average applied to RSI reduces noise and false signals
- **Momentum Divergence Detection**: Captures mean reversion opportunities when momentum indicators show oversold readings
### ⚙️ **Entry Logic Architecture**
```
Entry Condition = (Price ≤ Lower_BB) OR (Smoothed_RSI < 45)
```
- **Dual-Condition Framework**: Either statistical price deviation OR momentum oversold condition triggers entry
- **Boolean Logic Gate**: OR-based entry system increases signal frequency while maintaining statistical validity
- **Position Sizing**: Fixed 10% equity allocation per trade for consistent risk exposure
### 🎯 **Exit Strategy Optimization**
- **Profit-Lock Mechanism**: Positions only closed when showing positive unrealized P&L
- **Trend Continuation Logic**: Allows winning trades to run until momentum exhaustion
- **Dynamic Exit Timing**: No fixed profit targets - exits based on profitability state rather than arbitrary levels
---
## 📈 **Statistical Properties**
### **Risk Management Framework**
- **Long-Only Exposure**: Eliminates short-squeeze risk inherent in cryptocurrency markets
- **Mean Reversion Bias**: Exploits Bitcoin's tendency to revert to statistical mean after extreme moves
- **Position Management**: Single position limit prevents over-leveraging
### **Signal Processing Characteristics**
- **Noise Reduction**: SMA smoothing on RSI eliminates high-frequency oscillations
- **Volatility Adaptation**: Bollinger Bands automatically adjust to changing market volatility
- **Multi-Timeframe Coherence**: Indicators operate on consistent timeframe for signal alignment
---
## 🔧 **Parameter Configuration**
| Technical Parameter | Value | Statistical Significance |
|-------------------|-------|-------------------------|
| Bollinger Period | 20 | Standard statistical lookback for volatility calculation |
| Std Dev Multiplier | 2.2 | Optimized for Bitcoin's volatility distribution (95.4% confidence interval) |
| RSI Period | 14 | Traditional momentum oscillator period |
| RSI Threshold | 45 | Modified oversold level accounting for Bitcoin's momentum characteristics |
| Smoothing Period | 5 | Noise reduction filter for momentum signals |
---
## 📊 **Algorithmic Advantages**
✅ **Statistical Edge**: Exploits documented mean reversion tendency in Bitcoin markets
✅ **Volatility Adaptation**: Dynamic bands adjust to changing market conditions
✅ **Signal Confluence**: Multiple indicator confirmation reduces false positives
✅ **Momentum Integration**: RSI smoothing improves signal quality and timing
✅ **Risk-Controlled Exposure**: Systematic position sizing and long-only bias
---
## 🔬 **Mathematical Foundation**
The strategy leverages **Bollinger Band theory** (developed by John Bollinger) which assumes that prices tend to revert to the mean after extreme deviations. The RSI component adds **momentum confirmation** to the statistical price deviation signal.
**Statistical Basis:**
- Mean reversion follows the principle that extreme price deviations from the moving average are temporary
- The 2.2 standard deviation multiplier captures approximately 97.2% of price movements under normal distribution
- RSI momentum smoothing reduces noise inherent in oscillator calculations
---
## ⚠️ **Risk Considerations**
This algorithm is designed for traders with understanding of **quantitative finance principles** and **cryptocurrency market dynamics**. The strategy assumes mean-reverting behavior which may not persist during trending market phases. Proper risk management and position sizing are essential.
---
## 🎯 **Implementation Notes**
- **Market Regime Awareness**: Most effective in ranging/consolidating markets
- **Volatility Sensitivity**: Performance may vary during extreme volatility events
- **Backtesting Recommended**: Historical performance analysis advised before live implementation
- **Capital Allocation**: 10% per trade sizing assumes diversified portfolio approach
---
**Engineered for quantitative traders seeking systematic mean reversion exposure in Bitcoin markets through statistically-grounded technical analysis.**

LMAsLibrary "LMAs"
Credits
Thank you to @QuantraSystems for dynamic calculations.
Introduction
This lightweight library offers dynamic implementations of popular moving averages that adapt their length automatically as new bars are added to the chart.
Each function is built on a dynamic length formula:
len = math.min(maxLength, bar_index + 1)
This approach ensures that calculations begin as early as the first bar, allowing for smoother initialization and more consistent behavior across all timeframes. It’s especially useful in custom scripts that run from bar 0 or when historical data is limited.
Usage
You can use this library as a drop-in replacement for standard moving averages. It provides more flexibility and stability in live or backtesting environments where fixed-length indicators may delay or fail to initialize properly.
Why Use This?
• Works from the very first bar
• Avoids na values during early bars
• Great for real-time indicators, strategies, and bar-replay
• Clean and efficient code with dynamic behavior
How to Use
Import the library into your script and call any of the included functions just like you would with their native counterparts.
Summary
A lightweight Pine Script™ library offering dynamic moving averages that work seamlessly from the very first bar. Ideal for strategies and indicators requiring robust initialization and adaptive behavior.
SMA(sourceData, maxLength)
Dynamic SMA
Parameters:
sourceData (float)
maxLength (int)
EMA(src, length)
Dynamic EMA
Parameters:
src (float)
length (int)
DEMA(src, length)
Dynamic DEMA
Parameters:
src (float)
length (int)
TEMA(src, length)
Dynamic TEMA
Parameters:
src (float)
length (int)
WMA(src, length)
Dynamic WMA
Parameters:
src (float)
length (int)
HMA(src, length)
Dynamic HMA
Parameters:
src (float)
length (int)
VWMA(src, volsrc, length)
Dynamic VWMA
Parameters:
src (float)
volsrc (float)
length (int)
SMMA(src, length)
Dynamic SMMA
Parameters:
src (float)
length (int)
LSMA(src, length, offset)
Dynamic LSMA
Parameters:
src (float)
length (int)
offset (int)
RMA(src, length)
Dynamic RMA
Parameters:
src (float)
length (int)
ALMA(src, length, offset_sigma, sigma)
Dynamic ALMA
Parameters:
src (float)
length (int)
offset_sigma (float)
sigma (float)
ZLSMA(src, length)
Dynamic ZLSMA
Parameters:
src (float)
length (int)
FRAMA(src, length)
Parameters:
src (float)
length (int)
KAMA(src, length)
Dynamic KAMA
Parameters:
src (float)
length (int)
JMA(src, length, phase)
Dynamic JMA
Parameters:
src (float)
length (int)
phase (float)
T3(src, length, volumeFactor)
Dynamic T3
Parameters:
src (float)
length (int)
volumeFactor (float)

Sessions By petranThis indicator highlights the key trading sessions on the chart: Asian, Frankfurt, London, and New York. It helps traders visually track when each session begins and ends, making it easier to analyze price action, volume, and volatility during specific times of the day.
Key features:
Customizable session start and end times
Up to 4 major sessions highlighted
Best used on intraday timeframes (1-minute to 1-hour)
Clean, minimal design with adjustable colors and transparency
No repainting – reliable for both live trading and backtesting
Ideal for intraday traders and anyone who wants to better understand market dynamics during different trading sessions.
