Z Score BandThis is a band based on Z Score. What is Z Score? In layman's terms it's a method of finding outliers within a sequence of numbers. It's highly effective to quantify pump and dumps in the crypto market.
The middle line is a simple Exponential Moving Average, you can configure this with whatever period you prefer. It comes default with a period of 247 to which I find suitable for my style of trading. The upper and lower bound are determined by the standard deviation you choose in the settings, it comes with a default of 1.69 although I've heard people saying 2.5 is a better number to really pinpoint outliers.
Trading with this indicator is like trading with any band based indicator. The main difference is that this indicator's sole purpose when I wrote it is to help me find shorting positions in the futures market. On the contrary though, longs are also achievable although I rarely long the futures market.
If prices hit the upper bound and get rejected, it's probably because the move was an outlier, it doesn't happen often and when it does usually it reveals crypto's nature of buying spot and hedging short in the futures market. When prices stay above the upper bound, switch to a higher timeframe until we can see that it's still have some ways upwards.
What's true about using this as a shorting tool is also true with longs. However, it might not be as effective, I'd like to be proven wrong.
在脚本中搜索"band"

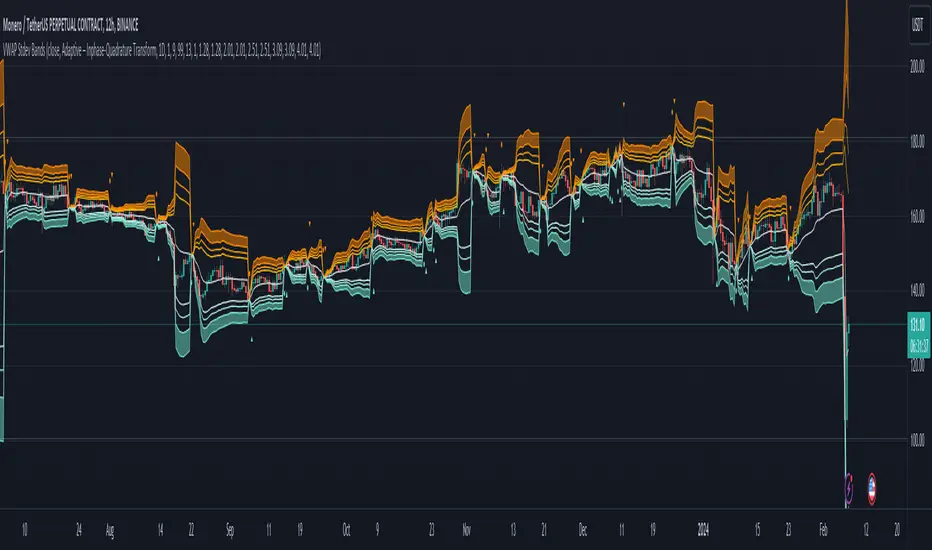
Adaptive VWAP Stdev BandsIntroduction
Heyo, here are some adaptive VWAP Standard Deviation Bands with nice colors.
I used Ehlers dominant cycle theories and ZLSMA smoothing to create this indicator.
You can choose between different algorithms to determine the dominant cycle and this will be used as reset period.
Everytime bar_index can be divided through the dominant cycle length and the result is zero VWAP resets if have chosen an adaptive mode in the settings.
The other reset event you can use is just a simple time-based event, e.g. reset every day.
Usage
I think people buy/sell when it reaches extreme zones.
Enjoy!
---
Credits to:
@SandroTurriate - VWAP Stdev Bands
@blackcat1402 - Dominant Cycle Analysis
@DasanC - Dominant Cycle Analysis
@veryfid - ZLSMA
(Sry, too lazy for linking)
I took parts of their code. Ty guys for your work! Just awesome.
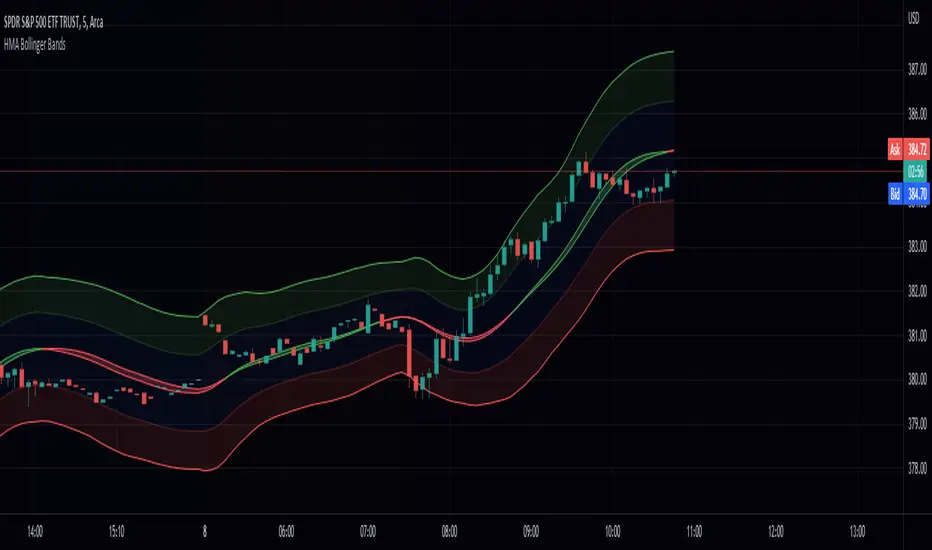
Hull Moving Average Bollinger Bands (HMABB)Hello! This is simply Bollinger Bands calculated with HMA! Heres a recap on both.
The Hull Moving Average (HMA) attempts to minimize the lag of a traditional moving average while retaining the smoothness of the moving average line. Developed by Alan Hull in 2005, this indicator makes use of weighted moving averages to prioritize more recent values and greatly reduce lag.
Bollinger Bands are envelopes plotted at a standard deviation level above and below a simple moving average of the price. Because the distance of the bands is based on standard deviation, they adjust to volatility swings in the underlying price. Bollinger Bands use 2 parameters, Period and Standard Deviations, StdDev.
SPX Fair Value Bands V2An updated version of the SPX Fair Value Bands script from dharmatech and based on the net liquidity concept by MaxJAnderson .
Now with full customization of parameters through the settings (Dialog Box) and allowing the options to the use of
1) Standard Bands based on Offsets of the Fair Value
2) Bollinger Bands
3) Keltner Channels
to better capture buy/sell areas rather than relying on noisy unreliably (and unevenly) updated data from the Treasury/Fed.
==================================
Net Liquidity's importance in the new post-COVID QE to QT regime as described MaxJAnderson
----------------
" In past cycles, size of Fed's balance sheet changed a lot, while TGA and RRP changed relatively little. So size of balance sheet roughly equated Net Liquidity.
(The Treasury General Account) TGA and (Reverse Repo) RRP didn't matter. They were rounding errors by comparison.
But starting in 2020, relative changes in TGA and RRP have been THREE TIMES LARGER than the change in size of the Fed's balance sheet. As result, changes in TGA and RRP have taken over as the primary drivers Net Liquidity.
This is new, and changes the game significantly. Again - the size of the Fed's balance sheet doesn't matter.
What matters is the portion of it that's available to circulate in the economy (Net Liquidity).
And ever since 2020, the Treasury and Reverse Repo have become what controls that. Not the size of Fed's balance sheet.
----------------
The idea that follows is simple,short when $SPX reaches extreme levels of overvaluation, and close out when SPX returns to being undervalued. Here's the formulas I currently use to determine fair value:
Fair Value = (Fed Bal Sheet - TGA - RRP)/1.1 - 1625
And here's the trading rules I currently follow:
Short when diff of $SPX - Fair Value > 350
Close when diff of $SPX - Fair Value < 150
When one of these rules is triggered upon market close on a given day, trades are entered at open of the following day "

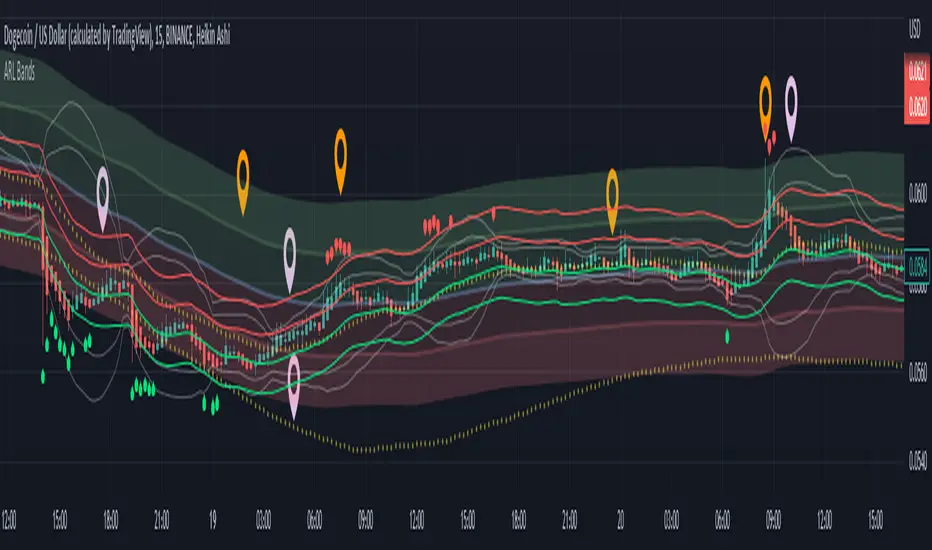
Adaptive Rebound Line Bands (ARL Bands)These bands consist of 4 ARLs (See: Adaptive Rebound Line ('ARL'/AR Line)) that help accurately spot price rebounds.
It is excellent for 15 minute scalping and price-action trading.
See notes in the picture above for more details.
Note: "Top Deviation" is the deviation of the top 'ARL', "High Deviation" is for the high 'ARL', etc.
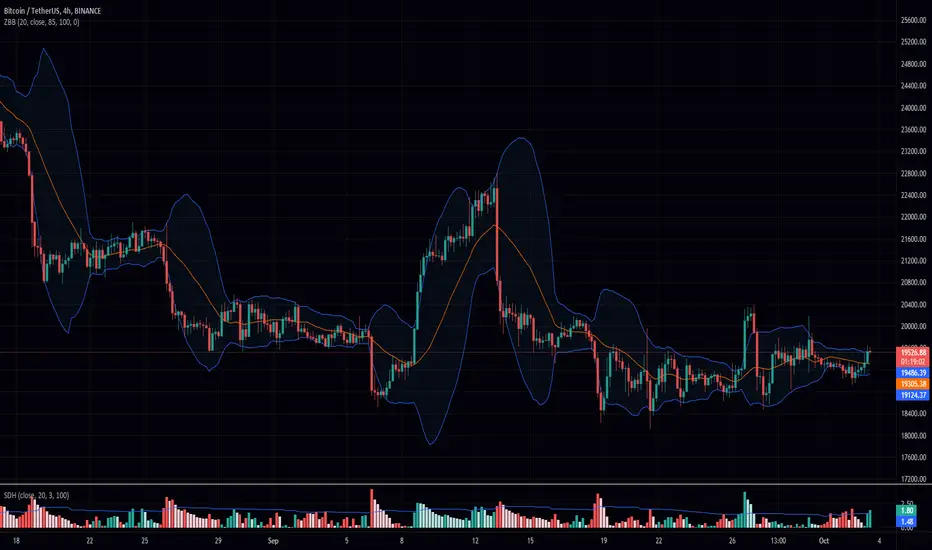
Z Bollinger BandsThis version of Bollinger Bands measures the average volatility. By taking the 75th percentile of the average absolute value of the difference between the Source and the Mean divided by the Standard Deviation and using that as our multiplier for our Bollinger bands we can have a statistically safe trading zone.
You notice that its dynamic, this is because it take into account the real volatility levels of a window and uses that to determine an appropriate multiplier. As always I hope you enjoy this release.
Volume Weighted Reversal BandsThis is a vwap & vwma hybrid with upper & lower deviation bands that provide excellent price channels and reversal areas. It can be used on lower & higher timeframes, just increase the deviation % for higher timeframes. Try out the 1 minute timeframe with .5% deviation for great scalping levels.
Here is the calculation used for the main line.
(VWMA100 + VWMA500 + VWMA1000 + VWAP) / 4
So it combines 3 VWMAs with the VWAP and divides that number by 4 to give us a moving average. Then we add new levels above and below that moving average to get our channels. The channels are separated by the % deviation you choose in the settings. For tighter bands, lower the percentage deviation and for wider bands, increase the percentage deviation.
The fattest line in the middle is the main moving average and you can expect price to regularly return to this level. The thick lines are the main moving average plus or minus the percentage deviation you have set. There are 10 levels in each direction from the main moving average. The is also a thin short term moving average as well with a custom calculation. It takes 4 different length moving averages that are weighted and 4 more that are volume weighted and divides the total by 8.The lines will be green when price is above the line and red when price is below the line. The thin white line is the VWAP on its own.
These lines will act as dynamic support and resistance so you can scalp them back and forth. These levels work so well because they are volume weighted and the algos hedge their positions back and forth constantly.
For best results, use this indicator on tickers with the highest volume and trading action as the price will stick to these levels better when the big money players are hedging. Some great tickers for this indicator are APPL, SPY, BTC, ETH.
All colors and linewidths can be customized in the settings easily as well as turning off the VWAP or short moving average and adjusting the percentage deviation for the channels.
***MARKETS***
This indicator can be used on all markets, including stocks, crypto, futures and forex.
***TIMEFRAMES***
This indicator can be used on all timeframes.
***TIPS***
Try using numerous indicators of ours on your chart for extra confirmation. Our favorites to pair with these bands are the Scalper Ribbon and Trend Friend Signals. The 3 combined give you a lot of extra confirmation on whether the market is going to reverse at these levels.

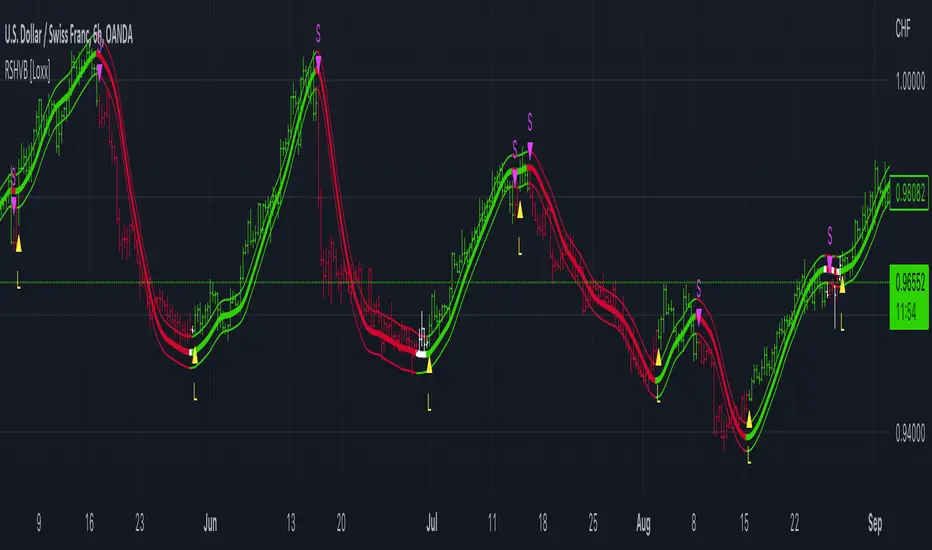
Roger & Satchell Estimator Historical Volatility Bands [Loxx]Roger & Satchell Estimator Historical Volatility Bands are constructed using:
Average as the middle line.
Upper and lower bands using theRoger & Satchell Estimator Historical Volatility Bands for bands calculation.
What is Roger & Satchell Estimator Historical Volatility?
The Rogers–Satchell estimator does not handle opening jumps; therefore, it underestimates the volatility. It accurately explains the volatility portion that can be attributed entirely to a trend in the price evolution. Rogers and Satchell try to embody the frequency of price observations in the model in order to overcome the drawback. They claim that the corrected estimator outperforms the uncorrected one in a study based on simulated data.
RSEHV = sqrt((Z/n) * sum((log(high/close)*log(high/open)) + (log(low/close)*log(low/open))))
The color of the middle line, unlike the bands colors, has 3 colors. When colors of the bands are the same, then the middle line has the same color, otherwise it's white.
Included
Alerts
Signals
Loxx's Expanded Source Types
Bar coloring
Parkinson's Historical Volatility Bands [Loxx]Parkinson's Historical Volatility Bands are constructed using:
Average as the middle line.
Upper and lower bands using the Parkinson's historical volatility (instead of "regular" Historical Volatility) for bands calculation.
What is Parkinson's Historical Volatility?
The Parkinson's number, or High Low Range Volatility developed by the physicist, Michael Parkinson in 1980, aims to estimate the Volatility of returns for a random walk using the High and Low in any particular period. IVolatility.com calculates daily Parkinson values. Prices are observed on a fixed time interval: n = 10, 20, 30, 60, 90, 120, 150, 180 days.
SH is stock's High price in t day.
SL is stock's Low price in t day.
High/Low Return (xt^HL) is calculated as the natural logarithm of the ratio of a stock's High price to stock's Low price.
Return:
And Parkinson's number: 1 / (4 * math.log(2)) * 252 / n * Σ (n, t =1) {math.log(Ht/Lt)^2}
An important use of the Parkinson's number is the assessment of the distribution prices during the day as well as a better understanding of the market dynamics. Comparing the Parkinson's number and periodically sampled volatility helps traders understand the tendency towards mean reversion in the market as well as the distribution of stop-losses.
The color of the middle line, unlike the bands colors, has 3 colors. When colors of the bands are the same, then the middle line has the same color, otherwise it's white.
Included
Alerts
Signals
Loxx's Expanded Source Types
Bar coloring

EMA 50 HIGH LOW BANDHi
This indicator displays a band of EMA 50 having high and low of the same ema.
This script works well on 5 min chart or lower time frames in intraday.
When any price is above this band, you may consider a buy position and whenever any price is below this band, you may consider a sell position.
You may also take help of EMA 200, which is shown in red color. Whenever price is above EMA200, it is considered bullish and when ever it is below EMA 200, it is considered bearish.
This will remove a lot of noise from your chart.
I hope it helps.
Thanks

Bollinger Bands Breakout Oscillator [LuxAlgo]The Bollinger Bands Breakout Oscillator is an oscillator returning two series quantifying the significance of breakouts between the price and the extremities of the Bollinger Bands indicator.
Settings
Length: Period of the Bollinger Bands indicator
Mult: Controls the width of the Bollinger Bands
Src: Input source of the indicator
Usage
Each series is calculated by summing the distance between price and a respective Bollinger Bands extremity in the case price is outside this extremity and divided by the sum of the absolute distance between price and a respective extremity. This sum is done over the most recent Length bars.
Bullish breakouts are represented by the green areas of the indicator, while bearish breakouts are represented by the red areas of the indicator.
The oscillator can determine the presence of an uptrend when the bullish area is superior to the bearish area, while a downtrend is indicated by a bearish area being superior to the bullish one. The significance of the breakout is determined by the amplitude of each area, with higher amplitudes indicating more significant breakouts or strong trends.
Using higher Mult values would naturally return wider bands, which would induce less frequent breakouts, this would be highlighted by the oscillator.
In the chart above we can see the oscillator using a multiplicative factor of 2.

[Mad] Triple Bollinger Bands MTFThese are classic triple Bollinger bands with different multipliers
You can change the time frame plotted,
for example, you can show a 1-hour chart, but plot 6-hour Bollinger.
Since I haven't found any other OpenSource variant that can plot the 3 bands in a different time frame, here is my script for you
en.wikipedia.org
----
additional you can see in this script, how to move data around with arrays instead of multiple variables.
This way you can cut down security calls to a minimum. (look at the transfer- and bollarray)

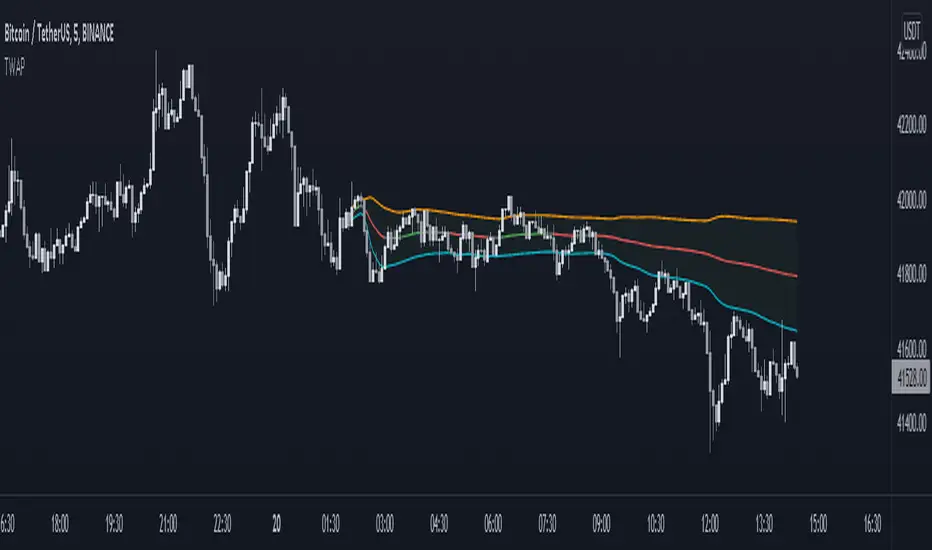
Anchored TWAP with StDev Bands [MrShadow]TWAP with:
- Anchoring: Custom, Day, Week, Month, Quarter, Year (custom anchoring can be selected by dragging a vertical line through the chart)
- Standard Devation Bands
- Auto-coloring depending on the trend
EMA 50/100/200 Trend BandsEMA Trend Bands is a clean and powerful trend-structure tool built around the classic 50/100/200 EMA stack.
It provides an intuitive, color-coded view of market conditions by identifying when the trend is bullish, bearish, or neutral based on EMA alignment.
This indicator is designed for traders who want a simple, objective trend filter without the clutter of extra signals or repainting logic.

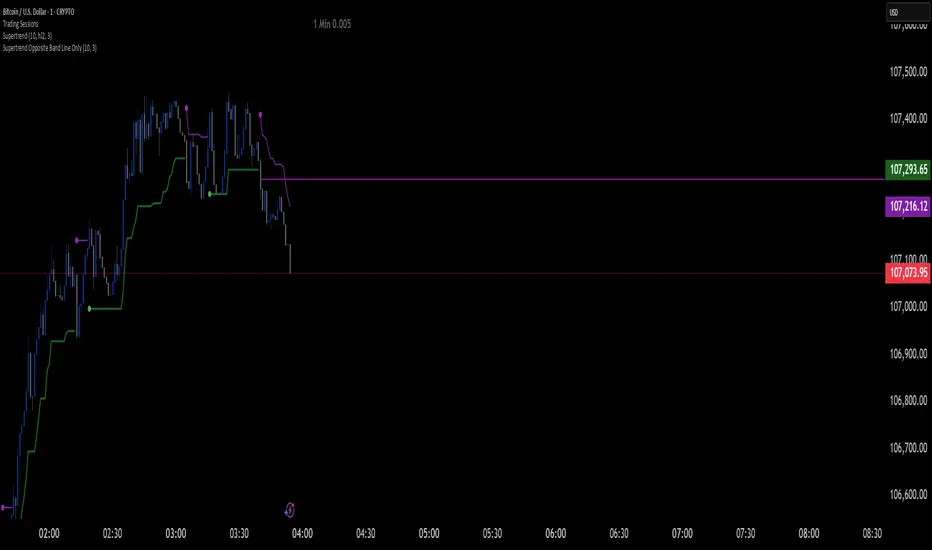
Supertrend Opposite Band Line Onlywhen super trend changes Trend , its important to wait for crossing the Price line of opposite Band so i have written this script . this will help you Traders for sure
Bull Market Support Band Alert (20W SMA & 21W EMA) - Multi-Alert═══════════════════════════════════════════════════════════════════
🎯 WHAT THIS INDICATOR DOES:
═══════════════════════════════════════════════════════════════════
This indicator monitors the Bull Market Support Band (BMSB) - a popular trend-following system that uses the 20-week Simple Moving Average (SMA) and 21-week Exponential Moving Average (EMA) to identify major market trends. It alerts you when price crosses either moving average on any stock in your watchlist.
═══════════════════════════════════════════════════════════════════
📈 THE BULL MARKET SUPPORT BAND STRATEGY:
═══════════════════════════════════════════════════════════════════
- ABOVE both MAs = Bullish trend (consider holding/buying)
- BELOW both MAs = Bearish trend (consider caution/selling)
- CROSSING ABOVE = Potential trend change to bullish
- CROSSING BELOW = Potential trend change to bearish
Originally popularized by cryptocurrency analysts, the BMSB has proven effective across all markets for identifying major trend changes.
═══════════════════════════════════════════════════════════════════
⚡ KEY FEATURES:
═══════════════════════════════════════════════════════════════════
✅ Single alert monitors your ENTIRE watchlist
✅ Works on ANY timeframe (daily, 4H, 1H) while maintaining weekly MA accuracy
✅ Visual signals when crosses occur (green/red arrows)
✅ Real-time status table showing current values
✅ Background coloring for quick trend identification
✅ Customizable alert settings for crosses above/below
═══════════════════════════════════════════════════════════════════
🔔 HOW TO SET UP ALERTS:
═══════════════════════════════════════════════════════════════════
1. Add this indicator to your chart
2. Click Alert (alarm icon)
3. Select "BMSB Watchlist Alert" → "BMSB Cross Alert"
4. Choose your alert frequency:
• "Once Per Bar" = Immediate alerts (for active traders)
• "Once Per Bar Close" = Confirmed signals (fewer false alarms)
5. CHECK "Apply to all symbols in watchlist" ← IMPORTANT!
6. Select your watchlist and create
═══════════════════════════════════════════════════════════════════
⚙️ RECOMMENDED SETTINGS:
═══════════════════════════════════════════════════════════════════
📍 FOR SWING TRADERS:
- Chart: Daily timeframe
- Alert Trigger: Once Per Bar Close
- Both crosses enabled
📍 FOR ACTIVE TRADERS:
- Chart: 4H or Daily timeframe
- Alert Trigger: Once Per Bar
- Both crosses enabled
📍 FOR LONG-TERM INVESTORS:
- Chart: Weekly timeframe
- Alert Trigger: Once Per Bar Close
- Focus on crosses above
═══════════════════════════════════════════════════════════════════
📊 VISUAL ELEMENTS:
═══════════════════════════════════════════════════════════════════
- BLUE LINE = 20-week Simple Moving Average
- RED LINE = 21-week Exponential Moving Average
- GREEN ARROWS = Price crossed above BMSB
- RED ARROWS = Price crossed below BMSB
- GREEN BACKGROUND = Price above both MAs (bullish)
- RED BACKGROUND = Price below both MAs (bearish)
- STATUS TABLE = Current price position and MA values
═══════════════════════════════════════════════════════════════════
💡 PRO TIPS:
═══════════════════════════════════════════════════════════════════
1. The indicator calculates WEEKLY MAs regardless of your chart timeframe
2. Best used with liquid stocks/cryptos with good volume
3. Consider waiting for daily/weekly close for confirmation
4. Crosses are more significant after extended periods above/below
5. Works great with additional confirmation (volume, RSI, etc.)
═══════════════════════════════════════════════════════════════════
⚠️ IMPORTANT NOTES:
═══════════════════════════════════════════════════════════════════
- FREE accounts limited to 1 active alert
- Alerts check based on YOUR selected timeframe, not the weekly MA calculation
- False signals possible during ranging/choppy markets
- Not financial advice - use as one tool among many
═══════════════════════════════════════════════════════════════════
👨💻 AUTHOR'S NOTE:
═══════════════════════════════════════════════════════════════════
Built for traders who want to monitor multiple stocks efficiently without creating dozens of individual alerts. Perfect for identifying major trend changes across your entire portfolio with a single alert.
Tags: #BMSB #BullMarketSupportBand #20WeekSMA #21WeekEMA #TrendFollowing #MovingAverage #WatchlistAlert #MultiTimeframe #SwingTrading #TrendTrading

Harry Dunn Volatility BandsEnter strike price and 2 percentage numbers to automatically calculate and draw volatility bands on chart.

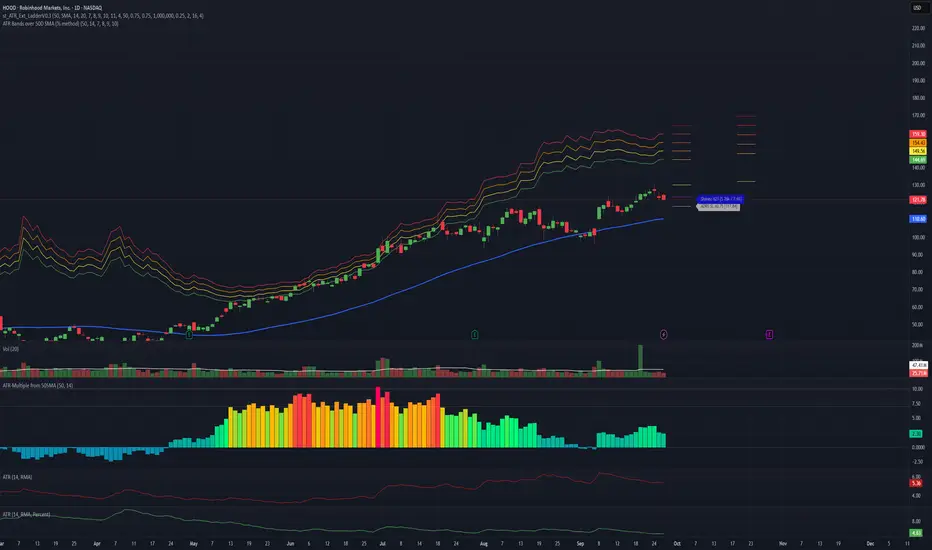
ATR Bands over 50D SMA (% method)Indicator that shows multiples of ATR% above the 50d SMA as bands on a chart, building off of
Jeff Sun 's methodology. You should tinker with the settings to chose your multiples, colors and which multiple lines to show. I don't know if the negative multiple lines have any use, so I turn mine off. Offered as is. I am not a programmer. Note the other indicators shown on the print screen are not mine.
EMA 20–55 + SMMA50 (20↔55 Band, Alerts, Color Controls)This script plots a customizable EMA ribbon and a smoothed moving average (SMMA).
Key features:
EMA 20 (blue) and EMA 55 (yellow) highlighted with a green/red background ribbon depending on trend.
Optional middle EMAs (25, 30, 35, 40, 45, 50) can be shown or hidden.
SMMA (50) plotted in white as a trend smoother.
Customizable line colors, band colors, and transparency.
Alerts for EMA20/EMA55 bullish or bearish crossovers.
Optional candle bar coloring based on trend.
This is useful for quickly spotting medium-term trend shifts when EMA20 crosses EMA55, while still tracking the broader EMA ribbon context.

EMA band 12/60/150/200EMA band consisting of 12/60/150/200
Specifically for Indian stock market, can be used for other trading scripts after testing.
Best use case : on Daily TF.
Bull run entry criteria, Not bear market or Bottom catching.

COG-10 + Deviation BandsClassic Center of Gravity, COG
«Center of Gravity»
COG is a weighted moving average, in which new bars have more weight, and old ones have less.
Formula (Pine equivalent):
COG = – Σ (price × (i+1)) / Σ price
• i = 0 – the most recent bar
• i = length-1 – the oldest bar
The minus sign simply flips the curve so that the extremes coincide with the price reversals.
Bars: | 9 | 8| 7 | 6| 5| 4| 3 | 2 | 1 | 0 |
Weight: |1 | 2 | 3 | 4| 5| 6| 7| 8 | 9| 10|
Where COG is used
Reversal zones
– when the price moves far from the COG, it is considered «overbought/oversold»; return to COG – potential reversal.
Dynamic support/resistance
– in a sideways trend, the price often bounces off the COG.
Trend filter
– if COG grows → uptrend, falls → downtrend.
Strategy pairs
• COG + deviation bands (analogous to Bollinger) is given in lines
• COG + RSI – confirmation of divergences
• COG + volume (weighted by volume) is given in yellow lines
Перевод для русской аудитории
Classic Center of Gravity, COG
«Центр тяжести»
COG – это взвешенное скользящее среднее, в котором новые бары имеют больший вес, а старые – меньший.
Формула (Pine-эквивалент):
COG = – Σ (price × (i+1)) / Σ price
• i = 0 – самый свежий бар
• i = length-1 – самый старый бар
Знак «минус» просто переворачивает кривую, чтобы экстремумы совпадали с разворотами цены.
Бары: | 9 | 8| 7 | 6| 5| 4| 3 | 2 | 1 | 0 |
Вес: |1 | 2 | 3 | 4| 5| 6| 7| 8 | 9| 10|
Где применяют COG
Разворотные зоны
– когда цена отходит далеко от COG, считается «перекупленностью/перепроданностью»; возврат к COG – потенциальный разворот.
Динамическая опора/сопротивление
– в боковике цена часто отталкивается от COG.
Фильтр тренда
– если COG растёт → восходящий тренд, падает → нисходящий.
Пары стратегий
• COG + полосы отклонения (аналог Bollinger) приводится в линиях
• COG + RSI – подтверждение дивергенций
• COG + объём (взвешивать по volume) приводится в желтых линиях
EMA9, EMA200 with Bollinger BandsThe indicator includes the EMA9 line, the EMA200 line and the Bollinger Bands into a single indicator plot.

EMA+ATR Band MTF Trend EntryThis is a Multi-Timeframe Trend Trading indicator strategy adapted from Sahil Rohmehtra’s Mentorship programme. The trading decision is made by first accessing the trend in higher timeframe (say Monthly) by using TWO EMAs. If the faster EMA (say 20 period) is above Slower EMA (say 50 period) and the price is above slower EMA then the trend is suitable for buyers. Similarly if faster EMA is below slow EMA and the price is below that then trend is suitable for sellers.
Once we access the trend in the higher timeframe we move to the lower timeframe (say Weekly) and access the 5-period RSI value. If RSI is below 30 then we can prepare for possible buy entry in lower (Daily) timeframe if entry conditions are met in daily timeframe. Similarly sell bias can be initiated when the higher timeframe EMA trend is down, daily RSI is above 70 and sell entry condition is met in daily timeframe. The RSI thresholds can be changed by the user.
Once we identified the RSI bias then wait for the confirmation candle in the lower timeframe (say 1 hour). In the entry timeframe we plot a band of 20 EMA of LOWs ± 1 ATR lines. Here,we wait for a candle to close above the 20 EMA of LOWs + 1 ATR for a buy signal with an increase in On Balance Volume (OBV) value. Similarly for sell signal we should get a candle close below the 20 EMA of LOWs - 1 ATR with corresponding change in OBV. This candle is the signal candle.
Once we get a Buy or Sell signal the corresponding stop loss is the nearest LOW - 1 ATR or HIGH + 1 ATR. The ATR scaling may be changed by the user. Now if another candle closes above the high of the buy signal candle then enter on buy. If the low of the buy signal candle is broken then it is a potential short-term sell entry. Similarly if another candle closes below the sell signal candle then enter short and if there is a close above high of the signal candle then it is a potential buy entry.
