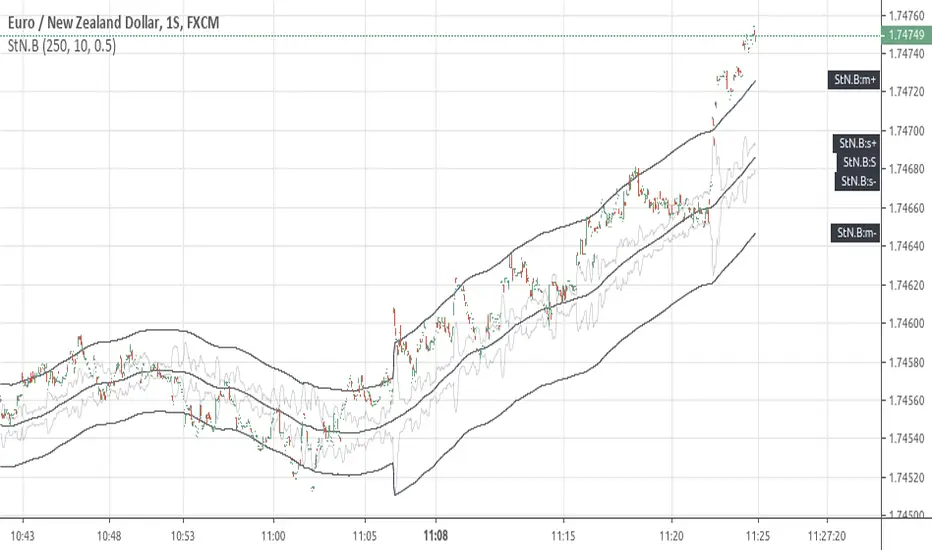
[RS]Signal to Noise BandsEXPERIMENTAL:
Bands using Signal to Noise Calculation.
The bands calculation is similar to bolingers in the aspect that both use standard deviation.
在脚本中搜索"bands"
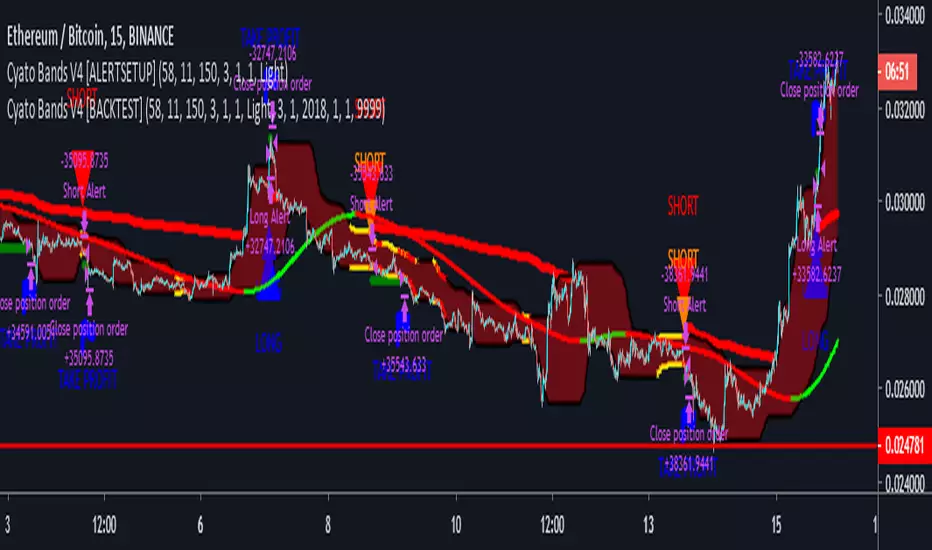
Cyatophilum Bands Pro Trader V4 [ALERTSETUP]> > PRESENTATION < <
This version includes a new feature, engineered to increase profitability.
About the backtest below:
Short + Long Strategy
0.05% Commission
10% of 10 000% equity per trade. Net Profit can be increased with a bigger % of equity.
Strategy data from 01/11/2019 to 30/04/2019
The Cyatophilum Bands, Trailing Stop Loss and Take Profit System are explained on here .
To automate the indicator, there are up to 8 different alerts that you can use:
1. LONG ENTRY
2. LONG EXIT
3. SHORT ENTRY
4. SHORT EXIT
5. TAKE PROFIT LONG
6. TAKE PROFIT SHORT
7. STOP LOSS LONG
8. STOP LOSS SHORT
The access to this indicator is included in the Cyatophilum Indicators pack available on my website .
To get a free trial, simply leave a comment, thank you very much for reading !
Previous version :
RSI Bands changer with 50 - follows trendThis is a RSI that changes the values of its bands (30-80, 20-70), according to the trend that is going on, given by the 2 classic EMA 12 and 26.
There are also the classic bands 30-70 and the middle one (for reference).
I hope you like it ;) .

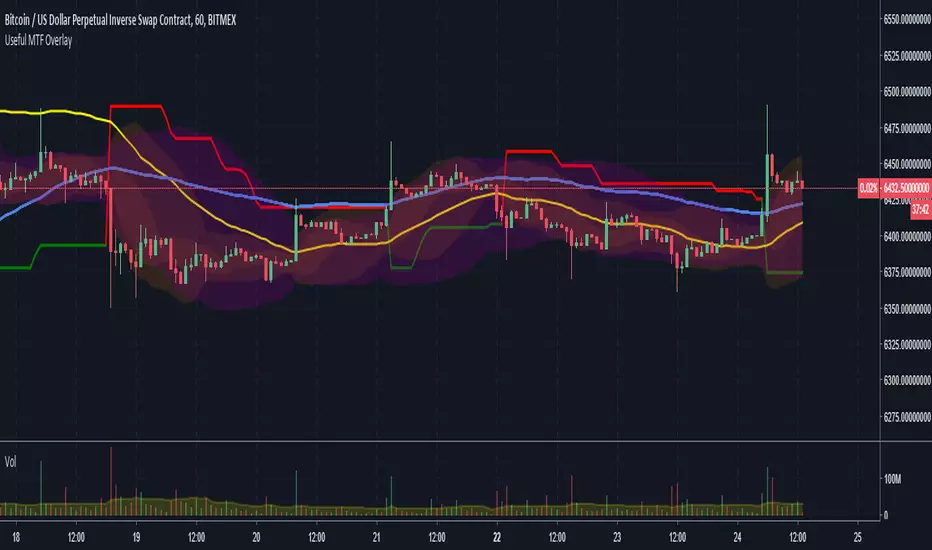
MTF Bollinger Bands, SuperTrend, TEMA Wave and ATR Stop LossThis script is a combination of useful overlay indicators that can be used for day trading or swing trading. You can use it for long term positions as well, but some tweaking may be required. I also added the multi time frame possibility for the majority of settings. This indicator gives you a lot of opportunities and trade setups. Default settings are made for day trading, using intraday time frames.
This script can display the following:
4 independent Bollinger Bands (MTF)
4 independent SuperTrends (MTF)
6 independent TEMAs (MTF)
ATR Stop loss for longs / shorts
Default settings display 3 Bollinger Bands, 2 TEMAs(I have found these two TEMAs particullarly useful, see screenshots below) and a signle SuperTrend.
Do not forget to always use a proper stop loss and risk management.
Here you can see the script in action in different markets:
BTC - BitMex - Setup before the drop from 7400 USD
BTC - BitMex - Setup before the drop from 8400 USD
BTC - BitMex - Setup before the pump to 7800 USD
BTC - BitMex - Setup before the pump to 6800 USD
Interquartile Range BandsInterquartile Range Bands script.
This indicator was originally developed by Alex Orekhov at his home.
The idea based on the interquartile range en.wikipedia.org
If price breaks out from the bands then it is `outlier` price.
After breakouts price always returns to its median.
Watch squeeze/expansion periods.
Anyway use it as a supplement to the other indicators.
I will glad to get your feedback.

OHLC Daily Resolution BandsShout out to nPE- for the idea.
Bands made with stdev from 10 day OHLC.
Keeps resolution to daily, so you can use bands as daily pivots for day trading.
Upper band 1=yesterday close + 0.5 std(ohlc,10)
Upper band 1=yesterday close + 1 std(ohlc,10)
Mid=yesterday close
Lower band 1=yesterday close - 0.5 std(ohlc,10)
Lower band 2=yesterday close - 1 std(ohlc,1

FIBONACCI BANDS by KIVANCfr3762Calculated with a default value of 14 periods of EMA and 14 periods of Average True Range ( SMA )
There are 4 levels of upper bands and 4 levels of lower bands in the indicator
its calculated adding and subtracting ATR( SMA ) values with coefficients 1, 1.618, 2.618 and 4.236 (Fibonacci ratios) to EMA of close prices.
Top and Bottom Fibo lines are aceepted as significant Resistance and Support levels.

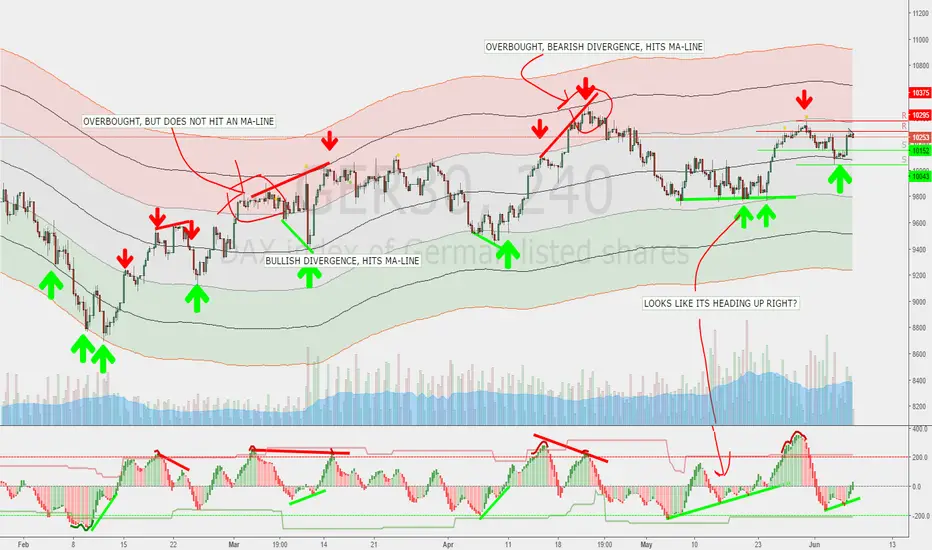
Yacine MA Bands ModMashed together the ema-bands from IvanLabrie with some moving average script stuff from ChrisMoody and LazyBear and this is the result. Credit goes to them, 'cause I don't know to how to code tbh. Just copy/pasted stuff untill I got the result I wanted.
Bands work as support/resistance among other things. You can use them to trade breakouts or reversals or whatever.
Combining them with a momentum indicator would probably be useful for timing divergence or OB/OS and stuff like that.
Included moving average types;
SMA
EMA
RMA
WMA
VWMA
HullMA
TilsonMA
TEMA
Not sure if all of them works as they should... y'know since I cant code/script. Looks good to me though.¨
Default should work pretty good for the DAX, But you'll probably want to fiddle a bit with the settings.
Here's a pic of how they can be used. Ofc everything looks simple in hindsight, but you get the point.
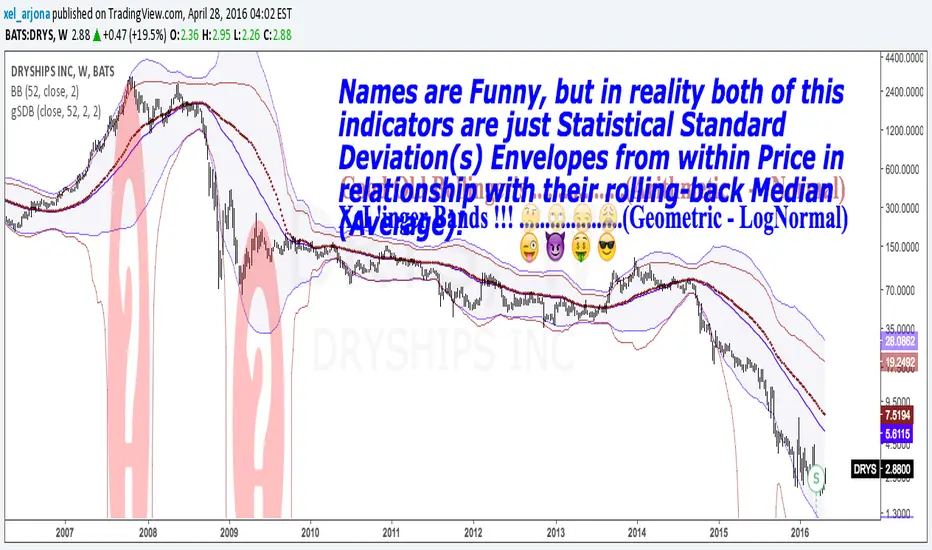
GEOMETRIC STANDARD DEVIATION BANDS v1 by @XeL_ArjonaGEOMETRIC STANDARD DEVIATION BANDS
Ver.1 By Ricardo M Arjona @XeL_Arjona
DISCLAIMER:
The Following indicator/code IS NOT intended to be a formal investment advice or recommendation by the author, nor should be construed as such. Users will be fully responsible by their use regarding their own trading vehicles/assets.
The embedded code and ideas within this work are FREELY AND PUBLICLY available on the Web for NON LUCRATIVE ACTIVITIES and must remain as is.
WHAT'S THIS?
This IS NOT the wheel "Re-Invention"... This is exactly what the name says: A pair of Envelope Bands to measure "volatility", constructed at statistical relation from within price series and their Rolling back MEAN (Simple Moving Average). YES, What Mr. Bollinger did and put it's name to this simple, cleaver and popular formula.
This time, I took the time to make another simple mod, but seems to me to be quite functional in REAL VOLATILE assets like in the example chart: TO USE THEIR GEOMETRIC MODE!!
Cheers!
Any feedback or public modification(s) are quite welcome to the community....!
@XeL_Arjona
Apr 28 2016
Variable Moving Average Bands [LazyBear]VMA Bands are ATR bands with VMA as its centre. For a description of options, refer to my VMA post:
I have moved VMA calculation in to a separate function. Feel free to use calc_vma() in your scripts. For more MA calculation function (KAMA, VIDYA and others), refer to my complete list of indicators below.
Wish you all a very prosperous New year. Hope these indicators make you all more money this year too :)
List of my other indicators:
- GDoc: docs.google.com
- Chart:

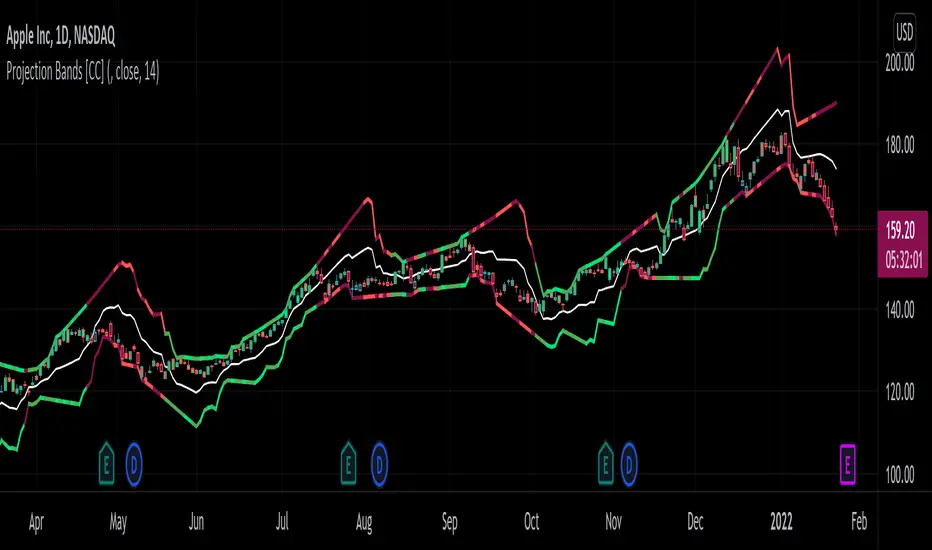
Projection Bands [CC]The Projection Bands were created by Mel Widner (Stocks and Commodities Jul 1995) and this indicator and the other two that rely on this one (I will publish them later) are very underappreciated in my humble opinion. The biggest strength of this indicator is the fact that it is a leading indicator for dramatic price movements. As you can see in my example chart it consistently gives great exit points before a downturn. I have included strong buy and sell signals in addition to normal ones so strong signals are darker in color and normal signals are lighter in color. Buy when the line turns green and sell when it turns red.
Let me know if there are any other indicators or scripts you would like to see me publish!
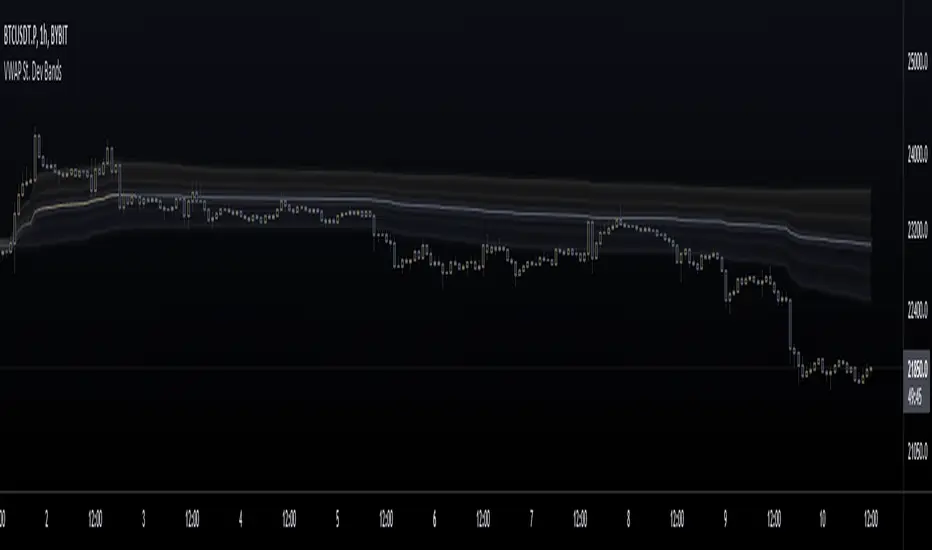
VWAP St. Dev BandsThis indicator allows you to add up to 3 volatility bands to VWAP based on its Standard Deviation.
Best use is for intraday but you can choose higher timeframes too.
For day trading a band of 3 standard deviations usually works well as an overbought/oversold region, allowing for mean reversion trading, but you are free to come up with your own strategies.
Enjoy!
Rate Of Change Bands [CC]The Rate Of Change Bands were created by Vitali Apirine (Stocks and Commodities March 2021 pg 14) and this indicator is a great method to not only check the momentum but also check the trend strength as well. I have color coded the lines so buy when the line turns green and sell when it turns red.
Let me know if there are any other indicators you want me to publish!

Moving Average BandsUse this script to find buy and sell zones for BTC based on momentum of the move relative to the average asset price over a given period. The script plots a series of offset bands above and below the Simple Moving Average. When price crosses another band further from the SMA, the background is rendered brighter. The brighter the background, the stronger the buy and sell signal is, as the expectation is that price wants to return to the SMA. Settings are adjustable to fine tune to various time frames and assets. Good settings for BTC Daily are length 30, layers at 10, 20, 30, and 40.
On 1H BTC/USD I use length 200, layers at 5, 10, 15, 20 to find decent swing trading opportunities.
On BTC/USD 1D chart, combine with Bitcoin Logarithmic Growth Curve from @mabonyi (original by @quantadelic )for confluence of very reliable signals.

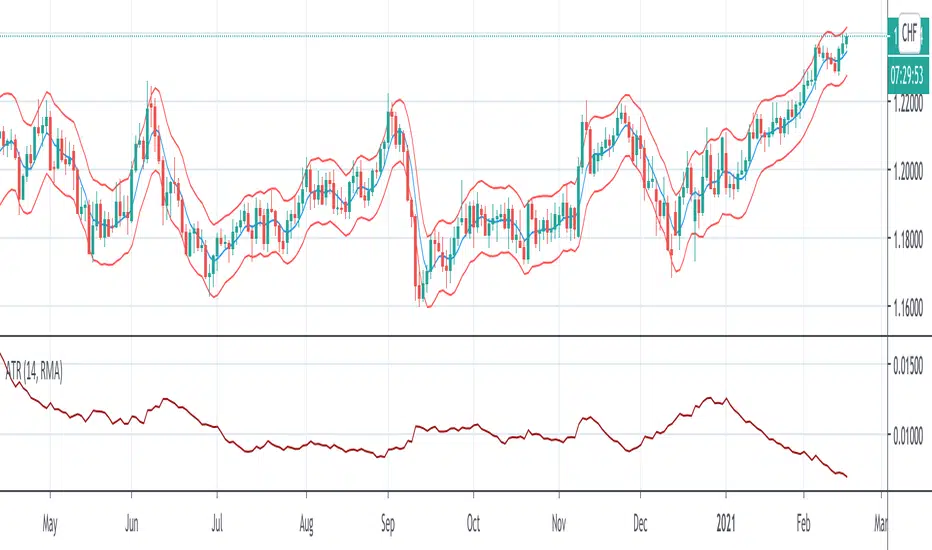
Arnaud Legoux Moving Average With ATR BandsArnaud Legoux Moving Average With ATR Bands to get an idea of the volatility.
Bitcoin: Confidence BandsPurpose of this Script
This script is designed to show regions of positive and negative overextension for Bitcoin, where price is expected to either reverse long-term or at least shorter-term, using custom price loops. The idea is that one can be highly confident that Bitcoin's price stays within the Confidence Bands, especially when looking at weekly closes. It might be wise to reduce exposure to Bitcoin when price gets very near to the red band, and vice versa for an approach of the blue band. Of course this constitutes no financial advice, and one should always consider all available information for making trading decisions.
Settings
This indicator should only be used:
- with the default inputs (but of course feel free to play around a bit for testing purposes)
- on the weekly (W) time frame
- and for the BraveNewCoin Liquid Index for Bitcoin (BNC:BLX).
Otherwise the intended functionality cannot be guaranteed.
Access
For access please contact me via DM on TradingView or on Twitter (linked on my TradingView profile and in my signature).

Flunki RSI Candles 2x LinReg 2x BandsHerewith ;
RSI as Candles
With Linear Regression and a multiplied Linear Regression
With Adaptive Deviation Bands
Background highlighter highlights breaking of the slow / wide band.
I like it for scalping tops and bottoms on low time frames, but have a play..
The linear regression slopes show trend and divergence, might include divergence flags later....
Last script of 2020, wew.

Ultimate VWAP Bands- Ultimate VWAP Bands is a script that helps to decide and further clarify areas of oversold and overbought conditions.
- For example, when the price is in the lowest band it is extremely oversold relative to the VWAP . Hence it should be considered a good place to buy with a high risk to reward payoff.
- Each band is set at a fixed offset away from the VWAP . The "VWAP Band Multiplier" adjusts this and is a key part of the script. This allows the indicator to be adjusted based on the assets volatility . For example, with Crypto. A multiplier of 1 would be strongly advised. Whilst a multiplier of 0.1-0.25 would be useful for currency pairs.
- This indicator can be used for all manners of trading. However, it is most effective when used for scalping and swing trading.

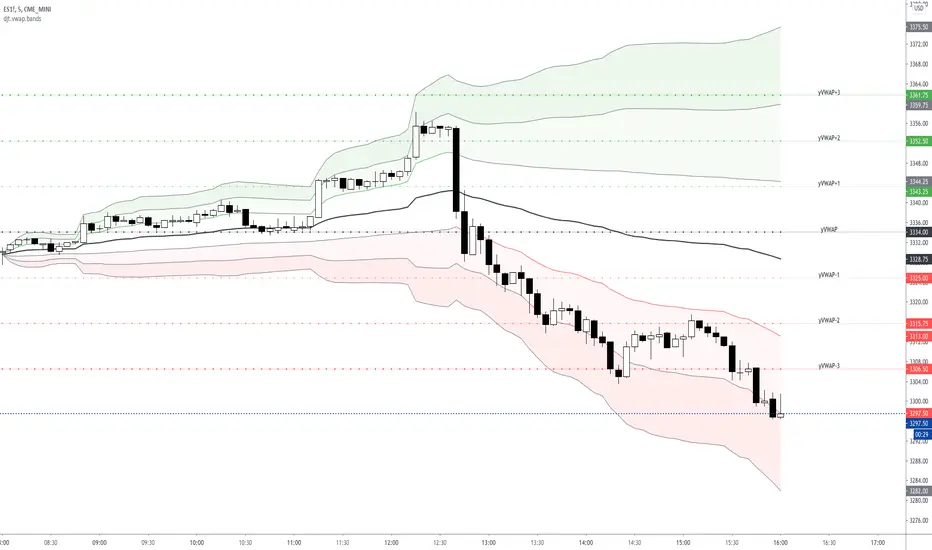
VWAP Standard Deviation Bands w/History & LabelsThis is my bread and butter when trading futures .
- 3 Standard Deviation Bands (Above and Below)
- Yesterday's VWAP and Band Levels
- Labels to help keep track of levels
- Ability to define resolution (I use Daily for my intraday scalping and Weekly/Monthly for context)
CS PSAR EVWMA ATR Bands This indicator displays a trend line by feeding a Parabolic SAR into an Exponential Volume Weighted Moving Average.
This trend line is then used with the ATR to display 4 bands indicating trend direction and potential reversals in price.

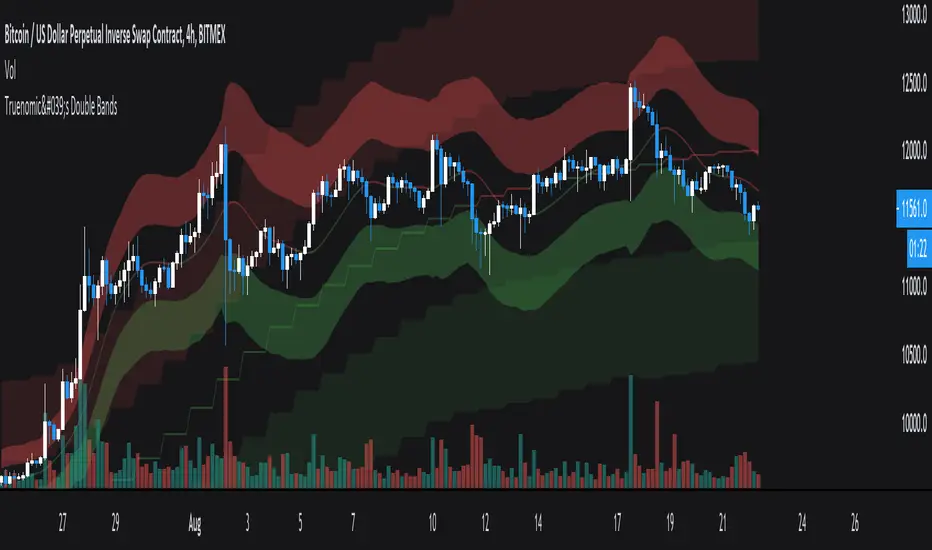
Truenomic's Double BandsThis is a fairly simple indicator based on the modernized moving average and ATR. These bands are relevant not only in the range, but also with a long-term trend.
I have personally used this in my trading system for a long time.
Alpha BandsAlpha Bands, this is a new idea I've been playing with recently in all my indicators.
In layman terms we are here using mult to multiply length of the plot to replicate effect of multi time frame plot. Under the hood it is basically fast ma crossing over slow one but with this simple multiplier introduction is able to give it properties of higher TF ma's but without the usual problem of the TV where multitimeframe MA plots rather crudely if you use security function.
Introducing it as core trend indicator, and around it I've utilized ATR to create simple but complete indicator to give good view of the market state and trend. Due to this setup it can be used for both trending and mean reversion trades, you can also utilize existing ranges for entry, exit and SL.
This indicator is example of how simple little tweaks can turn a age old tools into more advanced solutions.
This is purely for educational purposes, any past or claimed results may not replicate themselves while you trade them so use your own discretion. Author takes no responsibility of individual traders success or loss on this.
Source code will be protected since there is trend on TV where ideas are stolen and sold to unsuspecting retailers.

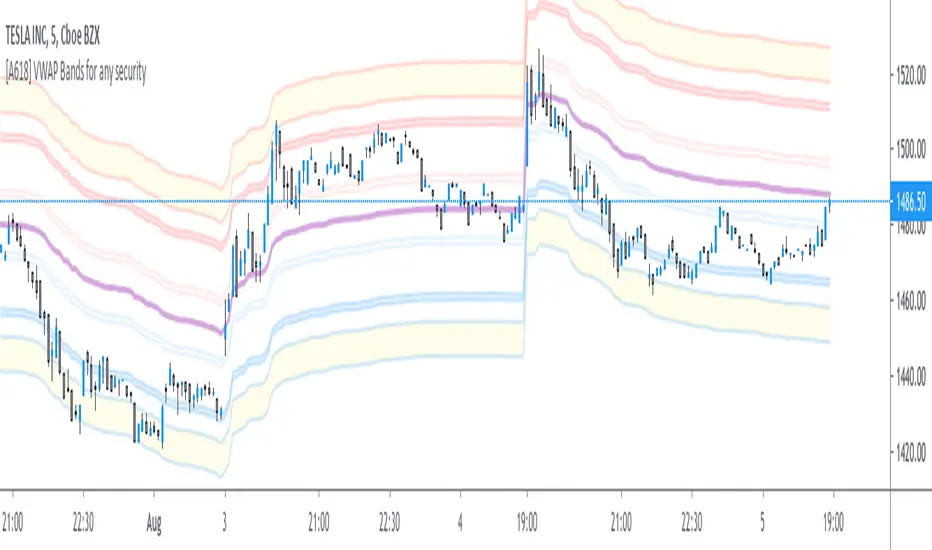
[A618] VWAP bands for any SecurityThe Script plots Standard Deviation Bands around The VWAP line,
This will help you out with detecting market overbought and oversold Conditions on the Fly
Use this in conjunction with an oscillator
- stoch, macd, etc...
- if you find a positive crossover with oscillator on a VWAP level its time to go long, targeting the next vwap level and vice-versa