LRSI-TTM Squeeze - AynetThis Pine Script code creates an indicator called LRSI-TTM Squeeze , which combines two key concepts to analyze momentum, squeeze conditions, and price movements in the market:
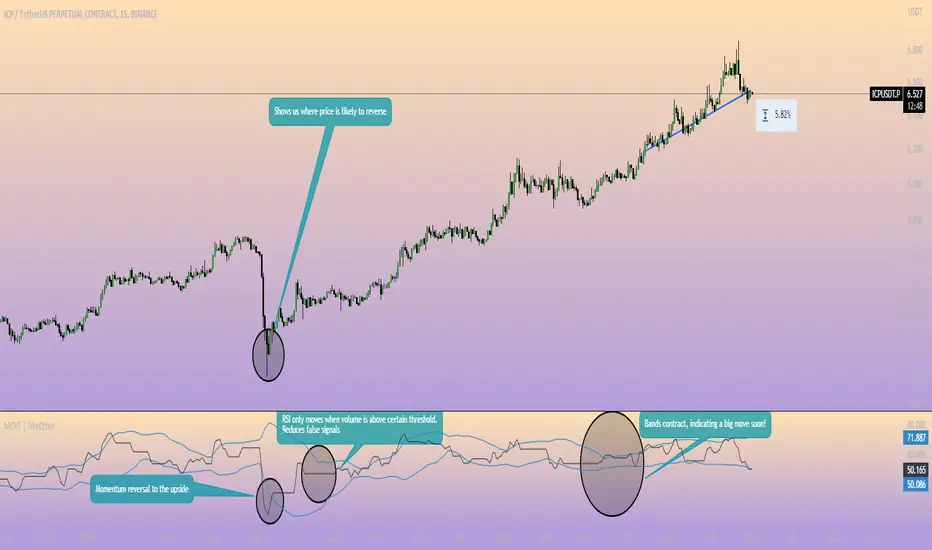
Laguerre RSI (LaRSI): A modified version of RSI used to identify trend reversals in price movements.
TTM Squeeze: Identifies market compressions (low volatility) and potential breakouts from these squeezes.
Functionality and Workflow of the Code
1. Laguerre RSI (LaRSI)
Purpose:
Provides a smoother and less noisy version of RSI to track price movements.
Calculation:
The script uses a filtering coefficient (alpha) to process price data through four levels (L0, L1, L2, L3).
Movement differences between these levels calculate buying pressure (cu) and selling pressure (cd).
The ratio of these pressures forms the Laguerre RSI:
bash
Kodu kopyala
LaRSI = cu / (cu + cd)
The LaRSI value indicates:
Below 20: Oversold condition (potential buy signal).
Above 80: Overbought condition (potential sell signal).
2. TTM Squeeze
Purpose:
Analyzes the relationship between Bollinger Bands (BB) and Keltner Channels (KC) to determine whether the market is compressed (low volatility) or expanded (high volatility).
Calculation:
Bollinger Bands:
Calculated based on the moving average (SMA) of the price, with an upper and lower band.
Keltner Channels:
Created using the Average True Range (ATR) to calculate an upper and lower band.
Squeeze States:
Squeeze On: BB is within KC.
Squeeze Off: BB is outside KC.
Other States (No Squeeze): Neither of the above applies.
3. Momentum Calculation
Momentum is computed using the linear regression of the difference between the price and its SMA. This helps anticipate the direction and strength of price movements when the squeeze ends.
Visuals on the Chart
Laguerre RSI Line:
An RSI indicator scaled to 0-100 is plotted.
The line's color changes based on its movement:
Green line: RSI is rising.
Red line: RSI is falling.
Key levels:
20 level: Oversold condition (buy signal can be triggered).
80 level: Overbought condition (sell signal can be triggered).
Momentum Histogram:
Displays momentum as histogram bars with colors based on its direction and strength:
Lime (light green): Positive momentum increasing.
Green: Positive momentum decreasing.
Red: Negative momentum decreasing.
Maroon (dark red): Negative momentum increasing.
Squeeze Status Indicator:
A marker is plotted on the zero line to indicate the squeeze state:
Yellow: Squeeze On (compression active).
Blue: Squeeze Off (compression ended, movement expected).
Gray: No Squeeze.
Information Table
A table is displayed in the top-right corner of the chart, showing closing prices for different timeframes (e.g., 1 minute, 5 minutes, 1 hour, etc.). Each timeframe is color-coded.
Alerts
LaRSI Alerts:
Crosses above 20: Exiting oversold condition (buy signal).
Crosses below 80: Exiting overbought condition (sell signal).
Squeeze Alerts:
When the squeeze ends: Indicates a potential price move.
When the squeeze starts: Indicates volatility is decreasing.
Summary
This indicator is a powerful tool for determining market trends, momentum, and squeeze conditions. It helps users identify periods when the market is likely to move or remain stagnant, providing alerts based on these analyses to support trading strategies.
Pine Script®指标