Pine Script®指标
在脚本中搜索"bar"

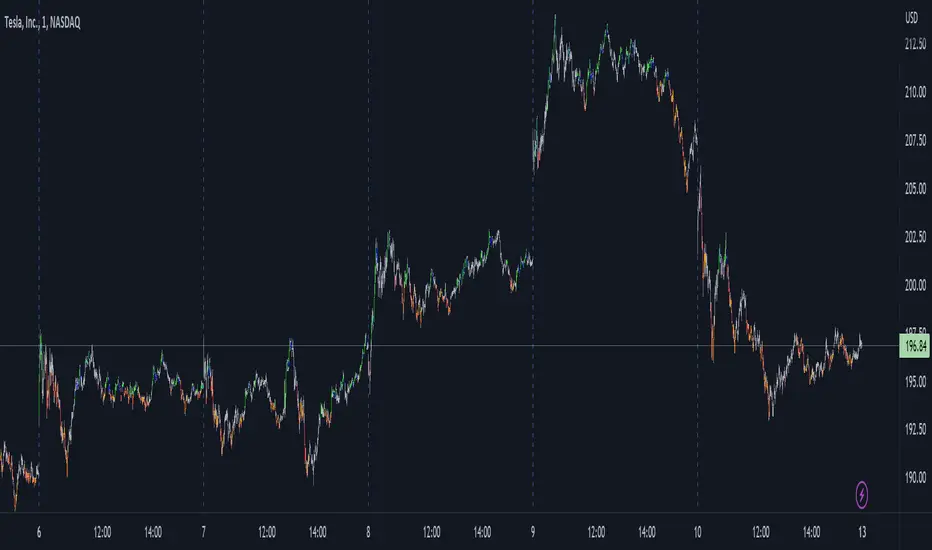
VWAP filtered MACD Bars with positive MACD histogram value and closing above VWAP are colored, long positions should be taken in areas made of those bars.
Similarly, bars with negative MACD histogram value and closing below VWAP are also colored, short positions should be taken there.
This indicator by default should be a part of your trend following trading system.
In the setting you can change colors
Above grow: positive and rising MACD histogram value
Above fall: positive and falling MACD histogram value
Below fall: negative and falling MACD histogram value
Below grow: negative and rising MACD histogram value
Pine Script®指标
bar color changeThis Pine v5 code allows you to distinguish between candles on the chart. The body/wick/frame of the "live" candle that hasn't yet closed is colored white. When a live candle is present, the body of the immediately preceding candle is colored green with offset = -1. All other candles remain gray (#2e2e2e). plotcandle fixes the wick/frame so that the live and previous candles are selected when following the trend. If there are other conflicting scripts, the most recently added one quickly takes precedence.
Pine Script®指标

Bar RangeI use this to complement the daily ATR bars. It is interesting to see how much the stock has actually moved vs the ATR movement.
Pine Script®指标

Pine Script®指标
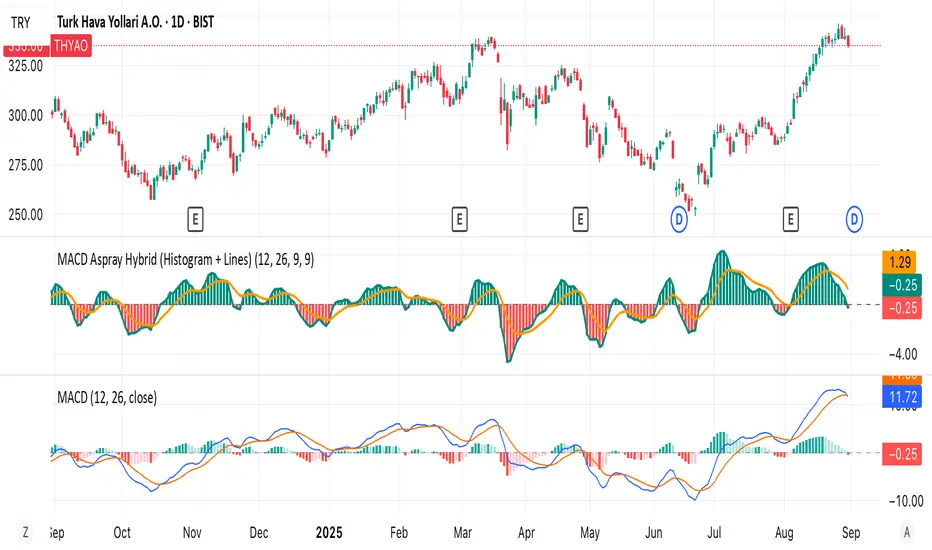
MACD Aspray Hybrid Bars (teal/red) = raw momentum (Aspray Histogram).
Teal line = smooth curve of the histogram (Aspray Line).
Orange line = 9-EMA of that line (new signal).
Zero line for reference.
Pine Script®指标
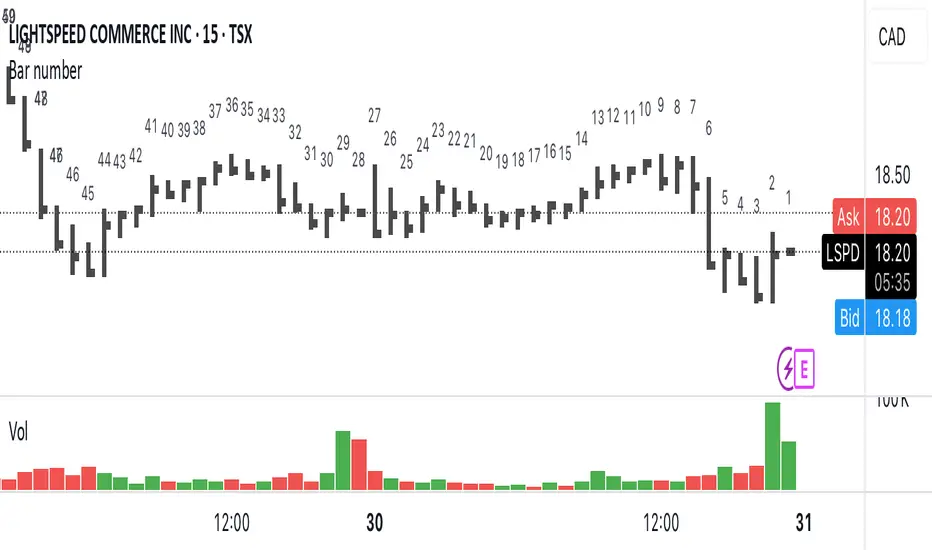
Bar numberAdds a number above the last 50 candles. Candle 1 is always the most recent.
Can be useful when teaching people onlinet. Now they can just ask « what’s candle number 20 » instead of « what’s with that narrow range candle next to the big one to the left… no not that one, the other one »
Pine Script®指标
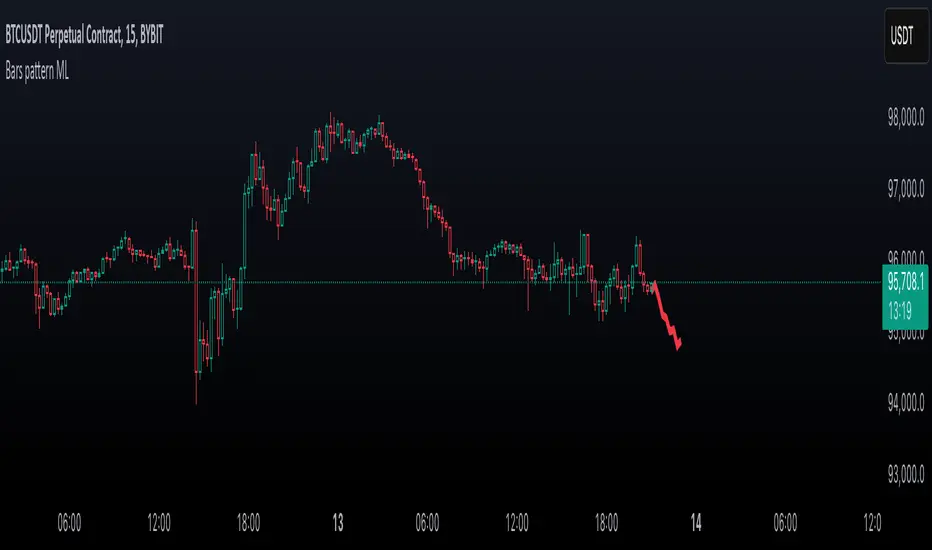
Bars pattern MLThis script implements a K-Nearest Neighbors (KNN)-based machine learning model to predict future price movements in financial markets. It analyzes past price action using Euclidean distance and selects the most similar historical patterns to estimate future price changes. Unlike traditional KNN implementations, this approach optimizes distance calculations by maintaining a dynamically updated list of the closest neighbors, ensuring efficient selection without the need for sorting. The model generates a forecasted price trajectory based on incremental predictions, which are visualized on the chart using polylines for better interpretability.
Pine Script®指标
Volume HighlightBar colouring: this indicator is simple but effective, it repaints higher than normal candles a certain colour (by default gold/yellow) it helps to know what are valuable areas to trade around for longs and shorts.
Changing the volume multiplier manually helps you to screen volume relevant to the timeframe you are trading on.
For example, some charts 1min the best filter/setting would be 12-35 multiplier where others like btc 1-4 hourly, the filter/setting might be 8-12.
The key is having only the highest/most relevant 3-4 volume candles showing as they often represent supports and resistances.
Pine Script®指标

Pine Script®策略

Pivot Points And Breakout Price Action With LuckyNickVaBar Color Candle Aligned with pivot points swing high and swing lows For Those Who Are Familiar with Trading The Breakouts Of Highs & Lows Of Structure. Pivots are said to be key areas in the market where price shows heavy reaction to where reversals make occur. At these points there are swing Highs & swing lows that traders may be able to find opportunity in the market. This Script is a combination of pivot points and Barcolor signals for the breakout.
Pine Script®指标

Koalafied Volume Extension Bar colours based on extensions from volume Z-Score. Large volume candles can often signal exhaustion or show market strength in reversals or breakouts. Candles not supported by rising volume are coloured black while those that are retain their colouring.
Pine Script®指标

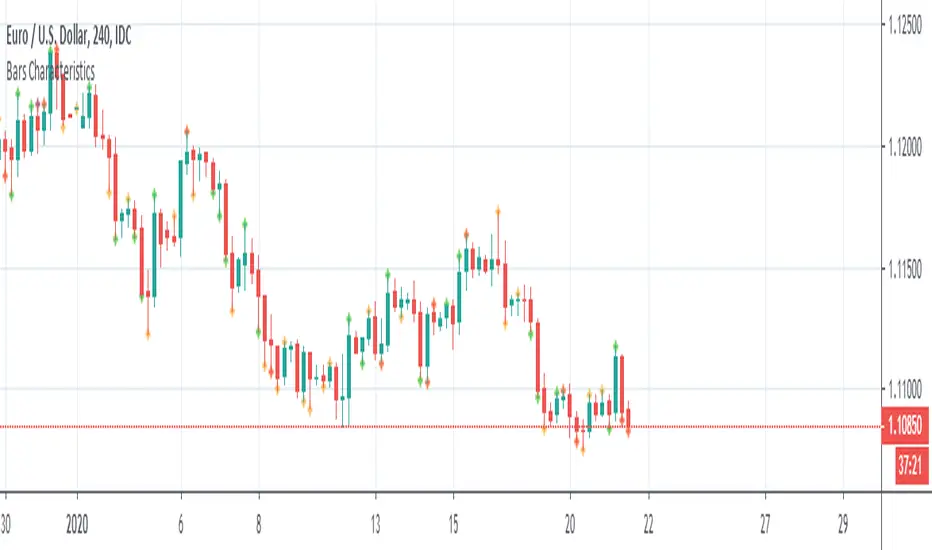
Bars CharacteristicsThis code is for defining or explaining market conditions via micro trend and the characterized bars.
lines 5,6: show the conditions for a normal trend, means market can go in the direction that it has in the past.
lines 11,12: show the conditions for kind of the trend having cumulative energy itself, mean market can go in the same direction.
lines 18,19: show the conditions for kind of the trend having overbought/sold concept, means it's better exit from the market or to look for the other clues.
lines 24,25: show some kind of noise not a stable trend, it's better not to enter the market.
Pine Script®指标
Pine Script®指标

WhenWasThePriceAction
Bars of largest range (volatility)
* see moments of strongest price action immediately
* colored & upDown by candle color
* amplifier: you see only the bull runs, and subsequent dumps
Very nice on the 5 years scale of BITSTAMP:BTCUSD - nothing comparable to 2013 has happened yet.
Internals:
squared_range = pow(high-low, 2)
That is essentially it already. The rest are details:
* gauge with (in case of Bitcoin exponentially rising) price
* show in red for negative candles
* take even higher polynomial (than 2) to show only the very largest values
* allow some user input (but there is not much more that can be chosen here.)
Sorry for such a simple formula - but sometimes the easiest things are powerful.
Please give feedback. www.tradingview.com and/or in the cryptocurrency chat. Thanks.
Pine Script®指标

Pine Script®指标

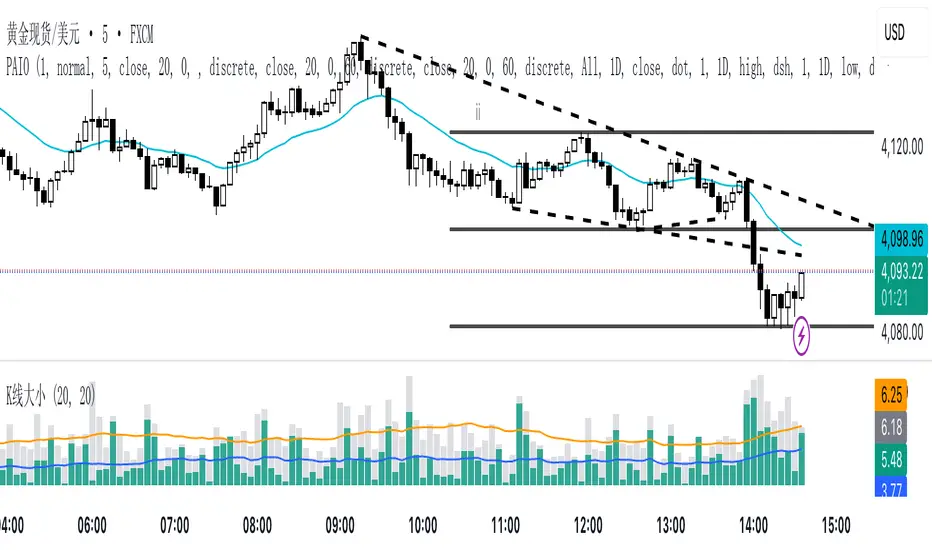
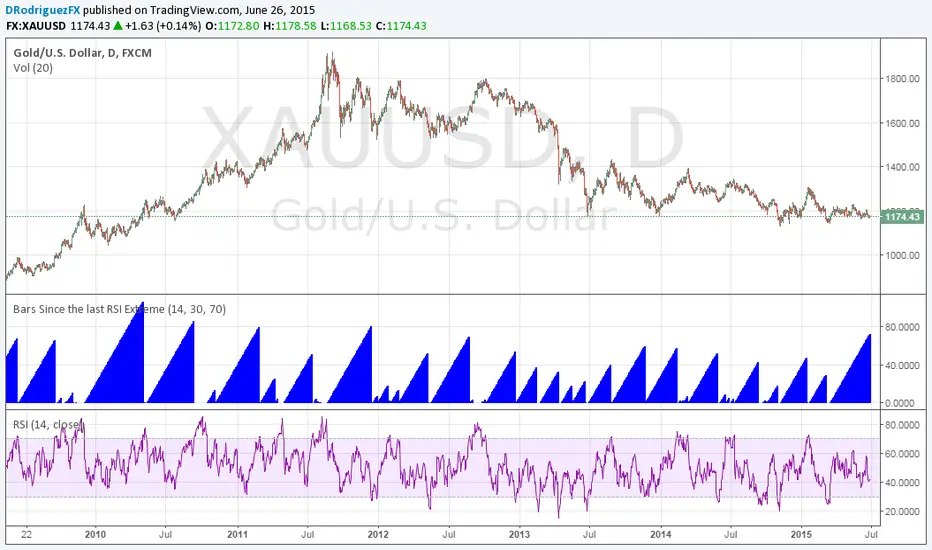
Bars Since the last RSI ExtremeThis is something Jamie Saettele pointed out. Gold has been in 'neutral' RSI territory for its longest stretch in four years. It's coiling up for its next major move.
Pine Script®指标
[blackcat] L1 CJDX Super Short Line█ OVERVIEW
CJDX Super Short Line is a momentum-based indicator optimized for short-term trading signals. It utilizes triple exponential moving average calculations to generate buy/sell signals through K/D line crossovers with momentum confirmation.
█ CONCEPTS
This indicator is based on the CJDX (超级短线/Super Short Line) methodology, which applies triple-smoothed exponential moving averages to identify short-term momentum shifts and generate trading signals.
Core Principles
• Triple EMA smoothing reduces noise while maintaining responsiveness
• K/D line crossovers identify momentum direction changes
• J-value filtering confirms trend alignment before signal generation
• Signal gap filtering prevents over-trading in choppy markets
█ HOW TO USE
1 — Add the indicator to your chart from the Indicators menu
2 — Observe the K line (white) and D line (red) for crossover signals
3 — Confirm signals with J histogram direction and zero-line position
4 — Use "B" markers for potential buy entries and "S" markers for sell exits
Signal Interpretation
• Buy Signal (B) : K line crosses above D line with J > 0, indicating upward momentum
• Sell Signal (S) : K line crosses below D line with J < 0, indicating downward momentum
• J Histogram : Red bars show positive momentum, green bars show negative momentum
█ CALCULATION METHOD
Base Components
• Weighted Typical Price: (2 × Close + High + Low) / 4
• Triple EMA: Three consecutive 4-period EMAs applied for maximum smoothness
• J Line Momentum: Rate of change of Triple EMA value
Signal Lines
• K Line (Fast): 3-period EMA of J momentum (optimized from 1-period SMA)
• D Line (Slow): 5-period EMA of J momentum (optimized from 3-period SMA)
█ FEATURES
Visual Elements
• J Histogram: Columns showing momentum strength (red = positive, green = negative)
• K Line (White): Fast signal line for crossover detection
• D Line (Red): Slow signal line acting as trigger reference
• Zero Axis: Dotted reference line for momentum direction
Signal Markers
• "B" Label: Buy signal marker in red text
• "S" Label: Sell signal marker in green text
Optimizations
• EMA-based smoothing instead of SMA for reduced lag
• Momentum confirmation (J > 0 for buy, J < 0 for sell)
• 3-bar minimum gap between signals to reduce noise
█ RECOMMENDED SETTINGS
• Best suited for short-term trading on 15-minute to 4-hour timeframes
• Works well in trending markets with clear momentum direction
• Signal gap period is set to 3 bars by default
• Consider combining with volume analysis for confirmation
█ LIMITATIONS
• May generate false signals in ranging or sideways markets
• Lag inherent in all moving average-based indicators
• Not suitable as a standalone trading system
• Performance varies across different market conditions and assets
█ NOTES
• This is an optimized version of the classic CJDX indicator
• Original SMA calculations replaced with EMA for improved responsiveness
• Signal filtering helps avoid consecutive buy/sell signals within 3 periods
• Always use proper risk management and confirm signals with additional analysis
═════════════════════════════════════════════════════════════════════════
For questions or feedback, use comments section below.
Pine Script®指标

FuseKC v6 (Clean + Mode Badge + Flip + Reasons)FuseKC is a confluence-based mode indicator that simplifies decision-making into one of three states:
✅ Modes (one big on-chart badge)
BUY MODE → all bullish conditions align (high-probability long environment)
SELL MODE → all bearish conditions align (high-probability short environment)
STAY OUT → conditions are mixed or incomplete (avoid low-quality trades)
The badge updates on the last bar so you always know the current state at a glance.
What drives the Mode
1) KC Bias Engine (core direction)
Uses a Keltner-style EMA + ATR band on higher timeframes (HTF1 + optional HTF2).
Bull bias when price is above the HTF basis
Bear bias when price is below the HTF basis
2) Weekly Break + Optional Wait Gate
Looks for a break of the previous week high/low.
Optionally enforces a 2–3 week wait rule after a big weekly move before allowing new triggers.
3) EMA Filter
Optional EMA confirmation:
Long favor when price above EMA trend (and optionally stacked above EMA regime)
Short favor when price below EMA trend (and optionally stacked below EMA regime)
4) RVOL Filter (your rules)
Relative volume filter with clear color meaning:
Yellow = weak / dropping volume (below min)
Green = good (meets min)
Red = best (≥ 1.5× min)
5) ORB (Opening Range Breakout)
Builds an ORB range during the selected window after 9:30.
Then requires either:
Close Break or
Wick Break
to confirm the direction.
Bias Flip Visuals (optional)
To make transitions obvious:
Arrows print when KC bias flips
Background flashes for a user-set number of bars after a flip
This helps you notice when the environment changes without guessing.
“Why STAY OUT?” Reason List (optional)
When the mode is STAY OUT, the script can print a compact reason list (example):
No weekly break
Weekly wait gate not met
EMA filter not aligned
RVOL below min
ORB still building / no break
Chop/range conditions
This prevents “random trades” by showing exactly what is missing.
Panels + Tiles
Right Status Panel summarizes key conditions (Mode, Weekly, EMA, RVOL, ORB, levels, Ripster directions, ATR/DTR, Calls/Puts).
Bottom Tiles give quick-glance blocks for volume + Ripster MTF direction.
Best Use
Use FuseKC as a trade gate + environment filter:
Only take longs during BUY MODE
Only take shorts during SELL MODE
Stand down during STAY OUT (unless you have a separate mean-reversion plan)
Pine Script®指标

Chaikin Money Flow with Shaded BackgoundThis script is a modernized version of Chaikin Money Flow with time‑horizon presets, Histogram Mode, and Regime Background Shading.
Preset Modes
Daily – Standard (20): Classic CMF(20), ideal for swing trading.
**Weekly – Short (5): Time‑scaled equivalent of CMF(20) for weekly charts.
Monthly – Smooth (10): Long‑cycle accumulation/distribution smoothing.
Manual: Full control over CMF length.
These presets are designed to maintain **consistent time‑horizon behavior** across different chart timeframes.
Line: Traditional CMF line.
Histogram: Momentum‑style histogram.
Hybrid: Line + histogram.
CMF‑SMA Mode: Histogram shows CMF minus its SMA.
CMF Change Mode: Histogram shows bar‑to‑bar CMF acceleration.
Note: When using Histogram Mode, switch the Histogram Type input between CMF‑SMA and CMF Change depending on the style you want.
Green: CMF > 0 (Accumulation)
Red: CMF < 0 (Distribution)
This provides a clean, structural read of market pressure without cluttering the chart.
Pine Script®指标

ValueAtTime█ OVERVIEW
This library is a Pine Script® programming tool for accessing historical values in a time series using UNIX timestamps . Its data structure and functions index values by time, allowing scripts to retrieve past values based on absolute timestamps or relative time offsets instead of relying on bar index offsets.
█ CONCEPTS
UNIX timestamps
In Pine Script®, a UNIX timestamp is an integer representing the number of milliseconds elapsed since January 1, 1970, at 00:00:00 UTC (the UNIX Epoch ). The timestamp is a unique, absolute representation of a specific point in time. Unlike a calendar date and time, a UNIX timestamp's meaning does not change relative to any time zone .
This library's functions process series values and corresponding UNIX timestamps in pairs , offering a simplified way to identify values that occur at or near distinct points in time instead of on specific bars.
Storing and retrieving time-value pairs
This library's `Data` type defines the structure for collecting time and value information in pairs. Objects of the `Data` type contain the following two fields:
• `times` – An array of "int" UNIX timestamps for each recorded value.
• `values` – An array of "float" values for each saved timestamp.
Each index in both arrays refers to a specific time-value pair. For instance, the `times` and `values` elements at index 0 represent the first saved timestamp and corresponding value. The library functions that maintain `Data` objects queue up to one time-value pair per bar into the object's arrays, where the saved timestamp represents the bar's opening time .
Because the `times` array contains a distinct UNIX timestamp for each item in the `values` array, it serves as a custom mapping for retrieving saved values. All the library functions that return information from a `Data` object use this simple two-step process to identify a value based on time:
1. Perform a binary search on the `times` array to find the earliest saved timestamp closest to the specified time or offset and get the element's index.
2. Access the element from the `values` array at the retrieved index, returning the stored value corresponding to the found timestamp.
Value search methods
There are several techniques programmers can use to identify historical values from corresponding timestamps. This library's functions include three different search methods to locate and retrieve values based on absolute times or relative time offsets:
Timestamp search
Find the value with the earliest saved timestamp closest to a specified timestamp.
Millisecond offset search
Find the value with the earliest saved timestamp closest to a specified number of milliseconds behind the current bar's opening time. This search method provides a time-based alternative to retrieving historical values at specific bar offsets.
Period offset search
Locate the value with the earliest saved timestamp closest to a defined period offset behind the current bar's opening time. The function calculates the span of the offset based on a period string . The "string" must contain one of the following unit tokens:
• "D" for days
• "W" for weeks
• "M" for months
• "Y" for years
• "YTD" for year-to-date, meaning the time elapsed since the beginning of the bar's opening year in the exchange time zone.
The period string can include a multiplier prefix for all supported units except "YTD" (e.g., "2W" for two weeks).
Note that the precise span covered by the "M", "Y", and "YTD" units varies across time. The "1M" period can cover 28, 29, 30, or 31 days, depending on the bar's opening month and year in the exchange time zone. The "1Y" period covers 365 or 366 days, depending on leap years. The "YTD" period's span changes with each new bar, because it always measures the time from the start of the current bar's opening year.
█ CALCULATIONS AND USE
This library's functions offer a flexible, structured approach to retrieving historical values at or near specific timestamps, millisecond offsets, or period offsets for different analytical needs.
See below for explanations of the exported functions and how to use them.
Retrieving single values
The library includes three functions that retrieve a single stored value using timestamp, millisecond offset, or period offset search methods:
• `valueAtTime()` – Locates the saved value with the earliest timestamp closest to a specified timestamp.
• `valueAtTimeOffset()` – Finds the saved value with the earliest timestamp closest to the specified number of milliseconds behind the current bar's opening time.
• `valueAtPeriodOffset()` – Finds the saved value with the earliest timestamp closest to the period-based offset behind the current bar's opening time.
Each function has two overloads for advanced and simple use cases. The first overload searches for a value in a user-specified `Data` object created by the `collectData()` function (see below). It returns a tuple containing the found value and the corresponding timestamp.
The second overload maintains a `Data` object internally to store and retrieve values for a specified `source` series. This overload returns a tuple containing the historical `source` value, the corresponding timestamp, and the current bar's `source` value, making it helpful for comparing past and present values from requested contexts.
Retrieving multiple values
The library includes the following functions to retrieve values from multiple historical points in time, facilitating calculations and comparisons with values retrieved across several intervals:
• `getDataAtTimes()` – Locates a past `source` value for each item in a `timestamps` array. Each retrieved value's timestamp represents the earliest time closest to one of the specified timestamps.
• `getDataAtTimeOffsets()` – Finds a past `source` value for each item in a `timeOffsets` array. Each retrieved value's timestamp represents the earliest time closest to one of the specified millisecond offsets behind the current bar's opening time.
• `getDataAtPeriodOffsets()` – Finds a past value for each item in a `periods` array. Each retrieved value's timestamp represents the earliest time closest to one of the specified period offsets behind the current bar's opening time.
Each function returns a tuple with arrays containing the found `source` values and their corresponding timestamps. In addition, the tuple includes the current `source` value and the symbol's description, which also makes these functions helpful for multi-interval comparisons using data from requested contexts.
Processing period inputs
When writing scripts that retrieve historical values based on several user-specified period offsets, the most concise approach is to create a single text input that allows users to list each period, then process the "string" list into an array for use in the `getDataAtPeriodOffsets()` function.
This library includes a `getArrayFromString()` function to provide a simple way to process strings containing comma-separated lists of periods. The function splits the specified `str` by its commas and returns an array containing every non-empty item in the list with surrounding whitespaces removed. View the example code to see how we use this function to process the value of a text area input .
Calculating period offset times
Because the exact amount of time covered by a specified period offset can vary, it is often helpful to verify the resulting times when using the `valueAtPeriodOffset()` or `getDataAtPeriodOffsets()` functions to ensure the calculations work as intended for your use case.
The library's `periodToTimestamp()` function calculates an offset timestamp from a given period and reference time. With this function, programmers can verify the time offsets in a period-based data search and use the calculated offset times in additional operations.
For periods with "D" or "W" units, the function calculates the time offset based on the absolute number of milliseconds the period covers (e.g., `86400000` for "1D"). For periods with "M", "Y", or "YTD" units, the function calculates an offset time based on the reference time's calendar date in the exchange time zone.
Collecting data
All the `getDataAt*()` functions, and the second overloads of the `valueAt*()` functions, collect and maintain data internally, meaning scripts do not require a separate `Data` object when using them. However, the first overloads of the `valueAt*()` functions do not collect data, because they retrieve values from a user-specified `Data` object.
For cases where a script requires a separate `Data` object for use with these overloads or other custom routines, this library exports the `collectData()` function. This function queues each bar's `source` value and opening timestamp into a `Data` object and returns the object's ID.
This function is particularly useful when searching for values from a specific series more than once. For instance, instead of using multiple calls to the second overloads of `valueAt*()` functions with the same `source` argument, programmers can call `collectData()` to store each bar's `source` and opening timestamp, then use the returned `Data` object's ID in calls to the first `valueAt*()` overloads to reduce memory usage.
The `collectData()` function and all the functions that collect data internally include two optional parameters for limiting the saved time-value pairs to a sliding window: `timeOffsetLimit` and `timeframeLimit`. When either has a non-na argument, the function restricts the collected data to the maximum number of recent bars covered by the specified millisecond- and timeframe-based intervals.
NOTE : All calls to the functions that collect data for a `source` series can execute up to once per bar or realtime tick, because each stored value requires a unique corresponding timestamp. Therefore, scripts cannot call these functions iteratively within a loop . If a call to these functions executes more than once inside a loop's scope, it causes a runtime error.
█ EXAMPLE CODE
The example code at the end of the script demonstrates one possible use case for this library's functions. The code retrieves historical price data at user-specified period offsets, calculates price returns for each period from the retrieved data, and then populates a table with the results.
The example code's process is as follows:
1. Input a list of periods – The user specifies a comma-separated list of period strings in the script's "Period list" input (e.g., "1W, 1M, 3M, 1Y, YTD"). Each item in the input list represents a period offset from the latest bar's opening time.
2. Process the period list – The example calls `getArrayFromString()` on the first bar to split the input list by its commas and construct an array of period strings.
3. Request historical data – The code uses a call to `getDataAtPeriodOffsets()` as the `expression` argument in a request.security() call to retrieve the closing prices of "1D" bars for each period included in the processed `periods` array.
4. Display information in a table – On the latest bar, the code uses the retrieved data to calculate price returns over each specified period, then populates a two-row table with the results. The cells for each return percentage are color-coded based on the magnitude and direction of the price change. The cells also include tooltips showing the compared daily bar's opening date in the exchange time zone.
█ NOTES
• This library's architecture relies on a user-defined type (UDT) for its data storage format. UDTs are blueprints from which scripts create objects , i.e., composite structures with fields containing independent values or references of any supported type.
• The library functions search through a `Data` object's `times` array using the array.binary_search_leftmost() function, which is more efficient than looping through collected data to identify matching timestamps. Note that this built-in works only for arrays with elements sorted in ascending order .
• Each function that collects data from a `source` series updates the values and times stored in a local `Data` object's arrays. If a single call to these functions were to execute in a loop , it would store multiple values with an identical timestamp, which can cause erroneous search behavior. To prevent looped calls to these functions, the library uses the `checkCall()` helper function in their scopes. This function maintains a counter that increases by one each time it executes on a confirmed bar. If the count exceeds the total number of bars, indicating the call executes more than once in a loop, it raises a runtime error .
• Typically, when requesting higher-timeframe data with request.security() while using barmerge.lookahead_on as the `lookahead` argument, the `expression` argument should be offset with the history-referencing operator to prevent lookahead bias on historical bars. However, the call in this script's example code enables lookahead without offsetting the `expression` because the script displays results only on the last historical bar and all realtime bars, where there is no future data to leak into the past. This call ensures the displayed results use the latest data available from the context on realtime bars.
Look first. Then leap.
█ EXPORTED TYPES
Data
A structure for storing successive timestamps and corresponding values from a dataset.
Fields:
times (array) : An "int" array containing a UNIX timestamp for each value in the `values` array.
values (array) : A "float" array containing values corresponding to the timestamps in the `times` array.
█ EXPORTED FUNCTIONS
getArrayFromString(str)
Splits a "string" into an array of substrings using the comma (`,`) as the delimiter. The function trims surrounding whitespace characters from each substring, and it excludes empty substrings from the result.
Parameters:
str (series string) : The "string" to split into an array based on its commas.
Returns: (array) An array of trimmed substrings from the specified `str`.
periodToTimestamp(period, referenceTime)
Calculates a UNIX timestamp representing the point offset behind a reference time by the amount of time within the specified `period`.
Parameters:
period (series string) : The period string, which determines the time offset of the returned timestamp. The specified argument must contain a unit and an optional multiplier (e.g., "1Y", "3M", "2W", "YTD"). Supported units are:
- "Y" for years.
- "M" for months.
- "W" for weeks.
- "D" for days.
- "YTD" (Year-to-date) for the span from the start of the `referenceTime` value's year in the exchange time zone. An argument with this unit cannot contain a multiplier.
referenceTime (series int) : The millisecond UNIX timestamp from which to calculate the offset time.
Returns: (int) A millisecond UNIX timestamp representing the offset time point behind the `referenceTime`.
collectData(source, timeOffsetLimit, timeframeLimit)
Collects `source` and `time` data successively across bars. The function stores the information within a `Data` object for use in other exported functions/methods, such as `valueAtTimeOffset()` and `valueAtPeriodOffset()`. Any call to this function cannot execute more than once per bar or realtime tick.
Parameters:
source (series float) : The source series to collect. The function stores each value in the series with an associated timestamp representing its corresponding bar's opening time.
timeOffsetLimit (simple int) : Optional. A time offset (range) in milliseconds. If specified, the function limits the collected data to the maximum number of bars covered by the range, with a minimum of one bar. If the call includes a non-empty `timeframeLimit` value, the function limits the data using the largest number of bars covered by the two ranges. The default is `na`.
timeframeLimit (simple string) : Optional. A valid timeframe string. If specified and not empty, the function limits the collected data to the maximum number of bars covered by the timeframe, with a minimum of one bar. If the call includes a non-na `timeOffsetLimit` value, the function limits the data using the largest number of bars covered by the two ranges. The default is `na`.
Returns: (Data) A `Data` object containing collected `source` values and corresponding timestamps over the allowed time range.
method valueAtTime(data, timestamp)
(Overload 1 of 2) Retrieves value and time data from a `Data` object's fields at the index of the earliest timestamp closest to the specified `timestamp`. Callable as a method or a function.
Parameters:
data (series Data) : The `Data` object containing the collected time and value data.
timestamp (series int) : The millisecond UNIX timestamp to search. The function returns data for the earliest saved timestamp that is closest to the value.
Returns: ( ) A tuple containing the following data from the `Data` object:
- The stored value corresponding to the identified timestamp ("float").
- The earliest saved timestamp that is closest to the specified `timestamp` ("int").
valueAtTime(source, timestamp, timeOffsetLimit, timeframeLimit)
(Overload 2 of 2) Retrieves `source` and time information for the earliest bar whose opening timestamp is closest to the specified `timestamp`. Any call to this function cannot execute more than once per bar or realtime tick.
Parameters:
source (series float) : The source series to analyze. The function stores each value in the series with an associated timestamp representing its corresponding bar's opening time.
timestamp (series int) : The millisecond UNIX timestamp to search. The function returns data for the earliest bar whose timestamp is closest to the value.
timeOffsetLimit (simple int) : Optional. A time offset (range) in milliseconds. If specified, the function limits the collected data to the maximum number of bars covered by the range, with a minimum of one bar. If the call includes a non-empty `timeframeLimit` value, the function limits the data using the largest number of bars covered by the two ranges. The default is `na`.
timeframeLimit (simple string) : (simple string) Optional. A valid timeframe string. If specified and not empty, the function limits the collected data to the maximum number of bars covered by the timeframe, with a minimum of one bar. If the call includes a non-na `timeOffsetLimit` value, the function limits the data using the largest number of bars covered by the two ranges. The default is `na`.
Returns: ( ) A tuple containing the following data:
- The `source` value corresponding to the identified timestamp ("float").
- The earliest bar's timestamp that is closest to the specified `timestamp` ("int").
- The current bar's `source` value ("float").
method valueAtTimeOffset(data, timeOffset)
(Overload 1 of 2) Retrieves value and time data from a `Data` object's fields at the index of the earliest saved timestamp closest to `timeOffset` milliseconds behind the current bar's opening time. Callable as a method or a function.
Parameters:
data (series Data) : The `Data` object containing the collected time and value data.
timeOffset (series int) : The millisecond offset behind the bar's opening time. The function returns data for the earliest saved timestamp that is closest to the calculated offset time.
Returns: ( ) A tuple containing the following data from the `Data` object:
- The stored value corresponding to the identified timestamp ("float").
- The earliest saved timestamp that is closest to `timeOffset` milliseconds before the current bar's opening time ("int").
valueAtTimeOffset(source, timeOffset, timeOffsetLimit, timeframeLimit)
(Overload 2 of 2) Retrieves `source` and time information for the earliest bar whose opening timestamp is closest to `timeOffset` milliseconds behind the current bar's opening time. Any call to this function cannot execute more than once per bar or realtime tick.
Parameters:
source (series float) : The source series to analyze. The function stores each value in the series with an associated timestamp representing its corresponding bar's opening time.
timeOffset (series int) : The millisecond offset behind the bar's opening time. The function returns data for the earliest bar's timestamp that is closest to the calculated offset time.
timeOffsetLimit (simple int) : Optional. A time offset (range) in milliseconds. If specified, the function limits the collected data to the maximum number of bars covered by the range, with a minimum of one bar. If the call includes a non-empty `timeframeLimit` value, the function limits the data using the largest number of bars covered by the two ranges. The default is `na`.
timeframeLimit (simple string) : Optional. A valid timeframe string. If specified and not empty, the function limits the collected data to the maximum number of bars covered by the timeframe, with a minimum of one bar. If the call includes a non-na `timeOffsetLimit` value, the function limits the data using the largest number of bars covered by the two ranges. The default is `na`.
Returns: ( ) A tuple containing the following data:
- The `source` value corresponding to the identified timestamp ("float").
- The earliest bar's timestamp that is closest to `timeOffset` milliseconds before the current bar's opening time ("int").
- The current bar's `source` value ("float").
method valueAtPeriodOffset(data, period)
(Overload 1 of 2) Retrieves value and time data from a `Data` object's fields at the index of the earliest timestamp closest to a calculated offset behind the current bar's opening time. The calculated offset represents the amount of time covered by the specified `period`. Callable as a method or a function.
Parameters:
data (series Data) : The `Data` object containing the collected time and value data.
period (series string) : The period string, which determines the calculated time offset. The specified argument must contain a unit and an optional multiplier (e.g., "1Y", "3M", "2W", "YTD"). Supported units are:
- "Y" for years.
- "M" for months.
- "W" for weeks.
- "D" for days.
- "YTD" (Year-to-date) for the span from the start of the current bar's year in the exchange time zone. An argument with this unit cannot contain a multiplier.
Returns: ( ) A tuple containing the following data from the `Data` object:
- The stored value corresponding to the identified timestamp ("float").
- The earliest saved timestamp that is closest to the calculated offset behind the bar's opening time ("int").
valueAtPeriodOffset(source, period, timeOffsetLimit, timeframeLimit)
(Overload 2 of 2) Retrieves `source` and time information for the earliest bar whose opening timestamp is closest to a calculated offset behind the current bar's opening time. The calculated offset represents the amount of time covered by the specified `period`. Any call to this function cannot execute more than once per bar or realtime tick.
Parameters:
source (series float) : The source series to analyze. The function stores each value in the series with an associated timestamp representing its corresponding bar's opening time.
period (series string) : The period string, which determines the calculated time offset. The specified argument must contain a unit and an optional multiplier (e.g., "1Y", "3M", "2W", "YTD"). Supported units are:
- "Y" for years.
- "M" for months.
- "W" for weeks.
- "D" for days.
- "YTD" (Year-to-date) for the span from the start of the current bar's year in the exchange time zone. An argument with this unit cannot contain a multiplier.
timeOffsetLimit (simple int) : Optional. A time offset (range) in milliseconds. If specified, the function limits the collected data to the maximum number of bars covered by the range, with a minimum of one bar. If the call includes a non-empty `timeframeLimit` value, the function limits the data using the largest number of bars covered by the two ranges. The default is `na`.
timeframeLimit (simple string) : Optional. A valid timeframe string. If specified and not empty, the function limits the collected data to the maximum number of bars covered by the timeframe, with a minimum of one bar. If the call includes a non-na `timeOffsetLimit` value, the function limits the data using the largest number of bars covered by the two ranges. The default is `na`.
Returns: ( ) A tuple containing the following data:
- The `source` value corresponding to the identified timestamp ("float").
- The earliest bar's timestamp that is closest to the calculated offset behind the current bar's opening time ("int").
- The current bar's `source` value ("float").
getDataAtTimes(timestamps, source, timeOffsetLimit, timeframeLimit)
Retrieves `source` and time information for each bar whose opening timestamp is the earliest one closest to one of the UNIX timestamps specified in the `timestamps` array. Any call to this function cannot execute more than once per bar or realtime tick.
Parameters:
timestamps (array) : An array of "int" values representing UNIX timestamps. The function retrieves `source` and time data for each element in this array.
source (series float) : The source series to analyze. The function stores each value in the series with an associated timestamp representing its corresponding bar's opening time.
timeOffsetLimit (simple int) : Optional. A time offset (range) in milliseconds. If specified, the function limits the collected data to the maximum number of bars covered by the range, with a minimum of one bar. If the call includes a non-empty `timeframeLimit` value, the function limits the data using the largest number of bars covered by the two ranges. The default is `na`.
timeframeLimit (simple string) : Optional. A valid timeframe string. If specified and not empty, the function limits the collected data to the maximum number of bars covered by the timeframe, with a minimum of one bar. If the call includes a non-na `timeOffsetLimit` value, the function limits the data using the largest number of bars covered by the two ranges. The default is `na`.
Returns: ( ) A tuple of the following data:
- An array containing a `source` value for each identified timestamp (array).
- An array containing an identified timestamp for each item in the `timestamps` array (array).
- The current bar's `source` value ("float").
- The symbol's description from `syminfo.description` ("string").
getDataAtTimeOffsets(timeOffsets, source, timeOffsetLimit, timeframeLimit)
Retrieves `source` and time information for each bar whose opening timestamp is the earliest one closest to one of the time offsets specified in the `timeOffsets` array. Each offset in the array represents the absolute number of milliseconds behind the current bar's opening time. Any call to this function cannot execute more than once per bar or realtime tick.
Parameters:
timeOffsets (array) : An array of "int" values representing the millisecond time offsets used in the search. The function retrieves `source` and time data for each element in this array. For example, the array ` ` specifies that the function returns data for the timestamps closest to one day and one week behind the current bar's opening time.
source (float) : (series float) The source series to analyze. The function stores each value in the series with an associated timestamp representing its corresponding bar's opening time.
timeOffsetLimit (simple int) : Optional. A time offset (range) in milliseconds. If specified, the function limits the collected data to the maximum number of bars covered by the range, with a minimum of one bar. If the call includes a non-empty `timeframeLimit` value, the function limits the data using the largest number of bars covered by the two ranges. The default is `na`.
timeframeLimit (simple string) : Optional. A valid timeframe string. If specified and not empty, the function limits the collected data to the maximum number of bars covered by the timeframe, with a minimum of one bar. If the call includes a non-na `timeOffsetLimit` value, the function limits the data using the largest number of bars covered by the two ranges. The default is `na`.
Returns: ( ) A tuple of the following data:
- An array containing a `source` value for each identified timestamp (array).
- An array containing an identified timestamp for each offset specified in the `timeOffsets` array (array).
- The current bar's `source` value ("float").
- The symbol's description from `syminfo.description` ("string").
getDataAtPeriodOffsets(periods, source, timeOffsetLimit, timeframeLimit)
Retrieves `source` and time information for each bar whose opening timestamp is the earliest one closest to a calculated offset behind the current bar's opening time. Each calculated offset represents the amount of time covered by a period specified in the `periods` array. Any call to this function cannot execute more than once per bar or realtime tick.
Parameters:
periods (array) : An array of period strings, which determines the time offsets used in the search. The function retrieves `source` and time data for each element in this array. For example, the array ` ` specifies that the function returns data for the timestamps closest to one day, week, and month behind the current bar's opening time. Each "string" in the array must contain a unit and an optional multiplier. Supported units are:
- "Y" for years.
- "M" for months.
- "W" for weeks.
- "D" for days.
- "YTD" (Year-to-date) for the span from the start of the current bar's year in the exchange time zone. An argument with this unit cannot contain a multiplier.
source (float) : (series float) The source series to analyze. The function stores each value in the series with an associated timestamp representing its corresponding bar's opening time.
timeOffsetLimit (simple int) : Optional. A time offset (range) in milliseconds. If specified, the function limits the collected data to the maximum number of bars covered by the range, with a minimum of one bar. If the call includes a non-empty `timeframeLimit` value, the function limits the data using the largest number of bars covered by the two ranges. The default is `na`.
timeframeLimit (simple string) : Optional. A valid timeframe string. If specified and not empty, the function limits the collected data to the maximum number of bars covered by the timeframe, with a minimum of one bar. If the call includes a non-na `timeOffsetLimit` value, the function limits the data using the largest number of bars covered by the two ranges. The default is `na`.
Returns: ( ) A tuple of the following data:
- An array containing a `source` value for each identified timestamp (array).
- An array containing an identified timestamp for each period specified in the `periods` array (array).
- The current bar's `source` value ("float").
- The symbol's description from `syminfo.description` ("string").
Pine Script®库

RSMPatternLibLibrary "RSMPatternLib"
RSM Pattern Library - All chart patterns from PATTERNS.md
Implements: Candlestick patterns, Support/Resistance, Gaps, Triangles, Volume Divergence, and more
ALL PATTERNS ARE OWN IMPLEMENTATION - No external dependencies
EDGE CASES HANDLED:
- Zero/tiny candle bodies
- Missing volume data
- Low bar count scenarios
- Integer division issues
- Price normalization for different instruments
bullishEngulfing(minBodyRatio, minPrevBodyRatio)
Detects Bullish Engulfing pattern
Parameters:
minBodyRatio (float) : Minimum body size as ratio of total range (default 0.3)
minPrevBodyRatio (float) : Minimum previous candle body ratio to filter dojis (default 0.1)
Returns: bool True when bullish engulfing detected
EDGE CASES: Handles doji previous candle, zero range, tiny bodies
bearishEngulfing(minBodyRatio, minPrevBodyRatio)
Detects Bearish Engulfing pattern
Parameters:
minBodyRatio (float) : Minimum body size as ratio of total range (default 0.3)
minPrevBodyRatio (float) : Minimum previous candle body ratio to filter dojis (default 0.1)
Returns: bool True when bearish engulfing detected
EDGE CASES: Handles doji previous candle, zero range, tiny bodies
doji(maxBodyRatio, minRangeAtr)
Detects Doji candle (indecision)
Parameters:
maxBodyRatio (float) : Maximum body size as ratio of total range (default 0.1)
minRangeAtr (float) : Minimum range as multiple of ATR to filter flat candles (default 0.3)
Returns: bool True when doji detected
EDGE CASES: Filters out no-movement bars, handles zero range
shootingStar(wickMultiplier, maxLowerWickRatio, minBodyAtrRatio)
Detects Shooting Star (bearish reversal)
Parameters:
wickMultiplier (float) : Upper wick must be at least this times the body (default 2.0)
maxLowerWickRatio (float) : Lower wick max as ratio of body (default 0.5)
minBodyAtrRatio (float) : Minimum body size as ratio of ATR (default 0.1)
Returns: bool True when shooting star detected
EDGE CASES: Handles zero body (uses range-based check), tiny bodies
hammer(wickMultiplier, maxUpperWickRatio, minBodyAtrRatio)
Detects Hammer (bullish reversal)
Parameters:
wickMultiplier (float) : Lower wick must be at least this times the body (default 2.0)
maxUpperWickRatio (float) : Upper wick max as ratio of body (default 0.5)
minBodyAtrRatio (float) : Minimum body size as ratio of ATR (default 0.1)
Returns: bool True when hammer detected
EDGE CASES: Handles zero body (uses range-based check), tiny bodies
invertedHammer(wickMultiplier, maxLowerWickRatio)
Detects Inverted Hammer (bullish reversal after downtrend)
Parameters:
wickMultiplier (float) : Upper wick must be at least this times the body (default 2.0)
maxLowerWickRatio (float) : Lower wick max as ratio of body (default 0.5)
Returns: bool True when inverted hammer detected
EDGE CASES: Same as shootingStar but requires bullish close
hangingMan(wickMultiplier, maxUpperWickRatio)
Detects Hanging Man (bearish reversal after uptrend)
Parameters:
wickMultiplier (float) : Lower wick must be at least this times the body (default 2.0)
maxUpperWickRatio (float) : Upper wick max as ratio of body (default 0.5)
Returns: bool True when hanging man detected
NOTE: Identical to hammer - context (uptrend) determines meaning
morningStar(requireGap, minAvgBars)
Detects Morning Star (3-candle bullish reversal)
Parameters:
requireGap (bool) : Whether to require gap between candles (default false for crypto/forex)
minAvgBars (int) : Minimum bars for average body calculation (default 14)
Returns: bool True when morning star pattern detected
EDGE CASES: Gap is optional, handles low bar count, uses shifted average
eveningStar(requireGap, minAvgBars)
Detects Evening Star (3-candle bearish reversal)
Parameters:
requireGap (bool) : Whether to require gap between candles (default false for crypto/forex)
minAvgBars (int) : Minimum bars for average body calculation (default 14)
Returns: bool True when evening star pattern detected
EDGE CASES: Gap is optional, handles low bar count
gapUp()
Detects Gap Up
Returns: bool True when current bar opens above previous bar's high
gapDown()
Detects Gap Down
Returns: bool True when current bar opens below previous bar's low
gapSize()
Returns gap size in price
Returns: float Gap size (positive for gap up, negative for gap down, 0 for no gap)
gapPercent()
Returns gap size as percentage
Returns: float Gap size as percentage of previous close
gapType(volAvgLen, breakawayMinPct, highVolMult)
Classifies gap type based on volume
Parameters:
volAvgLen (int) : Length for volume average (default 20)
breakawayMinPct (float) : Minimum gap % for breakaway (default 1.0)
highVolMult (float) : Volume multiplier for high volume (default 1.5)
Returns: string Gap type: "Breakaway", "Common", "Continuation", or "None"
EDGE CASES: Handles missing volume data, low bar count
swingHigh(leftBars, rightBars)
Detects swing high using pivot
Parameters:
leftBars (int) : Bars to left for pivot (default 5)
rightBars (int) : Bars to right for pivot (default 5)
Returns: float Swing high price or na
swingLow(leftBars, rightBars)
Detects swing low using pivot
Parameters:
leftBars (int) : Bars to left for pivot (default 5)
rightBars (int) : Bars to right for pivot (default 5)
Returns: float Swing low price or na
higherHigh(leftBars, rightBars, lookback)
Checks if current swing high is higher than previous swing high
Parameters:
leftBars (int) : Bars to left for pivot (default 5)
rightBars (int) : Bars to right for pivot (default 5)
lookback (int) : How many bars back to search for previous pivot (default 50)
Returns: bool True when higher high pattern detected
EDGE CASES: Searches backwards for pivots instead of using var (library-safe)
higherLow(leftBars, rightBars, lookback)
Checks if current swing low is higher than previous swing low
Parameters:
leftBars (int) : Bars to left for pivot (default 5)
rightBars (int) : Bars to right for pivot (default 5)
lookback (int) : How many bars back to search for previous pivot (default 50)
Returns: bool True when higher low pattern detected
lowerHigh(leftBars, rightBars, lookback)
Checks if current swing high is lower than previous swing high
Parameters:
leftBars (int) : Bars to left for pivot (default 5)
rightBars (int) : Bars to right for pivot (default 5)
lookback (int) : How many bars back to search for previous pivot (default 50)
Returns: bool True when lower high pattern detected
lowerLow(leftBars, rightBars, lookback)
Checks if current swing low is lower than previous swing low
Parameters:
leftBars (int) : Bars to left for pivot (default 5)
rightBars (int) : Bars to right for pivot (default 5)
lookback (int) : How many bars back to search for previous pivot (default 50)
Returns: bool True when lower low pattern detected
bullishTrend(leftBars, rightBars, lookback)
Detects Bullish Trend (HH + HL within lookback)
Parameters:
leftBars (int) : Bars to left for pivot (default 5)
rightBars (int) : Bars to right for pivot (default 5)
lookback (int) : Lookback period (default 50)
Returns: bool True when making higher highs AND higher lows
bearishTrend(leftBars, rightBars, lookback)
Detects Bearish Trend (LH + LL within lookback)
Parameters:
leftBars (int) : Bars to left for pivot (default 5)
rightBars (int) : Bars to right for pivot (default 5)
lookback (int) : Lookback period (default 50)
Returns: bool True when making lower highs AND lower lows
nearestResistance(lookback, leftBars, rightBars)
Finds nearest resistance level above current price
Parameters:
lookback (int) : Number of bars to look back (default 50)
leftBars (int) : Pivot left bars (default 5)
rightBars (int) : Pivot right bars (default 5)
Returns: float Nearest resistance level or na
EDGE CASES: Pre-computes pivots, handles bounds properly
nearestSupport(lookback, leftBars, rightBars)
Finds nearest support level below current price
Parameters:
lookback (int) : Number of bars to look back (default 50)
leftBars (int) : Pivot left bars (default 5)
rightBars (int) : Pivot right bars (default 5)
Returns: float Nearest support level or na
resistanceBreakout(lookback, leftBars, rightBars)
Detects resistance breakout
Parameters:
lookback (int) : Number of bars to look back (default 50)
leftBars (int) : Pivot left bars (default 5)
rightBars (int) : Pivot right bars (default 5)
Returns: bool True when price breaks above resistance
EDGE CASES: Uses previous bar's resistance to avoid lookahead
supportBreakdown(lookback, leftBars, rightBars)
Detects support breakdown
Parameters:
lookback (int) : Number of bars to look back (default 50)
leftBars (int) : Pivot left bars (default 5)
rightBars (int) : Pivot right bars (default 5)
Returns: bool True when price breaks below support
bullishVolumeDivergence(leftBars, rightBars, lookback)
Detects Bullish Volume Divergence (price makes lower low, volume decreases)
Parameters:
leftBars (int) : Pivot left bars (default 5)
rightBars (int) : Pivot right bars (default 5)
lookback (int) : Bars to search for previous pivot (default 50)
Returns: bool True when bullish volume divergence detected
EDGE CASES: Library-safe (no var), searches for previous pivot
bearishVolumeDivergence(leftBars, rightBars, lookback)
Detects Bearish Volume Divergence (price makes higher high, volume decreases)
Parameters:
leftBars (int) : Pivot left bars (default 5)
rightBars (int) : Pivot right bars (default 5)
lookback (int) : Bars to search for previous pivot (default 50)
Returns: bool True when bearish volume divergence detected
rangeContracting(lookback)
Detects if price is in a contracting range (triangle formation)
Parameters:
lookback (int) : Bars to analyze (default 20)
Returns: bool True when range is contracting
EDGE CASES: Uses safe integer division, checks minimum lookback
ascendingTriangle(lookback, flatTolerance)
Detects Ascending Triangle (flat top, rising bottom)
Parameters:
lookback (int) : Bars to analyze (default 20)
flatTolerance (float) : Max normalized slope for "flat" line (default 0.002)
Returns: bool True when ascending triangle detected
EDGE CASES: Safe division, normalized slope, minimum lookback
descendingTriangle(lookback, flatTolerance)
Detects Descending Triangle (falling top, flat bottom)
Parameters:
lookback (int) : Bars to analyze (default 20)
flatTolerance (float) : Max normalized slope for "flat" line (default 0.002)
Returns: bool True when descending triangle detected
symmetricalTriangle(lookback, minSlope)
Detects Symmetrical Triangle (converging trend lines)
Parameters:
lookback (int) : Bars to analyze (default 20)
minSlope (float) : Minimum normalized slope magnitude (default 0.0005)
Returns: bool True when symmetrical triangle detected
doubleBottom(tolerance, minSpanBars, lookback)
Detects Double Bottom (W pattern) - OWN IMPLEMENTATION
Two swing lows at similar price levels with a swing high between them
Parameters:
tolerance (float) : Max price difference between lows as % (default 3)
minSpanBars (int) : Minimum bars between the two lows (default 5)
lookback (int) : Max bars to search for pattern (default 100)
Returns: bool True when double bottom detected
doubleTop(tolerance, minSpanBars, lookback)
Detects Double Top (M pattern) - OWN IMPLEMENTATION
Two swing highs at similar price levels with a swing low between them
Parameters:
tolerance (float) : Max price difference between highs as % (default 3)
minSpanBars (int) : Minimum bars between the two highs (default 5)
lookback (int) : Max bars to search for pattern (default 100)
Returns: bool True when double top detected
tripleBottom(tolerance, minSpanBars, lookback)
Detects Triple Bottom - OWN IMPLEMENTATION
Three swing lows at similar price levels
Parameters:
tolerance (float) : Max price difference between lows as % (default 3)
minSpanBars (int) : Minimum total bars for pattern (default 10)
lookback (int) : Max bars to search for pattern (default 150)
Returns: bool True when triple bottom detected
tripleTop(tolerance, minSpanBars, lookback)
Detects Triple Top - OWN IMPLEMENTATION
Three swing highs at similar price levels
Parameters:
tolerance (float) : Max price difference between highs as % (default 3)
minSpanBars (int) : Minimum total bars for pattern (default 10)
lookback (int) : Max bars to search for pattern (default 150)
Returns: bool True when triple top detected
bearHeadShoulders()
Detects Bearish Head and Shoulders (OWN IMPLEMENTATION)
Head is higher than both shoulders, shoulders roughly equal, with valid neckline
STRICT VERSION - requires proper structure, neckline, and minimum span
Returns: bool True when bearish H&S detected
bullHeadShoulders()
Detects Bullish (Inverse) Head and Shoulders (OWN IMPLEMENTATION)
Head is lower than both shoulders, shoulders roughly equal, with valid neckline
STRICT VERSION - requires proper structure, neckline, and minimum span
Returns: bool True when bullish H&S detected
bearAscHeadShoulders()
Detects Bearish Ascending Head and Shoulders (variant)
Returns: bool True when pattern detected
bullAscHeadShoulders()
Detects Bullish Ascending Head and Shoulders (variant)
Returns: bool True when pattern detected
bearDescHeadShoulders()
Detects Bearish Descending Head and Shoulders (variant)
Returns: bool True when pattern detected
bullDescHeadShoulders()
Detects Bullish Descending Head and Shoulders (variant)
Returns: bool True when pattern detected
isSwingLow()
Re-export: Detects swing low
Returns: bool True when swing low detected
isSwingHigh()
Re-export: Detects swing high
Returns: bool True when swing high detected
swingHighPrice(idx)
Re-export: Gets swing high price at index
Parameters:
idx (int) : Index (0 = most recent)
Returns: float Swing high price
swingLowPrice(idx)
Re-export: Gets swing low price at index
Parameters:
idx (int) : Index (0 = most recent)
Returns: float Swing low price
swingHighBarIndex(idx)
Re-export: Gets swing high bar index
Parameters:
idx (int) : Index (0 = most recent)
Returns: int Bar index of swing high
swingLowBarIndex(idx)
Re-export: Gets swing low bar index
Parameters:
idx (int) : Index (0 = most recent)
Returns: int Bar index of swing low
cupBottom(smoothLen, minDepthAtr, maxDepthAtr)
Detects Cup and Handle pattern formation
Uses price acceleration and depth analysis
Parameters:
smoothLen (int) : Smoothing length for price (default 10)
minDepthAtr (float) : Minimum cup depth as ATR multiple (default 1.0)
maxDepthAtr (float) : Maximum cup depth as ATR multiple (default 5.0)
Returns: bool True when potential cup bottom detected
EDGE CASES: Added depth filter, ATR validation
cupHandle(lookback, maxHandleRetraceRatio)
Detects potential handle formation after cup
Parameters:
lookback (int) : Bars to look back for cup (default 30)
maxHandleRetraceRatio (float) : Maximum handle retracement of cup depth (default 0.5)
Returns: bool True when handle pattern detected
bullishPatternCount()
Returns count of bullish patterns detected
Returns: int Number of bullish patterns currently active
bearishPatternCount()
Returns count of bearish patterns detected
Returns: int Number of bearish patterns currently active
detectedPatterns()
Returns string description of detected patterns
Returns: string Comma-separated list of detected patterns
Pine Script®库

BarCoreLibrary "BarCore"
BarCore is a foundational library for technical analysis, providing essential functions for evaluating the structural properties of candlesticks and inter-bar relationships.
It prioritizes ratio-based metrics (0.0 to 1.0) over absolute prices, making it asset-agnostic and ideal for robust pattern recognition, momentum analysis, and volume-weighted pressure evaluation.
Key modules:
- Structure & Range: High-precision bar and body metrics with relative positioning.
- Wick Dynamics: Absolute and relative wick analysis for identifying price rejection.
- Inter-bar Logic: Containment, coverage, and quantitative price overlap (Ratio-based).
- Gap Intelligence: Real body and price gaps with customizable significance thresholds.
- Flow & Pressure: Volume-weighted buying/selling pressure and Money Flow metrics.
isBuyingBar()
Checks if the bar is a bullish (up) bar, where close is greater than open.
Returns: bool True if the bar closed higher than it opened.
isSellingBar()
Checks if the bar is a bearish (down) bar, where close is less than open.
Returns: bool True if the bar closed lower than it opened.
barMidpoint()
Calculates the absolute midpoint of the bar's total range (High + Low) / 2.
Returns: float The midpoint price of the bar.
barRange()
Calculates the absolute size of the bar's total range (High to Low).
Returns: float The absolute difference between high and low.
barRangeMidpoint()
Calculates half of the bar's total range size.
Returns: float Half the bar's range size.
realBodyHigh()
Returns the higher price between the open and close.
Returns: float The top of the real body.
realBodyLow()
Returns the lower price between the open and close.
Returns: float The bottom of the real body.
realBodyMidpoint()
Calculates the absolute midpoint of the bar's real body.
Returns: float The midpoint price of the real body.
realBodyRange()
Calculates the absolute size of the bar's real body.
Returns: float The absolute difference between open and close.
realBodyRangeMidpoint()
Calculates half of the bar's real body size.
Returns: float Half the real body size.
upperWickRange()
Calculates the absolute size of the upper wick.
Returns: float The range from high to the real body high.
lowerWickRange()
Calculates the absolute size of the lower wick.
Returns: float The range from the real body low to low.
openRatio()
Returns the location of the open price relative to the bar's total range (0.0 at low to 1.0 at high).
Returns: float The ratio of the distance from low to open, divided by the total range.
closeRatio()
Returns the location of the close price relative to the bar's total range (0.0 at low to 1.0 at high).
Returns: float The ratio of the distance from low to close, divided by the total range.
realBodyRatio()
Calculates the ratio of the real body size to the total bar range.
Returns: float The real body size divided by the bar range. Returns 0 if barRange is 0.
upperWickRatio()
Calculates the ratio of the upper wick size to the total bar range.
Returns: float The upper wick size divided by the bar range. Returns 0 if barRange is 0.
lowerWickRatio()
Calculates the ratio of the lower wick size to the total bar range.
Returns: float The lower wick size divided by the bar range. Returns 0 if barRange is 0.
upperWickToBodyRatio()
Calculates the ratio of the upper wick size to the real body size.
Returns: float The upper wick size divided by the real body size. Returns 0 if realBodyRange is 0.
lowerWickToBodyRatio()
Calculates the ratio of the lower wick size to the real body size.
Returns: float The lower wick size divided by the real body size. Returns 0 if realBodyRange is 0.
totalWickRatio()
Calculates the ratio of the total wick range (Upper Wick + Lower Wick) to the total bar range.
Returns: float The total wick range expressed as a ratio of the bar's total range. Returns 0 if barRange is 0.
isBodyExpansion()
Checks if the current bar's real body range is larger than the previous bar's real body range (body expansion).
Returns: bool True if realBodyRange() > realBodyRange() .
isBodyContraction()
Checks if the current bar's real body range is smaller than the previous bar's real body range (body contraction).
Returns: bool True if realBodyRange() < realBodyRange() .
isWithinPrevBar(inclusive)
Checks if the current bar's range is entirely within the previous bar's range.
Parameters:
inclusive (bool) : If true, allows equality (<=, >=). Default is false.
Returns: bool True if High < High AND Low > Low .
isCoveringPrevBar(inclusive)
Checks if the current bar's range fully covers the entire previous bar's range.
Parameters:
inclusive (bool) : If true, allows equality (<=, >=). Default is false.
Returns: bool True if High > High AND Low < Low .
isWithinPrevBody(inclusive)
Checks if the current bar's real body is entirely inside the previous bar's real body.
Parameters:
inclusive (bool) : If true, allows equality (<=, >=). Default is false.
Returns: bool True if the current body is contained inside the previous body.
isCoveringPrevBody(inclusive)
Checks if the current bar's real body fully covers the previous bar's real body.
Parameters:
inclusive (bool) : If true, allows equality (<=, >=). Default is false.
Returns: bool True if the current body fully covers the previous body.
isOpenWithinPrevBody(inclusive)
Checks if the current bar's open price falls within the real body range of the previous bar.
Parameters:
inclusive (bool) : If true, includes the boundary prices. Default is false.
Returns: bool True if the open price is between the previous bar's real body high and real body low.
isCloseWithinPrevBody(inclusive)
Checks if the current bar's close price falls within the real body range of the previous bar.
Parameters:
inclusive (bool) : If true, includes the boundary prices. Default is false.
Returns: bool True if the close price is between the previous bar's real body high and real body low.
isPrevOpenWithinBody(inclusive)
Checks if the previous bar's open price falls within the current bar's real body range.
Parameters:
inclusive (bool) : If true, includes the boundary prices. Default is false.
Returns: bool True if open is between the current bar's real body high and real body low.
isPrevCloseWithinBody(inclusive)
Checks if the previous bar's closing price falls within the current bar's real body range.
Parameters:
inclusive (bool) : If true, includes the boundary prices. Default is false.
Returns: bool True if close is between the current bar's real body high and real body low.
isOverlappingPrevBar()
Checks if there is any price overlap between the current bar's range and the previous bar's range.
Returns: bool True if the current bar's range has any intersection with the previous bar's range.
bodyOverlapRatio()
Calculates the percentage of the current real body that overlaps with the previous real body.
Returns: float The overlap ratio (0.0 to 1.0). 1.0 means the current body is entirely within the previous body's price range.
isCompletePriceGapUp()
Checks for a complete price gap up where the current bar's low is strictly above the previous bar's high, meaning there is zero price overlap between the two bars.
Returns: bool True if the current low is greater than the previous high.
isCompletePriceGapDown()
Checks for a complete price gap down where the current bar's high is strictly below the previous bar's low, meaning there is zero price overlap between the two bars.
Returns: bool True if the current high is less than the previous low.
isRealBodyGapUp()
Checks for a gap between the current and previous real bodies.
Returns: bool True if the current body is completely above the previous body.
isRealBodyGapDown()
Checks for a gap between the current and previous real bodies.
Returns: bool True if the current body is completely below the previous body.
gapRatio()
Calculates the percentage difference between the current open and the previous close, expressed as a decimal ratio.
Returns: float The gap ratio (positive for gap up, negative for gap down). Returns 0 if the previous close is 0.
gapPercentage()
Calculates the percentage difference between the current open and the previous close.
Returns: float The gap percentage (positive for gap up, negative for gap down). Returns 0 if previous close is 0.
isGapUp()
Checks for a basic gap up, where the current bar's open is strictly higher than the previous bar's close. This is the minimum condition for a gap up.
Returns: bool True if the current open is greater than the previous close (i.e., gapRatio is positive).
isGapDown()
Checks for a basic gap down, where the current bar's open is strictly lower than the previous bar's close. This is the minimum condition for a gap down.
Returns: bool True if the current open is less than the previous close (i.e., gapRatio is negative).
isSignificantGapUp(minRatio)
Checks if the current bar opened significantly higher than the previous close, as defined by a minimum percentage ratio.
Parameters:
minRatio (float) : The minimum required gap percentage ratio. Default is 0.03 (3%).
Returns: bool True if the gap ratio (open vs. previous close) is greater than or equal to the minimum ratio.
isSignificantGapDown(minRatio)
Checks if the current bar opened significantly lower than the previous close, as defined by a minimum percentage ratio.
Parameters:
minRatio (float) : The minimum required gap percentage ratio. Default is 0.03 (3%).
Returns: bool True if the absolute value of the gap ratio (open vs. previous close) is greater than or equal to the minimum ratio.
trueRangeComponentHigh()
Calculates the absolute distance from the current bar's High to the previous bar's Close, representing one of the components of the True Range.
Returns: float The absolute difference: |High - Close |.
trueRangeComponentLow()
Calculates the absolute distance from the current bar's Low to the previous bar's Close, representing one of the components of the True Range.
Returns: float The absolute difference: |Low - Close |.
isUpperWickDominant(minRatio)
Checks if the upper wick is significantly long relative to the total range.
Parameters:
minRatio (float) : Minimum ratio of the wick to the total bar range. Default is 0.7 (70%).
Returns: bool True if the upper wick dominates the bar's range.
isUpperWickNegligible(maxRatio)
Checks if the upper wick is very small relative to the total range.
Parameters:
maxRatio (float) : Maximum ratio of the wick to the total bar range. Default is 0.05 (5%).
Returns: bool True if the upper wick is negligible.
isLowerWickDominant(minRatio)
Checks if the lower wick is significantly long relative to the total range.
Parameters:
minRatio (float) : Minimum ratio of the wick to the total bar range. Default is 0.7 (70%).
Returns: bool True if the lower wick dominates the bar's range.
isLowerWickNegligible(maxRatio)
Checks if the lower wick is very small relative to the total range.
Parameters:
maxRatio (float) : Maximum ratio of the wick to the total bar range. Default is 0.05 (5%).
Returns: bool True if the lower wick is negligible.
isSymmetric(maxTolerance)
Checks if the upper and lower wicks are roughly equal in length.
Parameters:
maxTolerance (float) : Maximum allowable percentage difference between the two wicks. Default is 0.15 (15%).
Returns: bool True if wicks are symmetric within the tolerance level.
isMarubozuBody(minRatio)
Candle with a very large body relative to the total range (minimal wicks).
Parameters:
minRatio (float) : Minimum body size ratio. Default is 0.9 (90%).
Returns: bool True if the bar has minimal wicks (Marubozu body).
isLargeBody(minRatio)
Candle with a large body relative to the total range.
Parameters:
minRatio (float) : Minimum body size ratio. Default is 0.6 (60%).
Returns: bool True if the bar has a large body.
isSmallBody(maxRatio)
Candle with a small body relative to the total range.
Parameters:
maxRatio (float) : Maximum body size ratio. Default is 0.4 (40%).
Returns: bool True if the bar has small body.
isDojiBody(maxRatio)
Candle with a very small body relative to the total range (indecision).
Parameters:
maxRatio (float) : Maximum body size ratio. Default is 0.1 (10%).
Returns: bool True if the bar has a very small body.
isLowerWickExtended(minRatio)
Checks if the lower wick is significantly extended relative to the real body size.
Parameters:
minRatio (float) : Minimum required ratio of the lower wick length to the real body size. Default is 2.0 (Lower wick must be at least twice the body's size).
Returns: bool True if the lower wick's length is at least `minRatio` times the size of the real body.
isUpperWickExtended(minRatio)
Checks if the upper wick is significantly extended relative to the real body size.
Parameters:
minRatio (float) : Minimum required ratio of the upper wick length to the real body size. Default is 2.0 (Upper wick must be at least twice the body's size).
Returns: bool True if the upper wick's length is at least `minRatio` times the size of the real body.
isStrongBuyingBar(minCloseRatio, maxOpenRatio)
Checks for a bar with strong bullish momentum (open near low, close near high), indicating high conviction.
Parameters:
minCloseRatio (float) : Minimum required ratio for the close location (relative to range, e.g., 0.7 means close must be in the top 30%). Default is 0.7 (70%).
maxOpenRatio (float) : Maximum allowed ratio for the open location (relative to range, e.g., 0.3 means open must be in the bottom 30%). Default is 0.3 (30%).
Returns: bool True if the bar is bullish, opened in the low extreme, and closed in the high extreme.
isStrongSellingBar(maxCloseRatio, minOpenRatio)
Checks for a bar with strong bearish momentum (open near high, close near low), indicating high conviction.
Parameters:
maxCloseRatio (float) : Maximum allowed ratio for the close location (relative to range, e.g., 0.3 means close must be in the bottom 30%). Default is 0.3 (30%).
minOpenRatio (float) : Minimum required ratio for the open location (relative to range, e.g., 0.7 means open must be in the top 30%). Default is 0.7 (70%).
Returns: bool True if the bar is bearish, opened in the high extreme, and closed in the low extreme.
isWeakBuyingBar(maxCloseRatio, maxBodyRatio)
Identifies a bar that is technically bullish but shows significant weakness, characterized by a failure to close near the high and a small body size.
Parameters:
maxCloseRatio (float) : Maximum allowed ratio for the close location relative to the range (e.g., 0.6 means the close must be in the bottom 60% of the bar's range). Default is 0.6 (60%).
maxBodyRatio (float) : Maximum allowed ratio for the real body size relative to the bar's range (e.g., 0.4 means the body is small). Default is 0.4 (40%).
Returns: bool True if the bar is bullish, but its close is weak and its body is small.
isWeakSellingBar(minCloseRatio, maxBodyRatio)
Identifies a bar that is technically bearish but shows significant weakness, characterized by a failure to close near the low and a small body size.
Parameters:
minCloseRatio (float) : Minimum required ratio for the close location relative to the range (e.g., 0.4 means the close must be in the top 60% of the bar's range). Default is 0.4 (40%).
maxBodyRatio (float) : Maximum allowed ratio for the real body size relative to the bar's range (e.g., 0.4 means the body is small). Default is 0.4 (40%).
Returns: bool True if the bar is bearish, but its close is weak and its body is small.
balanceOfPower()
Measures the net pressure of buyers vs. sellers within the bar, normalized to the bar's range.
Returns: float A value between -1.0 (strong selling) and +1.0 (strong buying), representing the strength and direction of the close relative to the open.
buyingPressure()
Measures the net buying volume pressure based on the close location and volume.
Returns: float A numerical value representing the volume weighted buying pressure.
sellingPressure()
Measures the net selling volume pressure based on the close location and volume.
Returns: float A numerical value representing the volume weighted selling pressure.
moneyFlowMultiplier()
Calculates the Money Flow Multiplier (MFM), which is the price component of Money Flow and CMF.
Returns: float A normalized value from -1.0 (strong selling) to +1.0 (strong buying), representing the net directional pressure.
moneyFlowVolume()
Calculates the Money Flow Volume (MFV), which is the Money Flow Multiplier weighted by the bar's volume.
Returns: float A numerical value representing the volume-weighted money flow. Positive = buying dominance; negative = selling dominance.
isAccumulationBar()
Checks for basic accumulation on the current bar, requiring both positive Money Flow Volume and a buying bar (closing higher than opening).
Returns: bool True if the bar exhibits buying dominance through its internal range location and is a buying bar.
isDistributionBar()
Checks for basic distribution on the current bar, requiring both negative Money Flow Volume and a selling bar (closing lower than opening).
Returns: bool True if the bar exhibits selling dominance through its internal range location and is a selling bar.
Pine Script®库
