Machine Learning: Support and Resistance [YinYangAlgorithms]Overview:
Support and Resistance is normally based upon Pivot Points and Highest Highs and Lowest Lows. Many times coders even incorporate Volume, RSI and other factors into the equation. However there may be a downside to doing a pure technical approach based on historical levels. We live in a time where Machine Learning is becoming more and more used; thus we have decided to create a Machine Learning Support and Resistance Projection based Indicator. Rather than using traditional Support and Resistance calculations using historical data, we have taken a rather different approach. This Indicator instead attempts to Predict and Project where Support and Resistance locations will be based on a Machine Learning Model using a form of KNN (k-Nearest Neighbors).
Since this indicator creates a Projection of where it deems Support and Resistance will be, it has the ability to move its Support and Resistance before the price even gets to it if it believes it will surpass its projections. This may create a more accurate placement of Support and Resistance as they’re not based on historical levels.
This Indicator does not Repaint.
How it works:
This Indicator makes its projections based on the source you provide (by default close) of the previous bar and submits the source, RSI and EMA to our Projection Function to get its projection of the current bar.
The Projection function essentially calculates potential movement after finding the differences between the source the MA from the current bar, previous bar and average over the span of Machine Learning Length.
Potential movement is defined as:
Average Difference + Average(Machine Learning Average, Average Last Distance)
Average Difference: (Absolute value of Current Source - Current MA) - (Absolute value of Machine Learning Average - Machine Learning MA)
Average Last Distance: Average(Current Source - Current MA, Previous Source - Previous MA)
It then predicts the next bars directional movement (bullish or bearish bar) using several factors:
Previous Source > Previous MA
Current Source - Current MA > Average Source - Average MA
Current RSI > Previous RSI
Current RSI > 30 and Previous RSI <= 30
Current RSI < 70 and Previous RSI >= 70
This helps us to predict the direction the next bar may move.
We then calculate a multiplier that we apply to our Potential Movement value to get our final result which is our Current Bars Close Projection.
Our multiplier is calculated using:
(Current RSI > 30 and Previous RSI <= 30) OR (Current RSI < 70 and Previous RSI >= 70)
Current Source - Current MA > Previous Source - Previous MA
We then create an array and fill it with the previous X projections (Machine Learning Length) and send it to another function. This function, if told to, will sort the data accordingly and then output the KNN average of the length given.
We calculate and plot various KNN lengths to create different Zones:
Strong Support: Length of 2 but sort the data Ascending (low to high)
Strong Resistance: Length of 2 but sort the data Descending (high to low)
Support: Length of Machine Length Length / 10 or Min of 2 sorted by Ascending
Resistance: Length of Machine Length Length / 10 or Min of 2 sorted by Descending
There are also 4 other plots you may be wondering what they are, there is your AVG, VWMA, Long Term Memory and Current Projection.
By default your Current Projection is disabled in settings but you can enable it if you are curious to see how the projections for each close are calculated. It is, however, not a crucial point of interest (white line).
The average is simply the average value of the Machine Learning Data (purple line).
The VWMA is a VWMA calculation applied to our Data over a length specified in settings (by default 1)(blue line). The VWMA is crucial when combined with the Avg as they can cross over and under each other. These crosses represent potential Bullish and Bearish zones.
Lastly, but certainly not least, we have the Long Term Memory (maroon line). The Long Term Memory can be displayed either as an ‘Average’, ‘Hard Line’ or ‘None’. The Long Term Average is only updated every Machine Learning Length Bar Index’s and is populated with the average of the Machine Learning Data. For Instance, if Machine Learning Length is set to 100, the Long Term Memory is only updated every 100 bars, and since its length is the same as the Machine Learning Length, that means its data is composed of 10,000 bars worth of data. The Long Term Memory may be very beneficial for determining where Support and Resistance lie over the Long Term within a Machine Learning Algorithm. When set to ‘Average’ it plots the connection lines diagonally, and although they may be more visually appealing, they’re less useful when it comes to actually seeing support and resistance as generally speaking, support and resistance lie on the horizontal. When set to ‘Hard Line’ the Long Term Memory is connected with hard lines and holds the price value until the next time it is updated. This makes it much more useful for potentially identifying Support and Resistance.
Tutorial:
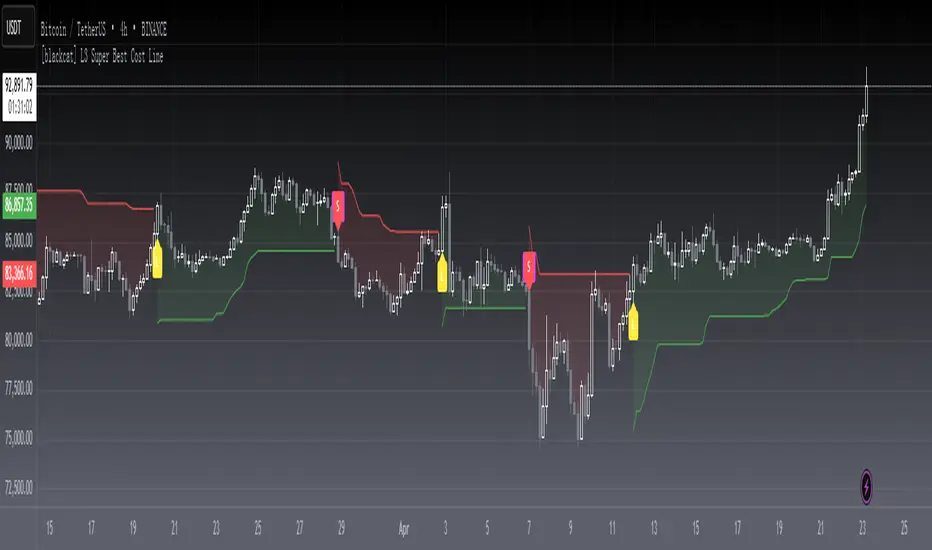
Here is an overview of what the Indicator looks like, now let's start to dissect it.
In the example above we can see how all of the lines between the Major Support and Resistance zones may act as BOTH Support and Resistance depending on which side the price is currently on. In the circle on the left, we can see how it can fluctuate between the two. If you look at the circle on the right, we can see how the Average line acts as a strong support before it fails to maintain it. Generally speaking, most Support and Resistance locations may potentially fail to hold after 3 tests, as the Average did in this example.
As you can see, the Support and Resistance doesn’t wait to be tested before adjusting, which is why there are 2 lines which create their zones. The inner line is the Support/Resistance and the outer line is the Strong Support/Resistance. The Yellow Circle shows the inner line was able to calculate the moving resistance correctly and then adjusted accordingly as it was projecting the price to keep increasing. However, if you look at the White Circle, you can see that since there was first a crash, and then parabolic movement, that the inner zone could not move and predict the resistance as well as the outer zone could.
We consider the price to be ‘Overvalued’ when it is above the VWMA (blue line) and ‘Undervalued’ when it is below the VWMA. It is considered ‘fair’ price when it is within the VWMA to Average zone (between the blue and purple lines). If you look at the example above, you’ll notice where the two yellow circles are, it is not only considered ‘Overvalued’, but it then proceeds to ride the inner resistance line upwards. This is common when the market is overly bullish and vice versa when it is bearish. Please keep in mind, although it is common, it doesn’t mean a correction can’t happen.
In this example above we look at the last bull run that may have started due to the halving. This bull run was very bullish as you can see in the example above. The price was constantly sitting within the Resistance Zone and the VWMA that was very close to it was constantly acting as a Support. Naturally, due to the Algorithm used in this Indicator, as the momentum starts to slow down, the VWMA (blue line) will start to space out more and more from the Resistance Zone. This doesn’t mean the momentum is gone, it just means it may be slowing down.
Unfortunately we have to study the Bear Market with a different perspective than the Bull Market. However, there are still some similarities within the two. If you refer to the example above and the previous example, you can clearly see that the Bull Market loves to stay with the Resistance Zone and use the VWMA as a Support. However, the Bear Market does not. This is a normal occurrence, however we can see from the example above you may see a correction / horizontal movement when the Outer Support Line is touched. If you look at all 3 yellow circles, the Outer Support Line was touched, then either a small correction or horizontal consolidation occurred.
We will conclude our Tutorial here, hopefully you’ll be able to benefit from a moving Support and Resistance calculated with Machine Learning that projects its locations, rather than using traditional calculations.
Settings:
Source: This source is the base for all our calculations
Machine Learning Length: How much projection data are we storing and using to make calculations.
Smoothing Length: We need to smooth calculations such as RSI, EMA and VWMA. What length are we smoothing it with?
VWMA ML Projection Length: How far into our Machine Learning data should we average for our VWMA. Please note the 'Smoothing Length' is still applied here after getting the Projection Average.
Long Term Memory: Long term memory has the same storage length but is only updated once per Machine Learning Length. For instance, if Machine Learning Length is 100, it will save the Average of our data once every 100 bars. This means its memory is an average of 10,000 bars of Machine Learning. 'Average' connects its values diagonally whereas 'Hard Line' holds its value until it changes.
Use Average Last Distance In Potential Movement: This can help accuracy but generally also displaces the Support and Resistance by projecting it further.
Show Current Projection: Projections occur for each bar, and our Machine Learning utilizes these projections by storing and evaluating them. This toggle will display the Current Projection Line which is used to create all our Projections.
If you have any questions, comments, ideas or concerns please don't hesitate to contact us.
HAPPY TRADING!
Pine Script®指标