Divergence CCI [mado]Divergence screener for CCI Regular Bullish: "D" navy label Hidden Bullish: "H" navy label Regular Bearish: "D" red label Hidden Bearish: "H" red labelPine Script®指标由madoqa提供22156
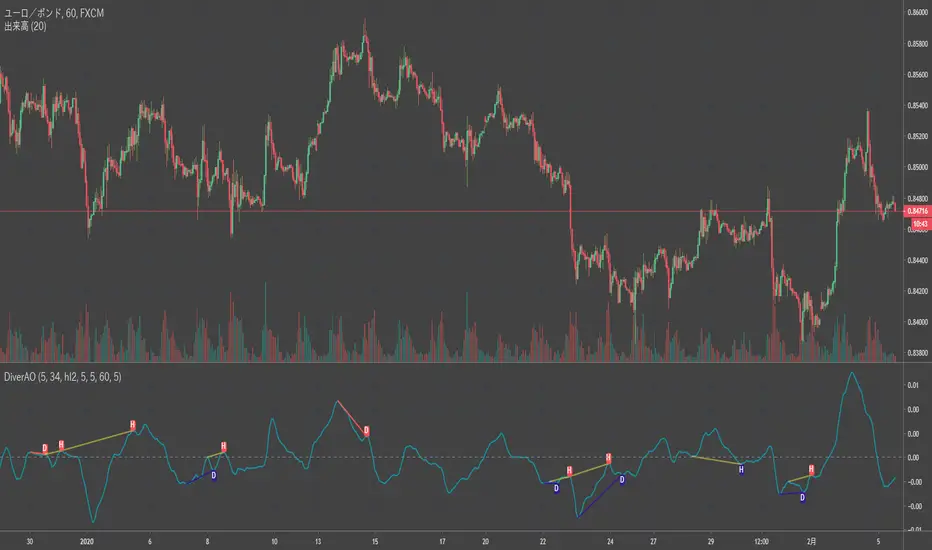
Divergence Awesome Oscillator [mado]Divergence screener for Awesome Oscillator Regular Bullish: "D" navy label Hidden Bullish: "H" navy label Regular Bearish: "D" red label Hidden Bearish: "H" red labelPine Script®指标由madoqa提供44341
Elder impulse system with double exponential moving average dema This version of impulse uses the double exponential moving average instead of the typical ema both to calculate macd and the moving slow and fast moving average that are plotted. The impulse system : The Impulse System combines two simple but powerful indicators. One measures market inertia, the other its momentum. When both point in the same direction, they identify an impulse worth following. We get an entry signal when both indicators get in gear. The Impulse System uses an exponential moving average to find uptrends and downtrends. When the EMA rises, it shows that inertia favors the bulls. When EMA falls, inertia works for the bears. The sec- ond component is MACD-Histogram, an oscillator whose slope reflects changes of power among bulls or bears. When MACD-Histogram rises, it shows that bulls are becoming stronger. When it falls, it shows that bears are growing stronger. The Impulse System flags those bars where both the inertia and the momentum point in the same direction. When both the EMA and MACD-Histogram rise, they show that bulls are roaring and the uptrend is accelerating.Pine Script®指标由Biticon提供2288
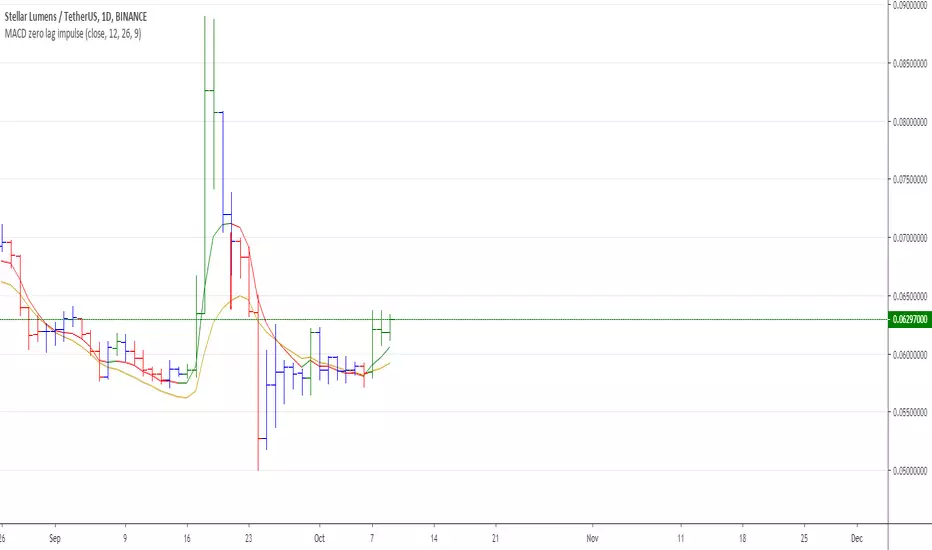
MACD Zero lag impulse systemThis version of impulse uses the double exponential moving average instead of the typical ema. The impulse system : The Impulse System combines two simple but powerful indicators. One measures market inertia, the other its momentum. When both point in the same direction, they identify an impulse worth following. We get an entry signal when both indicators get in gear. The Impulse System uses an exponential moving average to find uptrends and downtrends. When the EMA rises, it shows that inertia favors the bulls. When EMA falls, inertia works for the bears. The sec- ond component is MACD-Histogram, an oscillator whose slope reflects changes of power among bulls or bears. When MACD-Histogram rises, it shows that bulls are becoming stronger. When it falls, it shows that bears are growing stronger. The Impulse System flags those bars where both the inertia and the momentum point in the same direction. When both the EMA and MACD-Histogram rise, they show that bulls are roaring and the uptrend is accelerating.Pine Script®指标由Biticon提供99206
Elder impulse system with barcolor + Safezone stops + emasThe impulse system : The Impulse System combines two simple but powerful indicators. One measures market inertia, the other its momentum. When both point in the same direction, they identify an impulse worth following. We get an entry signal when both indicators get in gear. The Impulse System uses an exponential moving average to find uptrends and downtrends. When the EMA rises, it shows that inertia favors the bulls. When EMA falls, inertia works for the bears. The sec- ond component is MACD-Histogram, an oscillator whose slope reflects changes of power among bulls or bears. When MACD-Histogram rises, it shows that bulls are becoming stronger. When it falls, it shows that bears are growing stronger. The Impulse System flags those bars where both the inertia and the momentum point in the same direction. When both the EMA and MACD-Histogram rise, they show that bulls are roaring and the uptrend is accelerating. The SafeZone Stop : Once in a trade, where should you put your stop? This is one of the hardest questions in technical analysis. After answering it, you’ll face an even harder one—when and where to move that stop with the pas- sage of time. Put a stop too close and it’ll get whacked by some mean- ingless intraday swing. Put it too far, and you’ll have very skimpy protection. The Parabolic System, described in Trading for a Living, tried to tackle this problem by moving stops closer to the market each day, accelerating whenever a stock or a commodity reached a new extreme. The trouble with Parabolic was that it kept moving even if the market stayed flat and often got hit by meaningless noise. SafeZone trails prices with stops tight enough to protect capital but remote enough to keep clear of most random fluctuations. Engineers design filters to suppress noise and allow the signal to come through. If the trend is the signal, then the countertrend motion is the noise. When the trend is up, we can define noise as that part of each day’s range that protrudes below the previous day’s low. When the trend is down, we can define noise as that part of each day’s range that pro- trudes above the previous day’s high. SafeZone measures market noise and places stops at a multiple of noise level away from the market. We can make our lookback period 100 days or so if we want to aver- age long-term market behavior. SafeZone offers an original approach to placing stops. It monitors changes in prices and adapts stops to the current levels of activity. It places stops at individually tailored distances rather than at obvious support and resistance levels.Pine Script®指标由Biticon提供33369
Absolute Strength MTF IndicatorIntroduction The non-signal version of the absolute strength indicator from fxcodebase.com requested by ernie76 . This indicator originally from mt4 aim to estimate the bullish/bearish force of the market by using various methods. The Indicator Two lines are plotted, a bull line (blue) representing the bullish/buying force and a bear one (red) representing the bearish/selling force, when the bull line is greater than the bear line the market is considered to be strongly bullish, else strongly bearish. The indicator use various method, Rsi, stochastic, adx. The Rsi method is the one by default. The stochastic method is less reactive but smoother The Adx method is way different, while the other two methods make the bull and bear lines somewhat uncorrelated, the adx method focus more on the overall market strength than individual buyer/seller strength. The smoothing method use 3 different filters, SMA, EMA and LSMA, LSMA is more reactive than the two previous one while EMA is just more computer efficient. It is possible to use price data of different time frames for the calculation of the indicator. Stochastic method with 4 hour price close as source. Conclusion A classic indicator who can be derived into a lot of ways using a more adaptive architecture or recursion. Hope you find it a use :) A big thanks to ernie76 for the request and the support/testing of the indicator Feel free to pm me for any request.Pine Script®指标由alexgrover提供1616 1 K
Ichimoku Kinko Hyo: Basic StrategyIchimoku Kinko Hyo: Basic Strategy Entry/Exit orders are placed when three basic signals are triggered. Ichimoku Signals: 1) Tenkan-Sen/Kijun-Sen Cross Bullish: Tenkan-Sen is above the Kijun-Sen. Bearish: Tenkan-Sen is below the Kijun-Sen. 2) Chikou-Span Cross Bullish: Chikou-Span is above the close of 26 bars ago. Bearish: Chikou-Span is below the close of 26 bars ago. 3) Price versus Kumo Cloud Bullish: Close is above the Kumo Cloud. Bearish: Close is below the Kumo Cloud. Notes: 1) Long-only or short-only direction is feasible by checkbox. Stop and reverse strategy is taken by default. 2) Built-in Ichimoku indicator is strictly wrong because of counting one extra bar for all Ichimoku components. Including the current bar like moving average is correct way in Japan. This problem is fixed in my script.Pine Script®策略由Mizuki32提供2626 3.2 K
[CodaPro] Smart Money Flow Engine V1.0 Smart Money Flow Engine V1.0 - Volume Separation, Order Blocks, Fair Value Gaps, and Reversal Protection OVERVIEW The Smart Money Flow Engine is a multi-layered institutional flow detection system. It separates buying and selling volume, identifies smart money concepts (order blocks and fair value gaps), scores reversal risk using a weighted system, and generates confluence-based trade signals with built-in trade management. This is not a simple volume indicator. It is a complete analytical framework designed to help traders understand what institutional participants are doing beneath the surface of price action. HOW IT WORKS 1. VOLUME SEPARATION The engine splits each bar's volume into estimated bull and bear components based on the relationship between open, close, high, and low. These are smoothed using VWMA over a configurable period (default 24). When bull volume dominates above a delta threshold, the indicator identifies a bull zone. When bear volume dominates, a bear zone. This separation is the foundation for all other calculations. 2. INSTITUTIONAL DETECTION When total volume exceeds the average by a configurable multiplier (default 2x) AND the directional volume confirms the move, the bar is flagged as institutional activity. The sensitivity is adjustable from 1.0 (very sensitive) to 2.0 (strict), allowing users to tune for their specific instrument. 3. ORDER BLOCKS Bullish order blocks are identified where a bearish candle with strong volume is immediately followed by a move above that candle's high. Bearish order blocks are the inverse. These are drawn as labeled boxes on the chart in Pro display mode. 4. FAIR VALUE GAPS The indicator detects price imbalances (gaps between candle bodies) that exceed a minimum percentage threshold (default 0.3%). Bullish FVGs appear as dashed boxes where price gapped up, bearish FVGs where price gapped down. These represent areas where price may return to fill the imbalance. 5. REVERSAL PROTECTION SYSTEM (Weighted Scoring) Before any signal fires, the engine calculates a reversal risk score (0-100) using four weighted components: - RSI Extremes (default 30 weight): Is RSI oversold or overbought? - Volume Climax (default 25 weight): Is there a volume spike at a price extreme? - Price Stretch (default 20 weight): Is price extended far from its EMA? - Consecutive Candles (default 25 weight): Have we seen exhaustion patterns? If the reversal score exceeds the threshold (default 50), the signal is blocked. This prevents buying at tops and selling at bottoms. The weights are fully adjustable so you can emphasize the factors that matter most for your instrument. 6. CONFLUENCE-BASED SIGNALS Signals require multiple confirmations before firing. In Aggressive mode, 2 of 5 factors must align. Balanced requires 3. Conservative requires 4. The five confluence factors are: volume zone direction, institutional activity, order block presence, fair value gap presence, and flow percentile rank. All signals require barstate.isconfirmed before firing. This indicator does not repaint. 7. TRADE MANAGEMENT Optional one-trade-at-a-time system with configurable take profit, stop loss, and maximum bars in trade. TP/SL lines are drawn on chart while a position is active. When a trade exits (by TP, SL, or max bars), the exit reason is labeled on the chart. 8. MONEY FLOW PROFILE In Pro display mode, a histogram-style flow profile is drawn to the right of the chart showing the distribution of net flow over the last 100 bars. Color gradients indicate bull vs bear flow intensity with a glowing zero line for reference. The most concentrated flow bucket pulses for emphasis. FEATURES - Bull/bear volume separation with VWMA smoothing - Institutional buy/sell detection with adjustable sensitivity - Order block identification and visualization - Fair value gap detection with minimum size filter - Weighted reversal protection scoring system (4 components, fully adjustable) - Three signal modes: Conservative, Balanced, Aggressive - Signal cooldown to prevent overtrading - Built-in trade management with TP/SL/Max bars - Money flow distribution profile with gradient coloring (Pro mode) - Two dashboards: main status panel and elite detector - Gradient candle coloring based on flow direction and strength - RSI extreme price levels drawn on chart with lookback window - Three color presets: CodaPro, Institutional, Heatmap - Dark and Light theme support - Three display modes: Lite, Standard, Pro - 9 alert conditions for automation NON-REPAINTING CONFIRMATION This indicator is designed to be fully non-repainting on confirmed bars: - No request.security calls (no lookahead risk) - All entry and exit signals gated by barstate.isconfirmed - All visual elements (labels, boxes, plotshapes) only render on confirmed bars - Consecutive candle counting only updates on confirmed bars - RSI level tracking only updates on confirmed bars - Dashboard and money flow profile update on current bar for display purposes only and have no impact on signal generation USAGE Apply to any instrument on any timeframe. The indicator works on stocks, forex, crypto, and futures. Start with default settings and adjust the signal mode based on your trading style. Use the reversal protection weights to fine-tune which conditions matter most for your instrument. RECOMMENDED SETTINGS BY STYLE Scalping: Aggressive mode, lower cooldown (5-10), tighter TP/SL Swing: Balanced mode, moderate cooldown (15-25), wider TP/SL Position: Conservative mode, high cooldown (30+), widest TP/SL ABOUT THE BUILD This indicator was engineered using ARiS, the AI coding engine behind CodaPro. ARiS is a collaborative development system that translates trading concepts into production-grade Pine Script. The strategy logic, volume separation methodology, reversal protection scoring system, and signal architecture were designed by ARiS through CodaPro.ai. ARiS handled the code architecture, optimization, and non-repainting compliance. Created by Aris | CodaPro Engine DISCLAIMER This tool was created using the CodaPro Pine-Script AI engine — designed to produce robust trading overlays, educational visuals, and automation-ready alerts. It is provided strictly for educational purposes and does not constitute financial advice. Always backtest and demo before applying to real capital. Pine Script®指标由ArisCodes提供21
HTF MTF Analysis & Manipulation======================= HTF MTF ANALYSIS & MANIPULATION ======================= SMT - Shows correlations between multiple instruments (e.g., Pair 2, Pair 3). - Auto-matching of pairs to highlight synchronized movements. - Does not include SMT with DXY. HTF Projection (High Time Frame) - Projects higher timeframe levels directly onto the current chart. - Supports multiple HTFs (e.g., 1H, 4H, Daily, Weekly) with customizable number of candles. - Displays midlines and key candlestick levels for HTFs. - Complete visual customization: body, border, and spike colors for bull and bear. - Options for labels above/below candles and PSP display. - Manages offsets for candlestick distance and visual sizing. Multi-Timeframe and Separators - Displays levels and period separators on multiple timeframes: for example, on a 1M chart, you can see 15M and 4H references. - Ideal for strategies that combine MTF, HTF, and LTF. HTF MTF Manipulation Detection -Identifies manipulation zones MTF HTF -Triggers the manipulation signal when a candlestick clears the previous high or low and closes back within the range. -Highlights manipulation-related CISD zones or HTF/SMT. Fair Value Gap (FVG) -Automatically detects FVGs on the chart and in HTF/SMT projections. -Displays colored boxes with upper, lower, and center lines. -Options to extend FVGs until they are filled. -Separate colors for bullish and bearish FVGs. -Configurable maximum limit of displayable FVGs. Change in State of Delivery (CISD) -Identifies changes in the market's delivery state. -Dashed lines for unconfirmed CISDs. -Solid lines for validated CISDs (when the price violates the level). -Customizable colors and separate management for bullish and bearish CISDs. Bias Management - Set market bias: Neutral, Long, or Short. - The bias filters the displayed patterns (e.g., Long primarily shows buying opportunities). - Affects the detection of FVG, CISD, and manipulations. Mode Configuration Mode 1: Spaced timeframes for long-term trading -1m → 1m, 15m, 4h, D -3m → 3m, 30m, 4h, D, W -5m → 5m, 1h, D, M -15m → 15m, 4h, W, M -30m → 30m, 4h, W, M -1h → 1h, D, M -4h → 4h, W, M -D → D, M -W → W, M Mode 2: Close timeframes for intraday trading -1m → 1m, 15m, 30m, 1h, 4h -3m → 3m, 30m, 1h, 4h, D -5m → 5m, 1h, 4h, D, W -15m → 15m, 1h, 4h, D, W -30m → 30m, 1h, 4h, D, W -1h → 1h, 4h, D, W, M -4h → 4h, D, W, M -D → D, W, M -W → W, M Manual: Manually configure all HTF and SMT timeframes. Display Options -HTF + SMT: Displays both HTF projections and SMT pairs. -only SMT: Displays only SMT pairs. -only HTF: Displays only HTF projections. SMT Auto-Correlation Automatically supports: -Futures: ES ↔ NQ ↔ YM -CFD: NAS100 ↔ US500 ↔ US30 -Metals: XAUUSD ↔ XAGUSD ↔ XAUEUR -Forex: EURUSD ↔ GBPUSD For unsupported instruments, manual configuration via Pair 2 and Pair 3. Does not support Inverse SMT. Customization -Contrast Mode: Automatic colors based on the chart theme. -Custom Colors: Manual selection of each element. -Font: Default or Monospace. -Label Size: Tiny, Small, Normal, Large, Auto. -Configurable opacity for borders and backgrounds. Distance Parameters -Distance from last candle: 1-200 bar -Distance between projections: 1-1000 bar (HTF) / -100 to +100 (SMT) -Candle size: 2-10 (HTF) / 1-2 (SMT) -Space between candles: 1-50 (HTF) / 2-10 (SMT) IMPORTANT: The SMT timeframe must be >= the chart timeframe. FVG CISD Dinamic If you like my work support me Disclaimer This script is provided for educational and informational purposes only. It does not constitute financial advice, investment advice, or a recommendation to buy or sell any financial instrument. The author takes no responsibility for any losses or damages resulting from the use of this script. Trading involves risk, and you are solely responsible for your trading decisions Pine Script®指标由Giovanni-1-提供已更新 1183
Simple Volume Zone Oscillator - SVZO | TR🎯Overview SVZO | TR is a sophisticated volume-based momentum oscillator that combines volume analysis with price action to identify buying and selling pressure. It calculates the net volume flow relative to total volume over a specified period, providing clear signals for trend direction and potential reversals. Key Features 📊 Volume-Weighted Analysis Volume Zone Oscillator: Measures the balance between buying and selling volume Price-Volume Integration: Compares current typical price with previous period Smoothed Signal: Moving average applied for cleaner, more reliable signals 🎨 Advanced Visualization 8 Color Themes: Classic, Modern, Robust, Accented, Monochrome, Moderate, Aqua, Cosmic Dynamic Fill Zones: Multi-layer fills showing oscillator strength Price Bar Coloring: Candles change color based on SVZO signal Signal Markers: Clear entry signals on the price chart 📈 Complete Signal System Zero-Line Crossovers: Primary trading signals Zone Strength: Visual indication of buying/selling pressure intensity Real-Time Updates: Continuous calculation on each bar How It Works Calculation Logic Typical Price = (High + Low + Close) / 3 Volume Up = Volume when typical price increased Volume Down = Volume when typical price decreased SVZO = × 100 Smoothed Signal = Moving average of SVZO values Indicator Interpretation Positive Values (above 0): Buying pressure dominates (bullish) Negative Values (below 0): Selling pressure dominates (bearish) Magnitude: Larger absolute values indicate stronger pressure Crossovers: Zero-line crosses signal potential trend changes Display Options Visual Components Oscillator Line: Smoothed SVZO with color-coded direction Fill Zones: Multi-layer fills showing: Positive zone (green) Negative zone (red) Dynamic fill for current momentum Colored Candles: Price bars match oscillator direction Entry Signals: Triangles above/below bars for crossovers Value Labels: Current SVZO value at the end of the chart Color Themes (8 Options) Classic: Green/Red Modern: White/Purple Robust: Gold/Burgundy Accented: Purple/Pink Monochrome: Light Gray/Dark Gray Moderate: Forest Green/Red Aqua: Sky Blue/Orange Cosmic: Pink/Purple Trading Signals Entry Signals LONG: Smoothed SVZO crosses above zero line Triangle up below bar Bullish candle colors SHORT: Smoothed SVZO crosses below zero line Triangle down above bar Bearish candle colors Trend Confirmation Strong Bullish: SVZO > 30-50 range Strong Bearish: SVZO < -30 to -50 range Neutral: Values near zero line Divergence: Price vs SVZO direction mismatch Customization Settings Technical Parameters Length SVZO: Lookback period (default: 14) Smoothing: Moving average period (default: 3) MA Type: EMA, SMA, RMA, WMA, VWMA, or HMA Color Theme: 8 visual style options Alert System Zero-Line Cross Alerts: Notifications for bullish/bearish crossovers Custom Messages: Includes ticker symbol in alerts Real-Time Notifications: Instant updates on signal generation Benefits for Traders 🎯 Unique Volume Perspective Pure volume-based momentum measurement Not dependent on traditional price oscillators Captures institutional money flow 📊 Clear Visual System Multi-color themes for personal preference Integrated candle coloring for quick scanning Visual pressure zones for strength assessment ⚡ Practical Applications Trend Trading: Follow volume momentum Reversal Detection: Zero-line crosses Divergence Trading: Price vs volume momentum Confirmation Tool: Validate other indicators Ideal Usage Scenarios Best Market Conditions Trending markets with clear volume patterns Breakout confirmations Reversal identification Momentum trading strategies Timeframe Compatibility Works on all timeframes Particularly effective on intraday charts Adjustable parameters for different trading styles Perfect for traders who want to incorporate volume analysis into their trading system with clear, actionable signals. The SVZO provides a unique perspective on market dynamics by focusing on the volume behind price movements, making it especially valuable for identifying genuine breakouts and potential reversals before they appear on price charts. Pine Script®指标由Tiagorocha1989提供已更新 13
Precision Pivot Confluence Engine [JOAT]Precision Pivot Confluence Engine Introduction The Precision Pivot Confluence Engine is an open-source technical indicator that combines Central Pivot Range (CPR) analysis with Smart Money Concepts (SMC), multi-oscillator divergence detection, and institutional order flow patterns. This mashup integrates multiple proven methodologies into a unified confluence system designed to identify high-probability trading zones where institutional and retail liquidity intersect. The indicator is built for traders who understand that no single signal provides consistent edge, but multiple confirming factors working together can significantly improve trade selection. By synthesizing CPR levels, Fair Value Gaps, Order Blocks, liquidity sweeps, and divergence patterns, this tool helps identify structural market inflection points. Chart showing CPR levels, FVG zones, Order Blocks, and divergence signals on 4H timeframe Why This Mashup Exists This indicator combines five distinct analytical frameworks that complement each other: CPR Analysis: Identifies key pivot levels where institutional algorithms and retail traders make decisions Smart Money Concepts: Tracks Fair Value Gaps, Order Blocks, and Breaker Blocks showing institutional positioning Divergence Detection: Uses RSI, MACD, and Stochastic RSI to identify momentum exhaustion Liquidity Analysis: Detects liquidity sweeps where stop hunts occur before reversals Volume Confirmation: Validates moves with volume analysis and delta calculations Each component addresses a different aspect of market structure. CPR provides static reference levels, SMC reveals dynamic institutional behavior, divergences show momentum shifts, liquidity sweeps identify stop hunts, and volume confirms genuine moves versus noise. Together, they create a multi-dimensional view of market conditions. Core Components Explained 1. Enhanced CPR System The Central Pivot Range system calculates Daily and Weekly pivot levels using the formula: Pivot = (High + Low + Close) / 3 BC (Bottom Central) = (High + Low) / 2 TC (Top Central) = (Pivot - BC) + Pivot The indicator analyzes CPR width to determine market regime: Narrow CPR (width < 0.5%): Indicates compression and potential breakout conditions Wide CPR (width > 1.5%): Suggests ranging market with less directional conviction Price position relative to CPR: Above both Daily and Weekly pivots = bullish structure, below = bearish structure CPR levels act as magnetic zones where price tends to react. The indicator tracks distance from pivots to identify overextension and mean reversion opportunities. 2. Smart Money Concepts Integration Fair Value Gaps (FVG): Bullish FVG occurs when current low > high from 2 bars ago, leaving an unfilled gap Bearish FVG occurs when current high < low from 2 bars ago The indicator calculates FVG size as percentage of price and filters for significant gaps (> 0.3%) to avoid noise. FVGs represent inefficient price delivery where institutions moved price quickly, often returning to fill these gaps later. Order Blocks (OB): Bullish OB: Two consecutive bearish candles followed by strong bullish candle with high volume Bearish OB: Two consecutive bullish candles followed by strong bearish candle with high volume Order Blocks mark the last opposite-direction move before a strong impulse, indicating where institutions accumulated or distributed positions. Breaker Blocks: Failed Order Blocks that get violated become Breaker Blocks, signaling potential trend reversal. The indicator tracks the last bullish and bearish OB levels and alerts when price breaks through them. Liquidity Sweeps: The indicator identifies when price briefly exceeds recent highs/lows (20-bar lookback) but closes back inside the range. These "stop hunts" often precede reversals as institutions trigger retail stops before moving price in the intended direction. Example showing FVG zones, Order Blocks, and liquidity sweep markers 3. Multi-Oscillator Divergence System The indicator simultaneously tracks divergences across three oscillators: RSI Divergence: Bullish: Price makes lower low, RSI makes higher low (momentum improving despite price weakness) Bearish: Price makes higher high, RSI makes lower high (momentum deteriorating despite price strength) MACD Divergence: Tracks histogram divergences using the same pivot-based logic Stochastic RSI Divergence: More sensitive than RSI, catches early momentum shifts The indicator uses a 5-bar pivot lookback to identify swing highs/lows and compares current pivots with previous pivots to detect divergences. When multiple oscillators show divergence simultaneously, it signals strong momentum exhaustion. 4. Volume Analysis Engine Volume MA Comparison: Identifies high volume (> 1.5x MA) and climax volume (> 3x MA) Volume Delta: Cumulative difference between buying volume (green candles) and selling volume (red candles) Delta Trend: Compares current delta to 20-period MA to identify institutional accumulation or distribution Volume Confirmation: Validates bullish moves with high volume + rising delta, bearish moves with high volume + falling delta 5. Confluence Scoring System The indicator calculates a real-time confluence score (0-100) by weighting each component: Confluence Score Components: - CPR Position: Up to 15 points (bullish above pivots, bearish below) - SMC Signals: Up to 10 points (FVG + OB + Breaker + Liquidity Sweeps) - Divergence: Up to 10 points (single oscillator = 5, multiple = 10) - Volume: Up to 10 points (confirmed volume = 7, climax = additional 3) - Trend Alignment: Up to 5 points (price vs key MAs) Scores above 70 indicate strong confluence for potential trades. The dashboard displays individual component scores for transparency. Visual Elements CPR Lines: Daily Pivot (yellow), TC/BC (yellow transparent), Weekly Pivot (yellow circles) FVG Boxes: Green boxes for bullish FVGs, red boxes for bearish FVGs Order Block Boxes: Solid green/red boxes marking institutional zones Breaker Block Labels: "BB" markers when Order Blocks fail Liquidity Sweep Labels: "LIQ" and "STRONG LIQ" positioned at sweep tips Divergence Labels: "D" markers at divergence pivot points Dashboard: Top-right table showing confluence score and component breakdown How Components Work Together The mashup creates a layered analysis approach: Layer 1 - Structure: CPR levels define key zones where reactions are likely Layer 2 - Institutional Behavior: SMC concepts show where smart money is positioned Layer 3 - Momentum: Divergences indicate when current trend is losing steam Layer 4 - Confirmation: Volume validates whether moves are genuine or false Layer 5 - Synthesis: Confluence score combines all factors into actionable signal Example scenario: Price approaches Daily Pivot (Layer 1) where a bullish Order Block exists (Layer 2), RSI shows bullish divergence (Layer 3), and volume delta is rising (Layer 4). The confluence score jumps to 85 (Layer 5), signaling high-probability long setup. Input Parameters CPR Settings: Show Daily CPR: Toggle daily pivot levels (default: enabled) Show Weekly CPR: Toggle weekly pivot levels (default: enabled) CPR Width Threshold: Defines narrow vs wide CPR (default: 0.5% / 1.5%) Smart Money Concepts: Show FVG: Display Fair Value Gap boxes (default: enabled) Show Order Blocks: Display Order Block boxes (default: enabled) Show Breaker Blocks: Display Breaker Block labels (default: enabled) Show Liquidity Sweeps: Display liquidity sweep markers (default: enabled) FVG Min Size: Minimum gap size to display (default: 0.3%) Lookback Bars: Bars to scan for liquidity levels (default: 20) Divergence Detection: Show Divergences: Toggle divergence labels (default: enabled) RSI Length: Period for RSI calculation (default: 14) Pivot Lookback: Bars for pivot detection (default: 5) Volume Analysis: Show Volume Analysis: Toggle volume indicators (default: enabled) Volume MA Length: Period for volume moving average (default: 20) High Volume Multiplier: Threshold for high volume (default: 1.5x) Climax Volume Multiplier: Threshold for climax volume (default: 3.0x) Display Options: Show Dashboard: Toggle confluence score table (default: enabled) Max FVG Boxes: Limit displayed FVG boxes (default: 20) Max OB Boxes: Limit displayed Order Block boxes (default: 15) Label Spacing: Minimum bars between labels to prevent overlap (default: 10-15) How to Use This Indicator Step 1: Identify Market Structure Check CPR position and width. Narrow CPR suggests breakout potential, wide CPR suggests range-bound conditions. Step 2: Look for SMC Confluence Identify FVGs, Order Blocks, and recent liquidity sweeps. These zones often provide high-probability entry areas. Step 3: Check for Divergences Look for divergence labels at swing points. Multiple oscillator divergences increase signal strength. Step 4: Confirm with Volume Ensure volume supports the move. Rising delta + high volume confirms bullish moves, falling delta + high volume confirms bearish moves. Step 5: Review Confluence Score Check the dashboard. Scores above 70 indicate strong confluence. Individual component scores show which factors are contributing. Step 6: Wait for Price Action Confirmation The indicator identifies zones and conditions, but wait for price action confirmation (candlestick patterns, breakouts, etc.) before entering trades. Best Practices Use on 15-minute to 4-hour timeframes for optimal signal quality Combine with proper risk management - indicator shows zones, not exact entries Pay attention to confluence score - higher scores generally indicate better setups Watch for FVG fills and Order Block retests as entry triggers Liquidity sweeps followed by reversal often provide excellent risk:reward entries Divergences work best when combined with SMC zones or CPR levels Volume confirmation is critical - avoid low-volume signals Indicator Limitations Does not provide exact entry/exit signals - requires trader interpretation Can generate false signals in choppy, low-volume conditions Multiple visual elements may clutter chart - adjust display settings as needed Divergences can persist longer than expected - price can continue trending despite divergence FVGs and Order Blocks don't always get retested - not every zone provides entry opportunity Confluence score is a guide, not a guarantee - high scores can still result in losing trades Requires understanding of SMC concepts and CPR analysis for effective use Performance varies across different markets and timeframes Technical Implementation Built with Pine Script v6 using: Custom CPR calculations with width analysis Box and label management with anti-overlap logic Persistent variables for tracking Order Blocks and Breaker Blocks Pivot-based divergence detection across multiple oscillators Volume delta calculation with cumulative tracking Real-time confluence scoring system Dynamic dashboard with component breakdown The code is fully open-source and can be modified to suit individual trading styles and preferences. Originality Statement This indicator is original in its integration approach. While individual components (CPR, FVG, Order Blocks, RSI divergence, volume analysis) are established concepts, this mashup is justified because: It synthesizes five distinct methodologies that address different market aspects The confluence scoring system provides quantitative measurement of setup quality Anti-overlap logic and timeframe-adaptive filtering reduce visual clutter Component integration creates layered analysis not available in individual indicators The combination helps identify zones where multiple institutional and technical factors align Each component contributes unique information: CPR provides static structure, SMC reveals dynamic institutional behavior, divergences show momentum shifts, liquidity analysis identifies stop hunts, and volume confirms genuine moves. The mashup's value lies in presenting these complementary perspectives simultaneously with a unified scoring system. Disclaimer This indicator is provided for educational and informational purposes only. It is not financial advice or a recommendation to buy or sell any financial instrument. Trading involves substantial risk of loss and is not suitable for all investors. Technical indicators are tools for analysis, not crystal balls. Past performance and backtested results do not guarantee future performance. Market conditions change, and strategies that worked historically may not work in the future. The confluence score is a mathematical calculation based on current market data, not a prediction of future price movement. High confluence scores do not guarantee profitable trades. Users must conduct their own analysis and risk assessment before making trading decisions. Always use proper risk management, including stop losses and position sizing appropriate for your account size and risk tolerance. Never risk more than you can afford to lose. Consider consulting with a qualified financial advisor before making investment decisions. The author is not responsible for any losses incurred from using this indicator. Users assume full responsibility for all trading decisions made using this tool. -Made with passion by officialjackofalltradesPine Script®指标由officialjackofalltrades提供286
Hidden Markov Model: Regime Probability [AlgoPoint]Hidden Markov Model: Regime Probability Traditional technical indicators are deterministic and lagging; they tell you what the price has already done. The Hidden Markov Model (HMM) Regime Probability system takes a completely different, quantitative approach. It uses probabilistic mathematics to estimate the unobservable "Hidden State" (Market Regime) the price is currently operating in. Inspired by the mathematical models used by institutional quantitative hedge funds, this script doesn't just look at price direction—it calculates the probability of the market being in a specific regime based on real-time observations of Momentum and Volatility. 1. The Three Hidden States (Regimes) The market is modeled as existing in one of three hidden states: ↗ Bullish Regime: High positive momentum with low or stable volatility. (Steady, grinding uptrends). ↘ Bearish Regime: High negative momentum with high volatility. (Aggressive sell-offs and panic). ↕ Chop / Chaos Regime: Zero/low momentum with high volatility. (Whipsaw, ranging, and unpredictable noise). 2. How It Works (The Quant Engine) Since Pine Script does not natively support complex matrix optimization, this script builds a robust Pseudo-HMM using a predefined Transition Matrix and Bayesian Updates. Observables (Emissions): The script calculates the Z-Scores of Smoothed Momentum (Rate of Change) and Volatility (ATR). Emission Probabilities (Gaussian PDF): It feeds these Z-Scores into a Gaussian Probability Density Function to see how well the current market matches the expected profile of a Bull, Bear, or Chop regime. Bayesian Update: Using a predefined Markov Transition Matrix (the statistical inertia of a trend), it updates the prior probabilities to give you a real-time percentage (0-100%) for each regime. 3. Advanced Visual Features & UI We built a custom UI/UX engine to make digesting complex probabilities instantaneous: Exponential Color Smoothing (Bar Colors): As the probability of a regime increases, the bar colors smoothly transition. We implemented an exponential color blending algorithm to prevent abrupt, distracting color changes and eliminate "muddy" colors during transitions. Pro Quant Dashboard: A built-in HUD (Heads-Up Display) provides a quick summary. It features a dominant state readout, an overall "Confidence Score", and ASCII-style mini progress bars (████░░░) for rapid visual processing of probabilities without needing to read the numbers. Stacked Area Oscillator: The bottom panel displays a 0-100 stacked area chart, showing the exact distribution of probabilities across Bull (Green), Chop (Purple), and Bear (Red) states. 4. How to Use This Tool This is not a standalone Buy/Sell signal indicator. It is a Strategy Filter and a Risk Manager. When Bull/Bear Probability is Dominant (>50%): The market is trending. Turn ON your trend-following indicators (like Moving Averages or Breakout systems) and ignore overbought/oversold signals. When Chop Probability is Dominant (>50%): The market is noisy. Turn OFF your trend-following systems. Either switch to Mean Reversion strategies (like RSI or Bollinger Bands) or stay in cash until a clear regime emerges. Watch the Confidence Score: If the Dashboard shows "LOW" confidence, it means the probabilities are split (e.g., 34% Bull, 33% Chop, 33% Bear). Wait for the model to gain confidence before committing capital. 5. Alerts The script includes non-repainting alerts that trigger only when the dominant regime changes: HMM Regime: BULLISH 🚀 * HMM Regime: BEARISH 🩸 * HMM Regime: CHOP ⚖️ 6. Settings Lookback Period: The window used to calculate the Z-scores for momentum and volatility. Transition Matrix: Allows advanced users to tweak the statistical likelihood of the market staying in its current state versus transitioning to a new one. Color Transition Speed: Adjusts the smoothness of the bar coloring. A lower value creates a buttery-smooth fade between regimes, while a value of 1.0 makes it instant.Pine Script®指标由Iamalala提供339
Master Yoda (10-in-1) v1.0 [R2D2]Yoda (10-in-1) v1.0 Master Yoda 10-in-1 is a comprehensive, professional-grade trading suite designed to consolidate your entire workflow into a single indicator. By combining 10 core technical indicators (plus a bonus 11th ) into one modular overlay, this tool overcomes the "max indicator" limit on charts while providing deep, multi-timeframe (MTF) market analysis. This script operates on a philosophy of Filters vs. Triggers : Filters : Define the environment (e.g., Is the trend Bullish? Is Volatility low?). Triggers : Execute the precise entry (e.g., Price crosses VWAP, MACD crosses Zero). 1. EMA Filter (The Trend Backbone) Type : Trend Filter Logic : Uses Fast (Default: 9) and Slow (Default: 21) Exponential Moving Averages. How to Use: Trend-Following Mode : Select this in settings to trade only when the Fast EMA is above the Slow EMA. Counter-Trend Mode : Select this to catch reversals (Fast EMA below Slow EMA). Visual : The background color changes Green/Red based on this trend alignment. 2. MACD (Momentum Trigger) Type : Momentum Trigger Logic : Standard (12, 26, 9) convergence divergence. How to Use: Zero-Line Cross : Unlike standard signal crosses, this module triggers signals when the MACD line crosses the Zero Line. Bullish : Crosses Over 0. Bearish : Crosses Under 0. 3. RSI (Safe Bottom Finder) Type : Mean Reversion Filter Logic : Relative Strength Index (Length 14). How to Use: Filter Logic : The script only permits Long signals when RSI is in "safe" territory (Oversold, default < 30) and Short signals when Overbought (default > 70). Strategy : Prevents buying at the absolute top or selling at the absolute bottom. 4. VWAP (Institutional Value) Type : Mean Reversion Trigger Logic : Volume Weighted Average Price with Standard Deviation Bands. How to Use: Mean Reversion : Designed for counter-trend trading. Long Trigge r: Price crosses the Lower Band (Value Zone). Short Trigger : Price crosses the Upper Band (Premium Zone). 5. Stoch RSI (The Scalper's Edge) Type : Momentum Filter (High Sensitivity) Logic : Stochastic Oscillator applied to RSI data. How to Use: Fast Signals : Best used on lower timeframes (5m, 15m) for scalping. Bullish : %K line crosses %D line while below the Oversold threshold (20). 6. TTM Squeeze (Volatility Breakout) Type : Volatility Trigger Logic : Measures Bollinger Bands inside Keltner Channels. How to Use: Squeeze (Red Dot) : Volatility is compressing. A big move is imminent. Wait. Fire (Green Dot) : Volatility has expanded. Trade the breakout. Visuals : Dots appear at the bottom of the chart to indicate Squeeze status. 7. ADX (Trend Strength) Type : Chop Filter Logic : Average Directional Index. How to Use: Filter Chop : Trading in a flat market is dangerous. ADX filters out trades unless the trend strength is > 25. Confirm Direction : Ensures the DI+ (Bulls) or DI- (Bears) is dominant. 8. SuperTrend (Trailing Stop) Type : Trend Filter Logic : ATR-based trailing stop (Factor 3.0, Length 10). How to Use: Bias Enforcement : If the line is Green, only Longs are allowed. If Red, only Shorts. Stop Loss : Use the SuperTrend line as your dynamic trailing stop-loss level. 9. MFI (Volume-Weighted RSI) Type : Volume Filter Logic : Money Flow Index. How to Use: Smart Money : Confirms if volume supports the price action. Filter : Only permits trades when MFI confirms an extreme (Overbought/Oversold) to avoid false breakouts on low volume. 10. ATR Channels (Reversal Bands) Type : Reversal Trigger Logic : Moving Average ± (ATR * Multiplier). How to Use: Statistical Extremes : When price hits the outer ATR bands, it is statistically extended. Signal : Triggers a reversal trade (Long at Lower Band, Short at Upper Band). Bonus : 11. PSAR (Parabolic SAR) Type : Trend Filter Logic : Parabolic Stop and Reverse. How to Use: Visual Bias : Purple dots below price = Bullish Trend. Purple dots above = Bearish Trend. Dashboard & Visuals Status Table : A "Heads Up Display" in the top-right corner shows the real-time status (BULL/BEAR) of every enabled indicator. Buy/Sell Labels : Triangle shapes on the chart indicate confirmed entry points based on your active Triggers and Filters. Dynamic Background : Shaded background highlights the dominant EMA trend direction. Alerts The script comes with built-in alert conditions for automation: Yoda Long : Triggers when all active filters pass and a Long trigger fires. Yoda Short : Triggers when all active filters pass and a Short trigger fires. How to Configure You do not need to use all 10 indicators at once! Use the Settings menu to toggle them based on your strategy: Trend Trading : Enable EMA, SuperTrend, and MACD. Scalping : Enable Stoch RSI and VWAP. Breakouts : Enable TTM Squeeze and ADX. Disclaimer : This tool is for educational purposes only. Past performance does not guarantee future results. Always manage your risk.Pine Script®指标由R2D2_4Life提供已更新 0
Sweep Trend Chop Filter (STCF)Sweep Trend Chop Filter (STCF) is a price‑action trend tool that colors candles based on trend strength, momentum shifts, and chop conditions. It combines a 4‑MA stack with a CISD state‑machine to highlight true bullish/bearish moves while filtering out noise. A fast, visual trend filter for any timeframe. Bullish: MA9 > MA18 ≥ MA27 ≥ MA50 → bars colored green Bearish: MA9 < MA18 ≤ MA27 ≤ MA50 → bars colored red Otherwise = Chop (yellow) MA Stack (Primary Trend): Uses four moving averages (9/18/27/50) with a loosened stacking rule to identify trend bias. CISD State (Momentum Confirmation): Confirms flips only on confirmed bars by tracking a red→green (bearish → bullish) or green→red (bullish → bearish) transition, then measuring follow‑through using the Noise Filter tolerance. When met, CISD can temporarily color bars even if the MA stack hasn’t aligned yet. Full Candle Coloring: Bodies, wicks, and borders are colored for immediate visual clarity, with optional overlay of the 4 MAs. Inputs Noise Filter (0–1): Tighten/loosen CISD confirmation sensitivity (default 0.7). Swing Period: For future extensions (placeholder). MA Type: EMA (default) or SMA. MA Lengths: 9 / 18 / 27 / 50 (editable). Colors: Bullish, Bearish, Chop. Toggle: Show/Hide MAs. Tips & Notes Go to Settings of Chart (not the indicator) and Disable Colored Body, Wick, and Outline. Use STCF to stay with trend, avoid chop, and time transitions with CISD confirmation. Best paired with higher‑timeframe confluence and risk controls. No signals/alerts are fired—visual filter only.Pine Script®指标由tomgerhold提供3
EMA Cross with MTF Understanding EMA Crossover and Multi-Time Frame SMA Crossover in Technical Analysis Technical indicators like Exponential Moving Averages (EMAs) and Simple Moving Averages (SMAs) are foundational tools for traders to identify trends, momentum shifts, and potential entry/exit points in markets such as stocks, forex, or cryptocurrencies. Crossovers—where one average line crosses another—signal changes in trend direction. Below, I'll break down EMA crossovers, then extend to multi-time frame (MTF) SMA crossovers, and explain how analyzing from a lower time frame can reveal higher time frame trends. EMA Crossover: Basics and Application An EMA crossover involves two or more EMAs of different periods intersecting on a price chart. EMAs give more weight to recent prices compared to SMAs, making them more responsive to new data and ideal for capturing short- to medium-term trends. How It Works: Typically, traders use a short-term EMA (e.g., 9-period or 12-period) and a longer-term EMA (e.g., 26-period or 50-period). Golden Cross (Bullish Signal): When the shorter EMA crosses above the longer EMA, it suggests upward momentum and a potential buy opportunity. This indicates that recent price action is stronger than the historical average. Death Cross (Bearish Signal): When the shorter EMA crosses below the longer EMA, it signals downward momentum and a potential sell or short opportunity. Example: On a daily chart, a 12-period EMA crossing above a 26-period EMA might confirm the start of an uptrend, often used in strategies like the MACD (which is derived from EMA differences). Advantages: Quick response to price changes due to exponential weighting. Reduces lag compared to SMAs, helping in volatile markets. Can be combined with volume or other indicators (e.g., RSI) to filter false signals. Limitations: Prone to whipsaws (false crossovers) in sideways or ranging markets. Best suited for trending environments; in choppy conditions, it may generate too many signals. Traders often apply EMA crossovers on single time frames, but for broader context, incorporating multi-time frame analysis enhances reliability. Multi-Time Frame SMA Crossover: Integrating Broader Perspectives Multi-time frame (MTF) analysis involves examining the same asset across different time intervals (e.g., 5-minute, 1-hour, daily) to align short-term trades with longer-term trends. Here, we focus on SMA crossovers, where SMAs—simple arithmetic averages of closing prices over a set period—are used instead of EMAs. SMAs are smoother and less reactive, making them suitable for identifying sustained trends. How It Works in MTF: Choose at least two time frames: a lower one (e.g., 15-minute for intraday trading) and a higher one (e.g., 4-hour or daily for overall trend). On each frame, plot two SMAs: a shorter one (e.g., 50-period) and a longer one (e.g., 200-period). Crossover Signals: Bullish: Shorter SMA crosses above the longer SMA. Bearish: Shorter SMA crosses below the longer SMA. In MTF, the higher time frame dictates the dominant trend, while the lower one provides precise entry timing. For instance: If the daily chart shows a bullish 50/200 SMA crossover (uptrend), look for buy entries on the 1-hour chart when its own SMA crossover aligns. This "top-down" approach ensures you're trading in the direction of the bigger picture, reducing counter-trend risks. Advantages: Filters noise: Higher time frames smooth out short-term volatility. Improves win rate by confirming trends across scales. Versatile for strategies like swing trading (daily/weekly) or scalping (5-min/15-min). Limitations: SMAs lag more than EMAs, potentially missing early trend entries. Requires monitoring multiple charts, which can be time-intensive without automation. Viewing Higher Time Frame Trends from a Lower Time Frame One of the key benefits of MTF analysis is the ability to "see" higher time frame trends directly on a lower time frame chart, without switching views constantly. This is achieved through anchored or overlaid indicators that project higher-period data onto the lower chart. How It Enables Trend Tracking: Overlay Technique: On a lower time frame (e.g., 15-minute), plot SMAs or EMAs calculated from higher time frame data. For example: Use a 50-period SMA on a daily chart, but recalculate it for the 15-minute chart by multiplying periods (since there are about 96 15-minute bars in a trading day, a daily 50-SMA might approximate to a 4800-period SMA on 15-min). Tools like TradingView allow "higher time frame" scripts to fetch and display this directly. Trend Visibility: From the lower frame, you can observe if the price is above/below the higher-frame SMA, indicating the overall trend. A crossover on the lower frame that aligns with the higher frame's direction confirms momentum. Example: On a 5-minute chart (lower TF), if the overlaid daily 200-SMA acts as support (price bounces off it), it shows the higher TF uptrend is intact, even amid intraday dips. This helps avoid selling into a pullback during a broader bull market. Practical Benefits: Early Detection: Lower TFs show granular price action, revealing how higher TF trends are forming in real-time (e.g., a building crossover on daily visible as momentum buildup on hourly). Risk Management: Use higher TF levels for stop-losses while entering on lower TF signals. Example Strategy: In forex, on a 1-hour chart, confirm the 4-hour SMA trend is bullish, then wait for a 1-hour EMA crossover for entry. This way, you're "zooming in" on the big trend without losing context.Pine Script®指标由akghuf19ag24提供1116
Initial Balance Statistical MappingInitial Balance Statistical Mapping Overview The Initial Balance (Enhanced) indicator is a sophisticated trading tool designed specifically for NQ (Nasdaq-100 E-mini Futures) during New York trading hours. It provides data-driven insights based on comprehensive analysis of 12 years of 1-minute price data (2013-2025), offering traders probabilistic forecasts for intraday price movement based on the market's behavior during the critical first hour of trading. What is Initial Balance? Initial Balance (IB) refers to the price range established during the first hour of the New York cash session (9:30-10:30 AM ET). This concept, pioneered by legendary trader Peter Steidlmayer as part of Market Profile theory, represents a critical period where the market establishes its initial value area for the day. The IB high and low create key reference points that professional traders use throughout the session to: Identify potential support and resistance levels Gauge market directional bias Set realistic profit targets Assess market volatility and range expectations Statistical Foundation This indicator is built on rigorous statistical analysis of 12+ years of NQ futures data (over 3,000 trading sessions), examining: Opening Range Patterns: 5-minute and 15-minute opening ranges Initial Balance Characteristics: Directional bias, extreme formation sequence, and closing position Breakout Behavior: Which IB boundary breaks first and subsequent price action Midpoint Dynamics: Probability and timing of midpoint retests Session Outcomes: Correlation between IB patterns and daily close direction Extension Targets: Historical percentile-based price projections beyond IB boundaries The statistical combinations tracked include: IB direction (bullish vs bearish) × Extreme formed first (high vs low) × Close position (above vs below midpoint) Post-break behavior (confirmation, reversal, or range-bound) Conditional probabilities for over 16 unique market scenarios Visual Components 1. IB Box A shaded rectangular area highlighting the first hour's price range: Top boundary: IB High Bottom boundary: IB Low Midpoint line: The 50% level of the IB range Customizable colors for the fill, border, and midpoint 2. Extension Levels Percentile-based price targets above and below the IB boundaries, calculated from historical extension data: Above IB High: 25th percentile: +0.14% extension Median (50th): +0.31% extension (default display) 75th percentile: +0.60% extension 90th percentile: +1.00% extension Below IB Low: 25th percentile: -0.16% extension Median (50th): -0.38% extension (default display) 75th percentile: -0.79% extension 90th percentile: -1.37% extension These levels represent targets that historically occur at the specified frequency. For example, the median extension suggests that 50% of the time, the market extends at least this amount beyond the IB boundary when it breaks out. 3. Statistics Table A dynamic information panel displaying real-time probabilities and historical context (detailed in "Interpreting the Statistics Table" section below). Input Parameters Calculation Period IB Period: Default 0930-1030 (9:30-10:30 AM ET) Defines the time window for Initial Balance calculation Should match the first hour of NY cash session Regular Trading Hours: Default 0930-1600 (9:30 AM - 4:00 PM ET) Extension lines only display during these hours Statistics table appears during RTH only Prevents visual clutter during overnight sessions Display Options Show IB Box: Toggle the shaded IB range rectangle Only Show Current IB: When enabled, previous days' IB boxes are removed (keeps chart clean) Show Extension Labels: Display percentile labels on extension lines Show Extensions: Individual toggles for each extension level Colors IB Box Color: Customize the shaded range fill (default: semi-transparent blue) Box Border Color: Border line color (default: gray) Midpoint Color: Midpoint line color (default: gray) Extension Color: All extension lines and labels (default: blue) Styling Line Style: Choose Solid, Dashed, or Dotted for IB box borders and midpoint Extension Line Style: Separate style control for extension levels Extension Line Width: 1-4 pixels thickness Extension Label Size: Tiny/Small/Normal/Large/Huge Statistics Table Table Position: 9 placement options (corners, edges, center) Table Size: Auto/Tiny/Small/Normal/Large/Huge Sessions for IB Stats: Number of previous sessions (5-250) to calculate rolling IB range statistics Higher values = more stable averages Lower values = more responsive to recent market conditions Default: 50 sessions Interpreting the Statistics Table The statistics table is the analytical core of this indicator, providing probabilities derived from 12 years of historical NQ data. It updates in real-time as the trading day progresses. Section 1: IB Characteristics IB Direction Bullish (green): IB close > IB open Bearish (red): IB close < IB open This reflects whether the first hour closed higher or lower than it opened Extreme First High First: The IB high was established before the IB low during the first hour Low First: The IB low was established before the IB high This sequence often indicates early momentum direction Close Position Above Midpoint: IB close is above the midpoint of the IB range Below Midpoint: IB close is below the midpoint This shows where buying/selling pressure finished within the range Section 2: Historical Pattern & Probabilities Historical Pattern Shows the number of sessions (out of 3,000+) that match the current IB combination Example: "151 sessions" means this exact pattern (e.g., Bullish + High First + Close Above Mid) occurred 151 times Larger sample sizes (>100) provide more reliable probabilities Smaller samples (<50) should be interpreted with appropriate caution Next Break Predicts which IB boundary will break first: HIGH: Price likely to exceed IB high before IB low LOW: Price likely to breach IB low before IB high Neither: Higher probability that both boundaries remain intact for the session Shows the highest probability outcome with its percentage Based on what actually happened in similar historical sessions Midpoint Retest Probability that price will return to the IB midpoint at some point during the session Initially shows "PENDING" status (orange) Updates to "✓ CONFIRMED" (green) when the midpoint is touched after IB formation Calculated based on sessions where price left the midpoint (>0.1% threshold) and returned Average/median time to retest is tracked in the underlying data Session Close Highlighted row (green background): The key predictive metric Predicts whether the NY cash session (9:30 AM - 4:00 PM ET) will close: Bullish: Close > IB open (green) Bearish: Close < IB open (red) Shows the probability of the more likely outcome This is arguably the most actionable statistic for directional bias Section 3: IB Range Statistics Current Range The actual point value of today's IB range (IB High - IB Low) Useful for comparing to historical norms Mean (X/Yd) Average IB range over the lookback period "X/Y" indicates X sessions were captured out of Y lookback days May be less than lookback if some days had incomplete data or early closures Percentile Rank (color-coded cell) Shows where today's IB range ranks relative to recent sessions: Blue tint (<20th percentile): Unusually narrow range - expect potential expansion Light gray (20-60th): Normal range Dark gray (60-80th): Above average range Red tint (>80th percentile): Unusually wide range - may indicate high volatility or potential consolidation Format: "92nd" means today's range is larger than 92% of the last n sessions (n is defined by the lookback period) Section 4: Post-Break Analysis (Dynamic Section) This section appears only after the IB high or IB low is broken, replacing the standard table with expanded statistics. ━ IB HIGH BROKEN ━ or ━ IB LOW BROKEN ━ Orange header indicates which boundary was exceeded Triggers when price definitively breaks through IB high or low Historical Breaks Number of times this specific pattern (IB direction + close position + break direction) occurred historically Example: "1134 times" means this combination has broken the IB high 1,134 times in the dataset Mid Retest Prob Probability that price will return to test the IB midpoint after breaking out Critical for entry/re-entry decisions and stop placement Percentages typically range from 40-65% depending on the pattern If Retest Occurs: Shows three potential outcomes if the midpoint is retested after the break: Bounce Back UP/DOWN (Confirmation - green text) After breaking IB high and retesting midpoint → bounces back up (confirms bullish breakout) After breaking IB low and retesting midpoint → bounces back down (confirms bearish breakdown) This is the "successful retest" scenario traders often look for Reverse to LOW/HIGH (Reversal - red text) After breaking IB high and retesting → reverses and breaks IB low (failed breakout) After breaking IB low and retesting → reverses and breaks IB high (failed breakdown) The "trap" scenario that catches breakout traders Stays in Range (neutral text) Price retests midpoint but then remains between the midpoint and the opposite IB extreme No additional breakout in either direction Consolidation/balance scenario Example Interpretation: ━ IB HIGH BROKEN ━ Historical Breaks: 1134 times Mid Retest Prob: 44.9% If Retest Occurs: Bounce Back UP : 41.3% (confirms the high break) Reverse to LOW : 39.1% (breaks IB low instead) Stays in Range : 19.6% (consolidates) This tells you: This pattern has broken the IB high 1,134 times historically There's a 44.9% chance price will retest the midpoint after breaking IF it retests, there's roughly an equal chance it bounces back up (41.3%) or reverses to break the low (39.1%) Only 19.6% of retests result in consolidation This would be a high-risk breakout due to the near-equal probability of confirmation vs. reversal How the Statistics Are Calculated Data Collection Methodology The Python analysis script processes: 12+ years of 1-minute NQ futures data (2013-2025) 3,000+ trading sessions Only NY cash session data (9:30 AM - 4:00 PM ET) Adjusted for early closures (holidays, half days) Conditional Probability Framework The indicator uses a nested conditional probability structure: Level 1: IB Direction Bullish (close > open) vs Bearish (close < open) Level 2: IB Extreme Sequence High First vs Low First Determined by which extreme was reached first during IB formation Level 3: IB Close Position Close Above Midpoint vs Close Below Midpoint Where within the range did the IB close? Level 4: Break Direction Which boundary broke first after IB? High Breaks / Low Breaks / Neither Level 5: Midpoint Retest Behavior (post-break) Did midpoint get retested after break? If yes: Confirmed / Reversed / Stayed in Range This creates specific combinations like: "Bullish IB + Low First + Close Above Mid" → 76.7% bullish session close (1,281 historical occurrences) "Bearish IB + High First + Close Below Mid" → 73.9% breaks low first (1,127 occurrences) Extension Percentile Calculations For each session, the maximum extension beyond each IB boundary is measured: High Extension: (Session High - IB High) / IB High × 100 Low Extension: (IB Low - Session Low) / IB Low × 100 These extensions are collected across all sessions, and percentiles are calculated: 25th percentile: 25% of sessions extend at least this far 50th percentile (Median): 50% of sessions extend at least this far 75th percentile: 75% of sessions extend at least this far 90th percentile: 90% of sessions extend at least this far Note: Sessions with no extension (price never exceeded the IB boundary) are included in the dataset as zero-extension values. This is statistically important because it means: The median extension of +0.31% above IB high means 50% of ALL sessions (including those that never broke the high) extended at least this far This is a conservative, realistic measure of actual market behavior IB Range Percentile Rank The rolling percentile rank compares today's IB range to the previous N sessions (default 50): Collect IB ranges for the past 50 sessions Count how many of those ranges were smaller than today's range Divide by total sessions and multiply by 100 Example: If 34 of the past 50 sessions had smaller IB ranges than today: Percentile = (34/50) × 100 = 68th percentile Today's range is larger than 68% of recent sessions Real-Time Validation & Updates The statistics table evolves as the trading day progresses: Pre-IB Formation (9:30-10:30 AM) Table shows "PENDING" for all fields in orange No predictions yet, as IB hasn't formed Useful as a reminder that IB is still forming IB Formation Complete (10:30 AM) All IB characteristics are determined and displayed Historical pattern sample size is shown Probabilities are populated based on the specific IB combination "Midpoint Retest" shows expected probability with "PENDING" status During Trading Session (10:30 AM - 4:00 PM) Midpoint Retest status updates from "PENDING" to "✓ CONFIRMED" if midpoint is touched Table remains stable showing initial probabilities Extension levels continue to be displayed After IB Breakout Entire table is dynamically rebuilt when IB high or low is broken Post-break statistics section is added Shows refined probabilities specific to the break direction Midpoint retest probability is now specific to post-break behavior End of Session (4:00 PM) Table is removed from chart IB box and extensions remain visible for reference Resets for next trading session Practical Trading Applications 1. Directional Bias Use the "Session Close" prediction to establish your directional bias for the day Higher percentages (>70%) suggest stronger historical edge Consider trading with the bias rather than against it 2. Breakout Trading "Next Break" probability helps anticipate which boundary is more likely to break Wait for confirmation, but prepare for the higher-probability direction Use extension levels as initial profit targets 3. Mean Reversion High "Midpoint Retest" probabilities (>80%) suggest mean reversion opportunities After a break, if retest probability is high, consider waiting for the pullback Post-retest statistics help determine whether to fade or trade with the move 4. Risk Management Wide IB ranges (>75th percentile) may suggest: Higher volatility day requiring wider stops Potential for consolidation or smaller extensions More challenging trading conditions Narrow IB ranges (<25th percentile) may suggest: Compressed volatility ready to expand Potential for larger extensions when breakouts occur Clearer directional moves 5. Trade Filtering Use the statistics to avoid low-probability setups If "Session Close" and "Next Break" align (both bullish or both bearish), confidence is higher Conflicting signals suggest a more balanced, range-bound day 6. Exit Strategy Extension percentiles provide logical profit targets: Conservative: 25th percentile (smaller move, higher hit rate) Moderate: 50th percentile (median expectation) Aggressive: 75th-90th percentile (larger move, lower hit rate) After a midpoint retest, use the post-retest probabilities to decide whether to hold or exit Important Notes & Disclaimers Timeframe Specificity This indicator is designed exclusively for NQ futures Statistics are derived from NY cash session hours only (9:30 AM - 4:00 PM ET) Do not use on other instruments or timeframes without independent validation The IB period should always be set to the first hour of the NY session Statistical Interpretation Probabilities are not certainties - a 70% probability means 30% of the time the opposite occurs Sample size matters - combinations with <50 occurrences should be treated with caution Market conditions evolve - the 12-year dataset includes various market regimes, but future behavior may differ Past performance ≠ future results - these statistics are educational and analytical tools, not guarantees Best Practices Use this indicator as one component of a comprehensive trading plan Combine with price action, volume analysis, and market context Paper trade strategies based on these statistics before risking real capital Keep a trading journal to track how probabilities play out in real-time Adjust position sizing based on probability strength and your risk tolerance Data Quality Statistics are based on continuous NQ futures data (rollover-adjusted) Early session closures, half days, and holidays are included in the dataset Gaps and overnight moves are not considered in the analysis (only RTH data) The indicator auto-detects early closures and adjusts the RTH end time accordingly Technical Requirements Platform: TradingView (Pine Script v5) Instrument: NQ (Nasdaq-100 E-mini Futures) recommended; adaptable to ES or YM with separate validation Timeframe: Works on any intraday timeframe (1-min, 5-min, 15-min, etc.) Lower timeframes (1-5 min) recommended for precision Session Settings: Chart timezone should be set to "America/New_York" or equivalent for accurate IB timing Data Requirements: Sufficient historical data to populate IB range statistics (minimum 50 sessions) Version History & Updates Current Version: Enhanced Initial Balance with Conditional Statistics (v1.0) Key Features: 12-year statistical foundation (2013-2025) 16+ conditional pattern combinations Dynamic post-break analysis Real-time midpoint retest validation Percentile-based extension targets Rolling IB range analysis Comprehensive statistics table Conclusion The Initial Balance (Enhanced) indicator transforms 12 years of market data into actionable, probabilistic insights for NQ traders. By understanding the historical behavior of specific IB patterns, traders can: Make more informed directional decisions Set realistic profit targets based on statistical extension frequencies Anticipate mean reversion opportunities with midpoint retest probabilities Manage risk with context-aware range analysis Avoid low-probability setups and focus on higher-edge opportunities This is not a "black box" system or a magic formula. It's a transparent, data-driven framework that provides historical context to inform your trading decisions. The statistics table doesn't tell you what will happen - it tells you what has historically happened when similar patterns emerged, allowing you to trade with probabilistic edges rather than guesses.Pine Script®指标由lucymatos提供22540
Kerbal_BreadthLibrary "kerbal_breadth" Kerbal Indicators Shared Library - Breadth Analysis This library provides functions for analyzing market breadth indicators including Advance/Decline lines, Bullish Percent Index, and breadth divergence detection. getAdvDecLine() Get NYSE Advance/Decline line Returns: NYSE A/D line value getAdvDecRatio() Get NYSE Advance/Decline ratio Returns: NYSE Advance/Decline ratio advDecSlope(length) Calculate A/D line slope (rate of change) Parameters: length (int) : Period for slope calculation Returns: A/D line slope (positive = breadth improving, negative = deteriorating) advDecDivergence(priceHigh, priceHighBar, lookback) Detect A/D line divergence with price Parameters: priceHigh (float) : Recent price high priceHighBar (int) : Bar index of price high lookback (int) : Bars to look back for divergence Returns: Tuple - true if divergence detected getBullishPercentNYSE() Get Bullish Percent Index for NYSE Returns: NYSE BPI value (0-100 scale) getBullishPercentSPX() Get Bullish Percent Index for S&P 500 Returns: SPX BPI value (0-100 scale) getBullishPercentNDX() Get Bullish Percent Index for Nasdaq Returns: NDX BPI value (0-100 scale) bpiRegime(bpi, oversoldThresh, overboughtThresh) Classify BPI regime Parameters: bpi (float) : BPI value (0-100) oversoldThresh (float) : Oversold threshold (contrarian bullish) overboughtThresh (float) : Overbought threshold (contrarian bearish) Returns: Regime: "OVERSOLD", "BULLISH", "NEUTRAL", "BEARISH", "OVERBOUGHT" pctAbove200MA_SPX() Get percentage of S&P 500 stocks above their 200-day MA Returns: Percentage (0-100) pctAbove50MA_SPX() Get percentage of S&P 500 stocks above their 50-day MA Returns: Percentage (0-100) breadthHealth(pct200, pct50) Analyze breadth health based on MA participation Parameters: pct200 (float) : Percentage above 200-day MA pct50 (float) : Percentage above 50-day MA Returns: Health assessment: "STRONG", "HEALTHY", "WEAK", "POOR" breadthThrust(period, threshold) Detect breadth thrust (rapid improvement in breadth) Parameters: period (int) : Measurement period threshold (float) : Minimum improvement threshold Returns: True if breadth thrust detected breadthScore(advDecSlope, bpi, pct200) Calculate composite breadth score Parameters: advDecSlope (float) : A/D line slope bpi (float) : Bullish Percent Index value pct200 (float) : Percentage above 200-day MA Returns: Breadth score 0-100 (higher = better breadth) currentBreadthScore() Get current composite breadth with all data retrieval Returns: Composite breadth score 0-100 breadthBearishDivergence(priceHigh, prevPriceHigh, currentBreadth, prevBreadth) Detect bearish breadth divergence Parameters: priceHigh (float) : Current price high prevPriceHigh (float) : Previous price high currentBreadth (float) : Current breadth score prevBreadth (float) : Previous breadth score Returns: True if bearish divergence (price up, breadth down) breadthBullishDivergence(priceLow, prevPriceLow, currentBreadth, prevBreadth) Detect bullish breadth divergence Parameters: priceLow (float) : Current price low prevPriceLow (float) : Previous price low currentBreadth (float) : Current breadth score prevBreadth (float) : Previous breadth score Returns: True if bullish divergence (price down, breadth up) breadthConfirmsBullish(breadthScore, minScore) Check if breadth confirms bullish price action Parameters: breadthScore (float) : Current breadth score (0-100) minScore (float) : Minimum acceptable breadth score Returns: True if breadth is confirming breadthConfirmsBearish(breadthScore, maxScore) Check if breadth confirms bearish price action Parameters: breadthScore (float) : Current breadth score (0-100) maxScore (float) : Maximum acceptable breadth score Returns: True if breadth is confirming breadthWarning(breadthScore, priceAction) Detect breadth warning signals Parameters: breadthScore (float) : Current breadth score priceAction (int) : Recent price direction (1 = up, -1 = down, 0 = neutral) Returns: Tuple marketHealthFromBreadth(breadthScore, hasThrust, divergenceType) Comprehensive market health from breadth indicators Parameters: breadthScore (float) : Composite breadth score hasThrust (bool) : Whether breadth thrust detected divergenceType (int) : Divergence type: 1 = bearish, -1 = bullish, 0 = none Returns: Health string: "EXCELLENT", "GOOD", "FAIR", "POOR", "WARNING" marketHealth(sentimentScore, breadthScore) Combined sentiment and breadth confirmation Parameters: sentimentScore (float) : Sentiment score from kerbal_sentiment library (0-100) breadthScore (float) : Breadth score (0-100) Returns: Tuple Pine Script®库由Kerbal提供0
Adaptive Channel Breakout [MarkitTick]💡 This script is a trend-following system designed to identify high-probability breakout opportunities while rigorously filtering out market noise. By synthesizing volatility (ATR), trend strength (ADX), and price extremes (Donchian logic), this indicator attempts to solve the classic problem of false breakouts in ranging markets. It features a regime-detection engine that dynamically adjusts the visual feedback and signal generation based on whether the market is trending or consolidating. ✨ Originality and Utility Most breakout indicators rely solely on price crossing a fixed threshold (like a 20-day High). However, these systems often fail in "choppy" markets where price seeks liquidity above highs before reversing. This script innovates by: Volatility-Adjusted Bounds: It does not simply track the Highest High or Lowest Low. Instead, it retracts the channel bounds by a multiple of the Average True Range (ATR). This creates a "tightened" breakout requirement—price must not only make a new high but do so with enough momentum to overcome the volatility threshold. Regime Filtering: Integrated ADX/DMI logic categorizes the market into Bull, Bear, or Range. Signals are filtered to align with the dominant regime (e.g., no Longs are permitted if the internal structure is Bearish). Logarithmic Scaling: A unique feature allowing calculations to be performed on Logarithmic price data, making it highly suitable for parabolic assets like Crypto or small-cap stocks where linear percentage moves vary drastically. Time-Based Exits: Recognizes that "stale" trades—those that do not perform immediately—often turn into losses, and provides visual cues to exit if momentum stalls. 🔬 Methodology and Concepts The core logic operates on a three-stage pipeline: 1. Market Regime Classification The script utilizes the Directional Movement Index (DMI) and Average Directional Index (ADX) to determine the state of the market. Trending: Defined as ADX > Threshold (default 25). Range: Defined as ADX < Threshold. Direction: Determined by the relationship between DI+ and DI-. 2. Adaptive Channel Construction The channels are calculated using a modified Donchian/ATR hybrid approach: Upper Band: Highest High (N) minus (ATR × Multiplier) . Lower Band: Lowest Low (N) plus (ATR × Multiplier) . Note: By subtracting ATR from the High, the Upper Band acts as a trailing resistance level that gets closer to price as volatility decreases, allowing for earlier entries during volatility squeezes. 3. Signal Generation & Filtering Long Signal: Price crosses over the Upper Band, provided the market is in a Bull or Range regime. Short Signal: Price crosses under the Lower Band, provided the market is in a Bear or Range regime. Stale Exit: If a signal is generated but price fails to reverse or progress significantly within a user-defined bar limit (default 10), a "Time Exit" warning is triggered. 🎨 Visual Guide The indicator is designed for immediate visual interpretation through color-coding and dashboard analytics. ● Channel Bands Upper Line: Represents the dynamic resistance/breakout level. Lower Line: Represents the dynamic support/breakout level. Color Logic: Gray: Indicates the opposing side of the trend (e.g., Upper band is gray during a downtrend). Green: Active Upper Band during a Bullish phase. Red: Active Lower Band during a Bearish phase. ● Background Fills (Market Regime) The space between the channels is filled to indicate the current market state: Green Fill: Bullish Trend (ADX High, DI+ > DI-). Red Fill: Bearish Trend (ADX High, DI- > DI+). Yellow Fill: Range/Accumulation (ADX Low). Breakouts from Yellow zones are often the most explosive. ● Signal Shapes Green Triangle (Below Bar): Valid Long Breakout Signal. Red Triangle (Above Bar): Valid Short Breakout Signal. Orange "X" (Below Bar): Time Exit/Stale Trade. Indicates the trade has not progressed after N bars. ● Dashboard (Top Right) A table displaying real-time metrics: Market Regime: Explicitly states TREND (Bull/Bear) or RANGE. Volatility: Displays the current ATR value. ADX Strength: Shows the ADX value, highlighting it in white if it is above the trending threshold. 📖 How to Use For Trend Following Wait for the background color to transition from Yellow (Range) to Green (Bull) or Red (Bear). This signifies a volatility expansion from a consolidation period. Enter on the corresponding Triangle signal. For Risk Management Stop Loss: The script calculates suggested Stop Losses (SL) based on the opposite channel band. Stale Exits: If you see an Orange "X" appear after entering a trade, consider closing the position or tightening stops, as the momentum impulse has faded. For Crypto/Parabolic Assets Enable the "Use Logarithmic Scale" setting in the inputs. This normalizes the volatility calculations, preventing the bands from becoming too wide during exponential price increases. ⚙️ Inputs and Settings Adaptive Parameters Lookback Length (20): The period for High/Low and ATR calculations. ATR Multiplier (3.2): Determines the width of the channel. Higher values reduce false signals but delay entry. (3.2 is tuned for outlier detection). Use Logarithmic Scale: Toggles math.log() calculations for High, Low, and Close. Filters & Exits ADX Threshold (25): The level at which the market is considered "Trending." Time Exit (Bars) (10): The number of bars allowed for a trade to "work" before being flagged as stale. UI / Dashboard Show Analytics Dashboard: Toggles the on-screen information table. Size: Adjusts the text size of the dashboard (Tiny, Small, Normal). 🔍 Deconstruction of the Underlying Scientific and Academic Framework 1. Outlier Detection Theory The script uses an ATR Multiplier of 3.2. In normal statistical distributions, 3 standard deviations cover 99.7% of data points. While financial markets are leptokurtic (fat-tailed), a multiplier of 3.2 on the ATR effectively acts as an outlier filter. A breach of this band signifies a price movement that is statistically significant relative to recent noise, suggesting a structural shift in supply/demand rather than random variance. 2. Heteroscedasticity Handling By including a Logarithmic option, the script addresses heteroscedasticity—the phenomenon where the variability of a variable is unequal across the range of values. In simpler terms, a $100 move in Bitcoin at $1,000 is different from a $100 move at $60,000. Using log-returns (math.log) ensures the channel width remains proportionally relevant regardless of the asset's absolute price level. 3. Trend Efficiency (ADX) The integration of J. Welles Wilder’s ADX serves as a filter for "Trend Efficiency." Breakout systems suffer drawdown in mean-reverting markets. By mathematically requiring ADX > 25, the model attempts to trade only when the autocorrelation of price changes is positive (trending behavior), thereby increasing the expectancy of the breakout signal. ⚠️ Disclaimer All provided scripts and indicators are strictly for educational exploration and must not be interpreted as financial advice or a recommendation to execute trades. I expressly disclaim all liability for any financial losses or damages that may result, directly or indirectly, from the reliance on or application of these tools. Market participation carries inherent risk where past performance never guarantees future returns, leaving all investment decisions and due diligence solely at your own discretion.Pine Script®指标由MarkitTick提供22216
Volume Imbalance Engine [BTT]█ Overview Volume Imbalance Engine is a real-time volume structure analyzer that detects buyer/seller dominance at every price level and generates actionable entry signals. Unlike traditional volume profile tools that draw static histograms, this indicator colors your candles, marks live void zones, and fires precise entries — so you can read the market at a glance. The core engine builds a rolling volume profile behind the scenes, classifies each price level as buyer-controlled, seller-controlled, void, or balanced, then projects that information directly onto your price action. █ How It Works Imbalance Detection The engine scans a configurable lookback window and divides the price range into granular rows. For each row, it accumulates bullish volume (close > open bars) and bearish volume (close ≤ open bars) based on how much of each bar's range overlaps that price level. This produces a bull/bear percentage at every price — revealing who truly controls each zone. Candle Coloring Each candle is painted according to the volume imbalance at its price level: • Bright green — strong buyer dominance (configurable threshold, default 65%) • Light green — mild buyer advantage • Bright red — strong seller dominance • Light red — mild seller pressure • Gray — balanced or insufficient data This gives you an instant visual map of where buyers and sellers have been active without cluttering your chart. Volume Voids When the engine detects a price level with near-zero historical volume, it marks it as a void zone — an orange box extending to the right. These are true untraded regions where price moved so fast that no liquidity exchanged hands. Void boxes automatically close when price revisits and fills the zone. You can control the maximum number of visible voids to keep your chart clean. Entry Signals Two distinct signal types, both requiring volume surge + EMA trend confirmation: • VOID — Price enters a previously untraded zone with above-average volume in the direction of the trend. These zones act as liquidity magnets and often produce sharp reactions. • FLIP — Price reclaims a level that was dominated by the opposite side. A bearish zone broken to the upside with volume = bullish flip signal, and vice versa. This captures momentum shifts at structurally significant levels. Signals are deduplicated (no repeats within 3 bars) to avoid noise. Delta Ribbon The trend EMA line is dynamically colored by the smoothed volume delta at the current price level. Green shades indicate net buying pressure, red shades indicate net selling pressure. This acts as both a trend filter and a visual delta indicator without taking extra chart space. Info Panel A compact table in the top-right corner displays: • Bull Volume % at current price level • Bear Volume % at current price level • Net Delta % • Current zone classification (VOID / BUYERS / SELLERS / BALANCED) █ How to Use Follow the Candle Colors Green candles in a sequence = price moving through buyer-controlled territory. When you see a transition from red to green with a FLIP label — that's a structural shift worth watching. Trade the Voids Void zones are unfinished business. When price approaches an orange box with momentum (volume surge + trend alignment), the VOID signal fires. These setups work well as continuation entries in trending markets. Confirm with Delta Ribbon Use the colored EMA as a directional filter. Taking longs when the ribbon is green and shorts when it's red keeps you aligned with the dominant volume flow. Monitor the Info Panel The panel gives you a real-time read on market structure at your current price. "VOID" means you're in thin air. "BUYERS" or "SELLERS" tells you who built this level. Use it for context before entering or managing trades. █ Settings Imbalance Engine • Analysis Window — Number of bars scanned for the volume profile (default: 80) • Price Resolution — Number of price rows in the profile (default: 30) • Imbalance Threshold — Minimum bull or bear share to classify a level as imbalanced (default: 65%) Entry Signals • Void Fill Entries — Enable/disable VOID signals • Imbalance Flip Entries — Enable/disable FLIP signals • Trend Filter EMA — EMA period for directional confirmation (default: 21) • Volume Surge Multiplier — Current volume must exceed average × this value (default: 1.2) Candle Coloring • Fully customizable colors for each dominance level Void Zones • Void Zone Color and Max Visible Voids Delta Ribbon • Show/hide and smoothing period █ Alerts • Long Signal — Fires on any bullish entry (VOID or FLIP) • Short Signal — Fires on any bearish entry (VOID or FLIP) • Any Signal — Fires on both ----------------- Disclaimer The content provided in this script is for educational and informational purposes only. It does not constitute financial advice, investment recommendations, or a solicitation to buy or sell any financial instruments. All investments involve risk, and past performance does not guarantee future results. Users are fully responsible for any investment decisions they make.Pine Script®指标由Mark_Novak提供11
AMT Institutional Model v2What This Indicator Does This indicator implements Fabio Valentini's Auction Market Theory (AMT) model — the same framework used by a verified World Cup Trading Championship competitor who achieved 218% audited returns in a single competition year. The core principle is simple: The market is an auction. It moves between two states — Balance (choppy, no edge) and Imbalance (trending, tradeable). Most traders lose because they trade inside balance. This indicator tells you when to sit out and when conditions are aligned for entry. It is a MODEL, not a strategy. It does not give buy/sell signals. It gives you the 3 conditions Valentini requires before any trade, and visually shows you when all 3 align. The 3 Conditions (ALL Must Be True Before Entry) Valentini's rule: "If even one is missing, you stay flat." #ConditionWhat the indicator shows1Market State — Is the market OUT of balance?Background color: Yellow = Balance (DO NOT TRADE). Blue/Red = Imbalance (OK to look)2Location — Is price at a meaningful level?LVN lines (magenta), Support/Resistance (green/red dashes), HVN (yellow), POC (orange)3Aggression — Are large participants executing?Blue circles below bar = Buyer aggression. Red circles above bar = Seller aggression When all 3 align, a green diamond (bull) or red diamond (bear) appears. This is the confluence signal — the premium setup. How To Read The Chart — Step by Step STEP 1 — Check the Balance Box (yellow dashed rectangle) This is the Value Area where 70% of volume was traded. Think of it as a "no-fly zone." Price INSIDE the box → Info table says "Inside VA - Skip" → Do nothing Price OUTSIDE the box → Now you can start looking for setups Valentini: "Market is usually in balance. That is why traders take a streak of stop-losses." The Balance Box keeps you out of the chop. STEP 2 — Check the Background Color 🟡 Yellow tint = Balance. Market is compressed. Stay flat. 🔵 Blue tint = Imbalance Bullish. Trend is up. Look for longs only. 🔴 Red tint = Imbalance Bearish. Trend is down. Look for shorts only. You need BOTH: price outside the Balance Box AND background showing Imbalance. STEP 3 — Find Your Level Look for price approaching one of these levels: LVN (magenta dashed) — Low Volume Nodes. Price rejected here before and will likely react again. These are Valentini's primary entry zones. When price revisits an LVN, it either rips through (continuation) or bounces (reversal). Wait for aggression to confirm which one. HVN (yellow solid) — High Volume Nodes. Price accepted here = consolidation zones. Good for targets, not entries. POC (orange thick) — Point of Control. Highest volume price = "fair value." Strong magnet. Good for mean-reversion targets. 30m S/R (green/red dashed) — Auction pivot structure from the 30-minute timeframe. Weekly/Daily/4H levels — Institutional reference levels. Confluence of multiple levels = stronger zone. Fibonacci levels — Labeled with source timeframe (D = Daily, W = Weekly) so you always know where the level comes from. STEP 4 — Wait for Aggression Do NOT enter just because price is at a level. Wait for the circles (bubbles): 🔵 Blue circle below bar = Buyer aggression (volume spike + bullish close) 🔴 Red circle above bar = Seller aggression (volume spike + bearish close) Circle size = intensity (small → normal → large = 2x → 3.5x → 5x+ volume) Valentini: "When there is direction, location, and aggression — your ability to READ is 100%." Entry Checklist (Long Example) ✅ Background is blue (Imbalance Bullish) ✅ Price is outside the Balance Box (above VAH or pulled back below VAL) ✅ Price is at or near an LVN, Support level, or Fibonacci level ✅ A blue circle appears below the bar (buyer aggression confirmed) ✅ 30-min trend line is blue (uptrend structure) Enter long. Stop below the LVN / support level. For shorts, mirror everything: red background, near resistance/LVN, red circle above bar, red trend line. Exit Rules Exit TypeWhenPrimary targetThe POC (orange line). Valentini: "Target the previous balance POC — 70% of the time, price reverses from it."Secondary targetThe next HVN (yellow line). Price tends to slow down and consolidate at HVNs. Take partial profits here.Structural targetThe next major Weekly/Daily level or Fibonacci level in the direction of your trade.Failed auction exitIf you're long and an X cross appears above your bar — this means aggressive buyers failed. The sellers won. Close immediately.Re-entry of Balance BoxIf price re-enters the Value Area after breaking out, the breakout may have failed. Tighten stop or exit. This is Valentini's Mean Reversion Model — the snap-back.Opposite aggressionLarge red circles appearing in your long trade = institutional selling. Reduce size or exit. What Each Module Does Module A — 30-Min Trend (blue/red step-line) Auction-based trend structure from 30-minute Higher-Highs/Higher-Lows. Not a moving average — this is structural. Module B — 30-Min S/R (green/red dashed) Pivot-based support and resistance from 30-minute auction structure. Sensitivity setting controls how many levels appear. Module C — Aggression Bubbles (circles + X crosses) Volume spike detection with directional body filter. 3 size tiers. X crosses mark failed auctions — when aggression fails and price reverses. Module D — MTF Levels (colored horizontal lines) Weekly, Daily, 4H, Hourly OHLC levels + Daily/Weekly Fibonacci retracements (labeled with source TF) + 20/50 SMA + Psychological round numbers. All line colors and widths fully customizable. Module E — Balance/Imbalance (background color) ATR compression ratio detects whether market is ranging or trending. Yellow = stay out. Blue/Red = conditions forming. Module F — Volume Profile (HVN/LVN/POC/Balance Box) Bin-based volume distribution over configurable lookback. Same methodology as ATAS, Sierra Chart, and TradingView's own SVP. Draws the Value Area box (skip trades inside), POC, and all significant volume nodes. Settings Guide Sensitivity — The single most important setting. Low = Strict. Fewer levels, fewer bubbles, only the strongest signals. For experienced traders who want a clean chart. Medium = Balanced. Recommended default. High = Sensitive. More signals, catches weaker setups. Good for learning or scalping. Futures vs ETF — Futures (NQ/ES/YM) have concentrated RTH volume so lower multipliers work. ETFs (SPY/QQQ) need higher thresholds to filter dark-pool noise. Label Mode — "Detailed" for learning, "Short" for clean charts once you know the levels. Label Size — Auto/Tiny/Small/Normal/Large. All labels respect this setting. Important Limitations ⚠️ No true order flow. TradingView does not provide tick-by-tick data, DOM, or executed vs. limit order differentiation. Aggression bubbles are a volume-spike proxy, not true order flow. For real order flow, use platforms like Bookmap, ATAS, or Sierra Chart alongside this indicator. ⚠️ Volume profile is approximated. Each bar's volume is proportionally distributed across its price range. Real volume-at-price requires tick data. This is the standard approximation used by all Pine Script volume profile implementations. ⚠️ This is a model, not a strategy. It shows conditions. You make the decision. No indicator replaces screen time and discretion. Alerts Available (12 total, all configurable ON/OFF) Bull Confluence | Bear Confluence | Failed Buy Auction | Failed Sell Auction | Huge Buy Volume (5x+) | Huge Sell Volume (5x+) | Balance/Imbalance Shift | 30-Min Trend Change | Any Aggression | Price at Key Level | Price Exits Value Area | Price at POC Built for NQ/ES futures day trading. Works on any liquid instrument with volume data. Not financial advice. Pine Script®指标由Fu3k_8提供38
QuantumPips Session Trend StructureQuantumPips Session Trend Structure is an indicator built to help you read session structure and spot higher-quality breakout → retest opportunities when trend and momentum conditions agree. It does three main things: Maps sessions (Asia / London / New York) with live High/Low boxes Adds trend direction using EMA bias (50/200 + optional slope) Prints BUY/SELL labels only after a clean breakout + retest sequence, optionally filtered by volume, range expansion (ATR), and candle body strength Educational tool only — not financial advice. Always manage risk. What you’ll see on the chart Session boxes (structure) The indicator draws a box for each session and updates the session High/Low while the session is active. Default settings (Timezone Europe/London): Asia: 00:00–09:00 London: 08:00–17:00 New York: 13:00–22:00 Optional: vertical dotted lines at session starts. EMA bias (direction) Two EMAs are plotted: EMA Fast (50) EMA Slow (200) Bias is: Bullish: EMA50 above EMA200 (and optionally EMA50 rising) Bearish: EMA50 below EMA200 (and optionally EMA50 falling) This is designed to reduce counter-trend signals. The core idea (simple) Each major session often reacts to the previous session’s range. This script uses that concept by selecting a reference range: During London, reference = Asia High/Low During New York, reference = London High/Low During Asia (optional), reference = New York High/Low The panel shows Ref Range, which is just: Ref Range = Reference High − Reference Low Signal logic: Breakout → Retest (with confluence) A signal is only considered when you are inside a session you enabled (Asia/London/NY toggles). BUY (Long) Trend bias is Bullish Price closes above the reference High (breakout) Price returns to retest near the broken High (ATR tolerance) Optional: retest candle must close back up (confirm-close) Optional confirmations pass (volume / expansion / body) SELL (Short) Trend bias is Bearish Price closes below the reference Low (breakout) Price returns to retest near the broken Low (ATR tolerance) Optional: retest candle must close back down (confirm-close) Optional confirmations pass (volume / expansion / body) This approach is meant to avoid “first-touch” entries and focus on structured moves. Filters (optional, but useful) Volume Spike Filter Requires elevated participation: volume ≥ SMA(volume) × multiplier (Volume varies by market/data feed; use discretion on symbols where volume is not meaningful.) Range Expansion Filter (ATR) Requires a candle with enough “energy” to avoid weak breakouts: (high − low) ≥ ATR × range multiplier Strong Body Filter (optional) Filters wick-heavy candles around key levels: body % of candle range ≥ threshold Side Panel (Top Right) — how to read it Session Shows the active session: Asia / London / New York / Off EMA Bias Shows: Bullish / Bearish / Neutral Ref Range Shows the size of the reference session range being used for the current session: London uses Asia range NY uses London range Asia (optional) uses NY range Volume Shows status of the volume filter: High = passes Normal = fails Off = filter disabled Expansion Shows status of the ATR expansion filter: Yes = passes No = fails Off = filter disabled Body Shows status of the strong-body filter: Yes = passes No = fails Off = filter disabled Confluence Example Recommended starting settings If you want fewer, higher-quality setups: Enable London + New York Keep EMA bias ON Volume filter ON (1.2–1.5×) Expansion ON (0.8–1.0× ATR) Body filter optional (0.55–0.70) Confirm-close ON If you want more signals: Lower volume multiplier (1.1–1.2×) Lower expansion (0.6–0.8× ATR) Body filter OFF Best timeframes (TF) to use Best overall: 5m, 15m, 30m Best Pairs for Sessions: EURUSD, GBPUSD, GBPJPY, USDJPY, XAUUSDPine Script®指标由QuantumPipsio提供19
Money Flow Index - MFI🎯 Overview This is an advanced Money Flow Index - MFI indicator that combines volume-weighted momentum analysis with dynamic moving average filtering. Unlike basic MFI implementations, this version features gradient overbought/oversold zones, multiple color themes, and a clear signal dashboard for precise money flow identification. 🧩 Core Components 1. ⚙️ Technical Foundation 📊 Primary Calculation: Uses TradingView's built-in ta.mfi() function which incorporates both price and volume data 📈 Dual Analysis Components: MFI Line: Volume-weighted momentum oscillator MA Filter: Customizable moving average acting as dynamic signal line Threshold Zones: Gradient fills for overbought and oversold conditions ⚡ Volume Integration: Unique ability to combine price action with trading volume for more reliable signals 2. 🎛️ Configuration Parameters 📏 MFI Length: Default 14 periods (standard setting) 🔄 MA Filter Settings: Length: Customizable (default 365 periods) Type: 6 options available (EMA, SMA, RMA, WMA, VWMA, HMA) 🎨 Color Themes: 5 visual schemes consistent with your indicator suite: Classic, Modern, Robust, Accented, Monochrome 📊 Signal Interpretation: 🟢 BULLISH: MFI > MA Filter (money flow above trend) 🔴 BEARISH: MFI < MA Filter (money flow below trend) ⚠️ OVERBOUGHT: MFI > 80 (potential reversal zone) ⚠️ OVERSOLD: MFI < 20 (potential reversal zone) 3. 🎨 Visual Elements 🚨 Gradient Zones: Overbought zone : Red gradient intensifying toward 100 Oversold zone : Green gradient intensifying toward 0 📋 Dashboard Display: Top-right status indicator showing "⬆️ Bullish" or "⬇️ Bearish" 📊 Dynamic Coloring: MFI line changes color based on position relative to MA ⚡ Trading Applications 📈 Primary Uses: 🎯 Money Flow Direction: MFI > MA = Bullish money flow regime MFI < MA = Bearish money flow regime 💪 Trend Strength with Volume Confirmation: MFI considers both price movement AND volume Higher volume moves have more significance Validates price trends with volume support 🚨 Extreme Zone Signals: Overbought: MFI > 80 (potential sell opportunity) Oversold: MFI < 20 (potential buy opportunity) 📊 Zone Analysis: 🔴 Overbought Zone : Red gradient fills Indicates excessive buying pressure Watch for bearish reversals 🟢 Oversold Zone : Green gradient fills Indicates excessive selling pressure Watch for bullish reversals 🟡 Equilibrium: Yellow MA line acts as volume-weighted trend filter 🎨 Customization Options 👁️ Display Features: 📊 Dual Components: Always shows both MFI line and MA filter 🎨 Gradient Visualization: Automatic fill for overbought/oversold conditions 📋 Status Dashboard: Clear bullish/bearish money flow indication 📈 Customizable MA: Choose from 6 different moving average types 🎨 Visual Themes: (Consistent suite) 🎨 Classic: Green/Red (traditional volume-weighted colors) 🚀 Modern: Cyan/Purple (contemporary) 💪 Robust: Amber/Deep Purple (high contrast) 🌈 Accented: Purple/Magenta (vibrant) ⚫⚪ Monochrome: Light Gray/Dark Gray (minimalist) 🔔 Alert System 🟢 LONG Alert: Triggers when MFI crosses above MA 🔴 SHORT Alert: Triggers when MFI crosses below MA 📧 Format: Includes ticker symbol for tracking ⚡ Key Advantages ✅ Strengths: 🎯 Volume-Weighted Accuracy: Combines price and volume for more reliable signals 💪 Overbought/Oversold Filter: Built-in 80/20 thresholds with gradient visualization 👁️ Clear Trend Identification: MA filter separates noise from meaningful money flow 🔄 Flexible Configuration: Multiple MA types for different trading styles 📊 Professional Dashboard: Immediate money flow status recognition 📊 Optimal Settings: ⚡ Short-term Trading: MFI Length 10-14, MA Length 20-50 📊 Medium-term Trading: MFI Length 14-20, MA Length 50-100 📈 Long-term Trading: MFI Length 20-30, MA Length 100-365 🏆 Unique Features: 🎯 Volume Integration: The only oscillator in your suite that includes volume data 📊 Gradient Thresholds: Visual intensity shows proximity to extremes 🎨 Consistent Design: Matches your indicator family aesthetics 📋 Money Flow Dashboard: Quick visual confirmation of volume trends 🔧 Dual Analysis: Combines oscillator with dynamic trend filter 🔄 Trading Strategies 1. Basic Money Flow Strategy: Go LONG when MFI crosses above MA from oversold Go SHORT when MFI crosses below MA from overbought Exit when opposite extreme is reached 2. Divergence Detection: Price makes higher high, MFI makes lower high → Bearish divergence (selling pressure weakening) Price makes lower low, MFI makes higher low → Bullish divergence (buying pressure increasing) 3. Volume Confirmation: Strong trend + rising MFI = High conviction move Weak trend + declining MFI = Potential reversal 📈 Performance Tips Volume Matters: MFI is most effective in markets with consistent volume Extreme Zones: levels often act as support/resistance for the indicator Divergence Signals: More reliable than simple overbought/oversold readings Trend Alignment: MFI above MA in uptrend, below MA in downtrend Confirmation: Combine with price action at key support/resistance levels This enhanced MFI indicator provides professional-grade volume-weighted analysis with intuitive visualization, allowing traders to identify money flow trends, spot potential reversals at extremes, and filter signals through the customizable moving average for higher accuracy trading decisions! 📊💰Pine Script®指标由Tiagorocha1989提供4
Stochastic Momentum Index - SMI🎯 Overview This is a Stochastic Momentum Index (SMI) indicator that combines stochastic momentum with moving average smoothing to identify trend direction and momentum strength in financial markets. The SMI measures where the current price closes relative to the midpoint of its recent trading range, providing enhanced sensitivity to price momentum. 🧩 Core Components 1. ⚙️ Technical Foundation 📊 Primary Calculation: Uses TradingView's built-in ta.stoch() function 📈 Range-Based: Compares closing price to high-low range over specified period 🎯 Scale: Oscillates between 0-100 with 50 as neutral midpoint 2. 🎛️ Configuration Parameters 📏 SMI Length: Default 101 periods (long-term smoothing) 📊 Source Price: Customizable (default = Close) 📈 MA Length: 30-period moving average applied to SMI 🔄 MA Type: 6 options (EMA, SMA, RMA, WMA, VWMA, HMA) 🎨 Color Themes: 5 visual schemes (Classic, Modern, Robust, Accented, Monochrome) 📈 Signal Interpretation: 🟢 BULLISH: SMI > 50 (price closing in upper half of range) 🔴 BEARISH: SMI < 50 (price closing in lower half of range) 🎯 Neutral Zone: Around 50 indicates balanced momentum 👁️ Visual Features 📈 Signal Line (MA): Yellow moving average of SMI Smooths momentum for clearer trend identification 🎯 Reference Lines: 50-level midpoint (white dashed line) 0-100 scale boundaries 🎨 Fill Zones: 🟢 Upper Zone : Bullish momentum area 🔴 Lower Zone : Bearish momentum area Gradient fills enhance visual clarity 📋 Dashboard Display: Content: "⬆️ Bullish" or "⬇️ Bearish" indicator Purpose: Quick market bias assessment ⚡ Trading Applications 📈 Primary Uses: 🎯 Trend Identification SMI > 50 = Uptrend momentum SMI < 50 = Downtrend momentum 📊 Momentum Strength Values near 100 = Strong bullish momentum Values near 0 = Strong bearish momentum Values around 50 = Neutral/consolidation 🔄 Mean Reversion Extreme readings (near 0 or 100) may indicate overbought/oversold conditions ⏰ Timeframe Compatibility: 📅 Long-term: 101-period default suits swing/position trading 📊 Medium-term: Adjust lengths for daily/weekly analysis ⚡ Short-term: Reduce periods for intraday trading 🎨 Customization Options 🔄 Moving Average Types: 📉 EMA: Exponential - responsive to recent changes 📊 SMA: Simple - equal weight to all periods 📈 RMA: Relative - TradingView's special moving average ⚖️ WMA: Weighted - emphasizes recent data 💎 VWMA: Volume-weighted - incorporates volume 🚀 HMA: Hull - reduces lag significantly 🎨 Visual Themes: 🎨 Classic: Green/Red (traditional trading colors) 🚀 Modern: Cyan/Purple (modern aesthetic) 💪 Robust: Amber/Deep Purple (high contrast) 🌈 Accented: Purple/Magenta (vibrant) ⚫⚪ Monochrome: Light Gray/Dark Gray (minimalist) 🔔 Alert System 🟢 LONG Alert: Triggers when SMI crosses above 50 🔴 SHORT Alert: Triggers when SMI crosses below 50 📧 Format: Includes ticker symbol for easy identification ⚡ Key Advantages ✅ Strengths: 🎯 Clear Signals: Simple >50/<50 threshold for easy interpretation 📊 Range-Bound: Always oscillates 0-100 (no divergence issues) 👁️ Visual Clarity: Color-coded zones make analysis intuitive 🔄 Customizable: Multiple MA types and visual themes 📱 Professional: Clean, organized display suitable for all tradersPine Script®指标由Tiagorocha1989提供11