Adaptive Pulse Frequency & Amplitude TrendAdaptive Pulse Frequency & Amplitude Trend Indicator
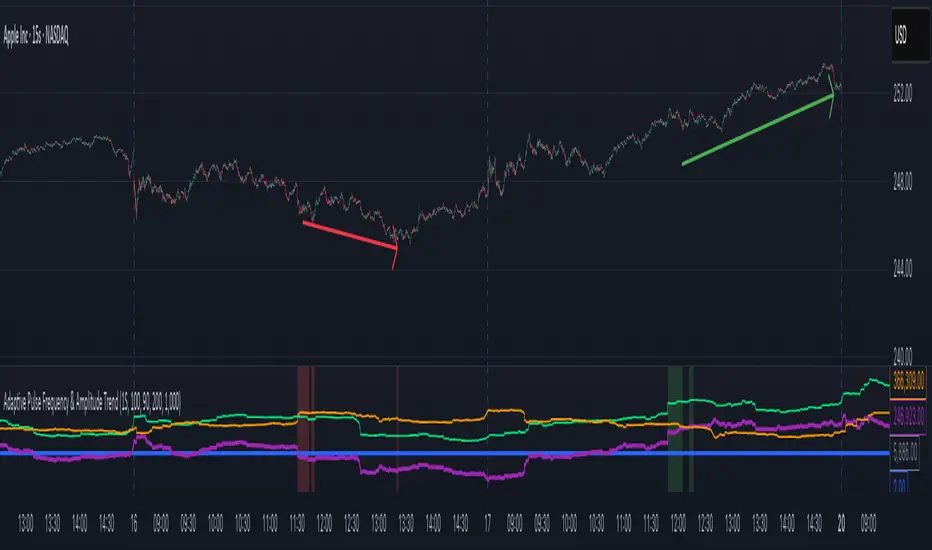
This Pine Script indicator is designed to identify strong bullish or bearish trends by analyzing volume dynamics on a lower timeframe than the one currently displayed on the chart. It operates on the principle of detecting significant spikes in buying or selling pressure, referred to as "pulses," and then evaluating their frequency, strength, and dominance over the opposing market forces.
Core Concepts
Lower Timeframe Volume Analysis: The script requests up-volume and down-volume data from a more granular, lower timeframe (e.g., 1-minute data when on a 15-minute chart). This provides a higher-resolution view of the flow of buy and sell orders.
Adaptive Pulse Detection: A "pulse" is defined as a bar with an unusually high net volume (up volume minus down volume). Instead of using a fixed value, the indicator calculates an adaptive threshold based on the 90th percentile of net volume over a 100-bar lookback period. Any bar with a net volume exceeding this dynamic threshold is flagged as a pulse, categorized as either bullish (positive net volume) or bearish (negative net volume).
Frequency and Amplitude: The indicator measures two key aspects of these pulses over user-defined lookback periods:
Net Frequency: The number of bullish pulses minus the number of bearish pulses. A positive value indicates more buying pulses, while a negative value indicates more selling pulses.
Net Amplitude : The cumulative volume of bullish pulses minus the cumulative volume of bearish pulses. This measures the overall strength and conviction behind the pulses.
Primary Trend Signal
The indicator's primary signal comes from a strict dominance condition. It doesn't just look for more buying or selling pulses; it checks if these pulses are powerful enough to overwhelm the total opposite pressure in the market.
Bullish Dominance (Green Background): A strong bullish signal is generated when the total volume of all bullish pulses within a lookback period is greater than the total down-volume from all bars (not just pulses) in that same period.
Bearish Dominance (Red Background): A strong bearish signal is generated when the total volume of all bearish pulses is greater than the total up-volume from all bars in that period.
The chart background is colored green for bullish dominance and red for bearish dominance, providing a clear visual cue for when one side has taken decisive control.
Plotted Data
In addition to the background coloring, the indicator plots several lines in its own pane for more detailed analysis:
Net Frequency: Shows the trend in the number of bull vs. bear pulses.
Net Amplitude: Shows the trend in the strength of bull vs. bear pulses.
Bullish/Bearish Amplitude: The individual cumulative volumes for bull and bear pulses.
Dynamic Threshold: The adaptive value used to identify pulses.
By combining an adaptive detection method with a strict dominance condition, this tool aims to filter out market noise and highlight periods of genuinely strong, volume-backed trends.
Pine Script®指标