MACD & Mayer multpile Crypto-EmbassyThis is a combination of two indicators MACD & The Mayer Multiple.
MACD = Short for moving average convergence/divergence. It is designed to reveal changes in the strength, direction, momentum, and duration of a trend in a stock's price.
You will find the normal histogram and also a generated trend line (green = bullish , red = bearish )
The Mayer Multiple = The Mayer Multiple was created by Trace Mayer as a way to analyse the price of Bitcoin in a historical context. The Mayer Multiple is the multiple of the current price over the 200-days moving average.
"It does NOT tell whether to buy, sell or hold" but it gives you a pretty good idea of where we are at.
Basically
🔵Blue = Please buy🙏
🟢Light green = Looking for good entries 👀
🟢Green = Buy if you wish
🟡Yellow = This is starting to take off
🟠Orange = Looking for good exit 👀
🔴Red = You should get out of this
🔴Dark Red = You have balls, now please sell🙏
在脚本中搜索"bitcoin"

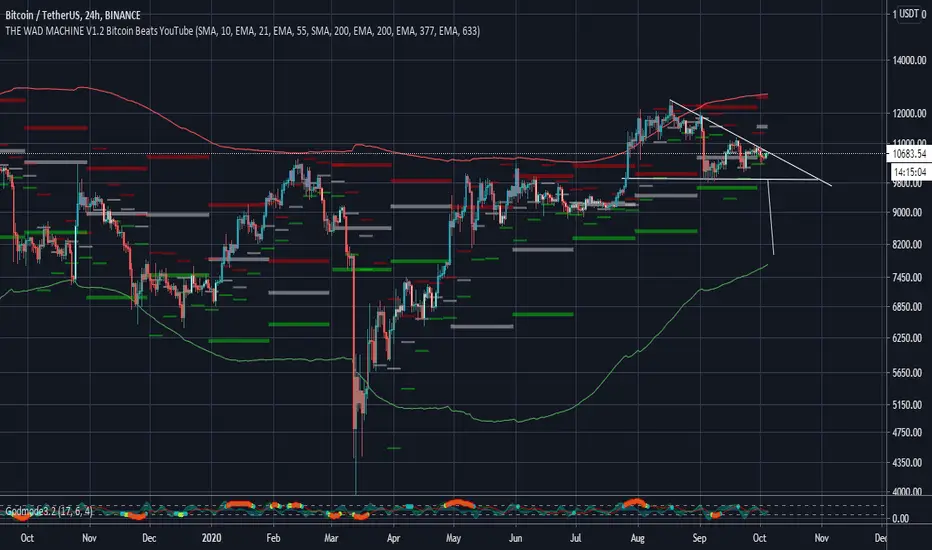
The WAD Machine - Bitcoin BeatsHello Hello Hello, and welcome back to Bitcoin Beats!
This is a Conglomeration of different scripts into 1 indicator that shows a bunch of different things.
This is not all my own work but also a mixture of features taken from other useful scripts.
I will say in terms of originality, it takes a certain level of skill to put this together and get it working so I'll take the credit for that.
This script does all that is said below:
- Plots fibonacci zones with adjustable days, weeks, months ect.
- Shows lower highs, higher lows, lower lows, lower highs after recognizing candle patterns(note that this is not predictive, just shows what has already happened).
- Plots a Price Action Channel(PAC).
The candles automatically adjust to the PAC to give Buy and Sell signals on most timeframes.
If the candles are blue, it means buy.
If the candles are red, it means sell.
If the candles are grey, you shouldn't be in a trade.
I will not state the profitability of this method but for this section of the indicator, it's designed for entries.
Exits require a more manual approach using your own trading initiative.
Beginner traders should exit when the channel is hit and the candle turns grey again.
However, more advanced traders can try to use the Fibonacci zones and other features to manage their positions.
- Plots general trendlines automatically with customization of the lines and the length they go for.
- Plots major sloping supports and resistances automatically.
PLEASE TRADE AT YOUR OWN RISK.
Cheers, and good bye, from Bitcoin Beats.
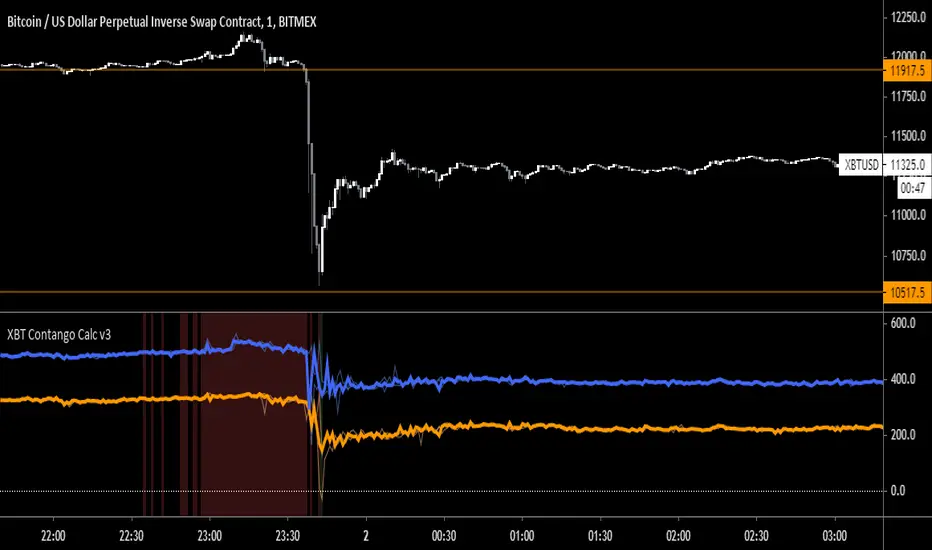
XBT Contango Calculator v3Since creating the first version of the XBT Contango Calculator, I found that the first version is good a calculating contango and backwardation in real time, however does not do a good job of capturing historical data of brief moves. Since backwardation moves are often brief, and since the first version Contango Calc was based on candlestick closes, it did not do a good job of recording the move after it occurred.
It took me a couple versions to try and fix this an eventually settled on version 3 which I have been using on my own for the last few months. You can see in the comparison chart above it does a much better job of capturing backwardation moves and extreme contango. Below is a comparison of how it performed vs. Version 1 during December futures XBTZ19
In addition I have added high/low lines that can be used to understand the amount that futures premium/discount has moved in a specific time frame. For example, the big drop Bitcoin had on September 24th, XBTZ19 went from +$273 contango to -$247 backwardation = $520 move! This move was in addition to the spot price move which was almost -$1,700 from high to low and -$1,100 from open to close. See below:
The high/low lines can also be removed from the chart by unchecking a box in the input tab.
The last update is the ability to lock the spot price to be XBT (index) no matter what chart you pull up. This can be useful if evaluation XBT futures correlation to other bitcoin derivatives such as GBTC or CME futures. You can also disable this feature in the input tab, which will then just calculate based on the current chart you are viewing.
Current Contracts (December 2019)
Blue = XBTM20
Orange = XBTH20

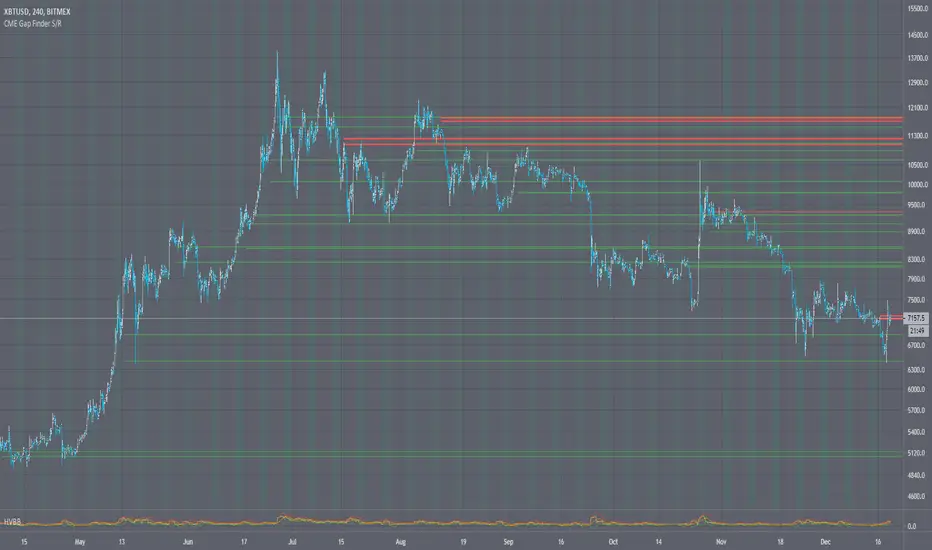
CME Bitcoin Gap Finder Orderblock Support ResistanceCME Bitcoin Gap Finder Orderblock Support Resistance
Intro
I had a backlog of scripts to release, and so everyone is getting some Christmas gifts early!
I have been watching CME gaps and how they relate to BTC for over a year now. I find they make good orderblock support/resistance areas.
Description
There is a limitation to how many lines I can draw with the new pine script functions. So for instance if you want to see the gaps from 2018 I have included a date range selector (similar to how a backtest works). This way you can only display the gaps from the dates ranges you want to see.
There's also the ability to check for gaps on the daily, 12h, 4h, and 1h charts. I recommend using 12H. But know that depending on what period you choose it will effect the size of the gaps, so experiment and see what works for you.
Lastly I included the ability to have background highlights whenever CME is closed on the weekend, just for visual reference.
You can use this indicator on any BTC ticker, and it will show you where the CME gaps are (without having to switch/reference the CME chart).
👍 We hope you enjoyed this indicator and find it useful! We post free crypto analysis, strategies and indicators regularly. This is our 74th script on Tradingview!
💬Check my Signature for other information
[astropark] Renko OBV divergencesDear Followers,
today a new great Scalper Tool , based on Ob Balance Volume (OBV) oscillator, which works from 1 minute timeframe Renko chart , which is the best and more secure timeframe to use on a Renko chart. But of course it works great on all timeframes (included the 1D timeframe), both on FOREX and on Cryptocurrencies!
This tool has some cool features:
it works on all timeframes , starting from 1 minute: so you can enjoy high-frequency trading by using a 24/7 running bot and a proper money and risk management strategy
it shows you both bullish and bearish divergences with a triangle up or down respectively
when it finds a strong bullish/bearish divergence , a flag will be displayed instead of a triangle
This script will let you set all notifications you may need in order to be alerted on each triggered divergence.
You may like to use it together with my Renko Scalper V2
and my Renko RSI Divergences indicator
On Bitmex/ByBit/Binance Bitcoin/USD chart best settings is Traditional Renko chart with 10$ box size, while 0.5$ box size is suggested on Ethereum/USD pair.
This is a premium indicator , so send me a private message in order to get access to this script.

Blockchain Fundamentals - Satoshies Per Dollar by Cryptorhythms🔗Blockchain Fundamentals - Satoshis Per Dollar by Cryptorhythms
Intro
SPD is a new metric I propose which can be used to determine general sentiment and help narrow down periods to DCA .
Description
In the most basic sense this indicator is simply showing you how many satoshies are equal to one US dollar . This can be a useful metric to keep stored in the back of your mind. It can also give you a new satoshi based perspective on bitcoin pricing.
I simply added an MA selection option to give a basic sentiment reading. You could also use the red areas as a modified DCA (i.e. only do dollar cost averaging when red zone is in effect.
The indicator is not really meant for buy/sell signaling but more as a reference
👍 We hope you enjoyed this indicator and find it useful! We post free crypto analysis, strategies and indicators regularly. This is our 71st script on Tradingview!
💬Check my Signature for other information

risk indicator (btc)Designed specifically for Bitcoin on the daily chart, this indicator calculates risk, based on average divergence and extension.
Zone transitions are specific areas of interest, for example, where entering green zone below value .17 a low risk period with very good buying opportunities begins.
On the other hand transitions into red zones, for example above .57 indicate high-risk areas with good selling opportunities.

Syminfo.TypeHello traders
Earlier this week I discovered a new built-in variable called syminfo.type
What is it for?
This variable returns the type of the current symbol. Possible values are cfd, stock, futures, indices, forex, crypto, fund.
Cool bro but... should we care?
Well... we all should. Imagine you have a generic script and you want a different configuration whether you're trading FOREX or Crypto .
I designed a dummy example in that script that will preset the inputs according to the asset type from the chart.
Here I want 12/26/9 for forex and 20/50/50 for crypto - 30/60/90 otherwise
Quick caveat
It seems that for any crypto asset, syminfo.type returns "bitcoin". TradingView will fix it at some point but wanted to give you the heads-up regardless
Enjoy and all the BEST ^^
--
Dave

BEAMThe BEAM indicator helps identifying promising times during a cycle for buying and selling Bitcoin or other crypto currencies. It can also be used with gold or silver after adjusting its parameters, but does not work very well with stocks.
Disclaimer: This is not financial advice. For educational purposes only.

Ace Pro Long Indicator - 1 Minute BTCUSD Bitcoin ChartThe Ace Pro Long Indicator calculates overbought and oversold conditions.
It focuses on momentum to identify whether the market is overbought or oversold.
If it detects that the market is oversold, it gives an alert of “long entry”
If it detects that the market is overbought, it gives an alert of “long exit”
Users are also able to set notifications on Tradingview with this version of the indicator.
To set an alert, after adding the indicator, at the top left of the chart where the indicator is listed, click on the "more" option (three dots), and then select "Add alert."
Please note the following:
The Ace Pro Long indicator is designed only for use on the 1 minute Bitstamp BTCUSD chart.
It is only to be used for opening and closing long positions.
It is not recommended for use with short positions.
It is not recommended for use with time frames other than the 1 minute.
In a sideways market, or during a violent move, it is likely to produce false signals.
Traders must use confluence from their technical analysis to enter trades.
Because this is an invite only script, users with a free Tradingview account will not be able to obtain access.
Traders must use confluence from their technical analysis to enter trades.

Ace Pro Short Indicator - 1 Minute BTCUSD Bitcoin Chart The Ace Pro Short calculates overbought and oversold conditions.
It focuses on momentum to identify whether the market is overbought or oversold.
If it detects that the market is overbought, it gives an alert of “Short Entry”
If it detects that the market is oversold, it gives an alert of “Close Short”
Users are also able to set notifications on Tradingview with this version of the indicator.
To set an alert, after adding the indicator, at the top left of the chart where the indicator is listed, click on the "more" option (three dots), and then select "Add alert."
Please note the following:
The Ace Pro Short indicator is designed only for use on the 1 minute Bitstamp BTCUSD chart.
It is only to be used for opening and closing short positions.
It is not recommended for use with long positions.
It is not recommended for use with time frames other than the 1 minute.
In a sideways market, or during a violent move, it is likely to produce false signals.
Traders must use confluence from their technical analysis to enter trades.
Because this is an invite only script, users with a free Tradingview account will not be able to obtain access.
Traders must use confluence from their technical analysis to enter trades.

CryptoEngineering 🔥Isn’t It Time You Made Your Crypto Portfolio Great Again? 🔥
The falling knives, the heartbreaking crashes, the devastating feeling of watching a missed trade soar all the way to the moon.
The markets aren’t fair, which means you need a tool that gives you an edge. So,It is time to try EngineeringRobo.
The Engineeringrobo is a great ally in a crypto market - when the price moves the algorithm will automatically show Buy and Sell orders when there is a best opportunity to make a profit. It is a just SMART trading system script on TradingView that brings the easiest approach to trading with a high profitability rate.
I created EngineeringRobo to help you on your traders as a robo advisor , It will "not " trade on behalf of you on exchanges via API. It is not an AI robot,It is am ALGO Trading robot. You can use it on any trading markets (BIST, S&P 500,Commodities ,Forex, Crypto ) with any time frame!
My unique algorithm find profitable altcoins based on their Ichimoku, McGinley, MA, RSI, MACD, Stochastic, Volumes and Price Changes gives you BUY and SELL signals. The EngineeringRobo indicator displays two different signals for entry and exit on a coin to maximize its profitability on the chart. The signals can appear at any time during an open candle, but once closed the signal is final and wont change in the future.
One of the biggest advantages of algo trading is removing human emotion from the crypto markets,humans trading are susceptible to emotions that lead to irrational decisions.Robo doesn't have to think or feel good to make a trade. If conditions are met, it enters.When the trade goes the wrong way or hits a profit target, It exits. It doesn't get angry at the market or feel invincible after making a few good trades. The two emotions that lead to poor decisions that algo traders aren't susceptible to are fear,and greed.
That's why It makes money but most of you not!
What Are the Advantages of using it as a ROBO Advisor?
🔴Reduce your required screen-time
🔴Reduce anxiety over missing setups when you are busy
🔴Turn existing indicators into alerts (eg. Whenever RSI goes overbought)
🔴Find comfort in knowing that you have me on your side
To get the maximized results from @EngineeringRobo
Open tradingview
Decide the coin/BTC
Pick 1M
Draw the Support & Resistance lines
Change the 1W
Draw the lines - Support & Resistance
Find out Chart Patterns
Change to 3D/1D / 3H
Check Robo' signals
Set your orders
Enjoy your profits💰
***Even the best automated day trading software can trigger false trends.
In August 2012 by Knight Capital group;who lost over $440 million in just half an hour when their trading software went rogue in response to market conditions. That's why it is a Robo advisor not trading bot! Engineeringrobo is not a get-rich-quick scheme as well!
Disclaimer
Information on EngineeringRobo should not be seen as a recommendation to trade BIST, S&P 500,Commodities ,Forex, Crypto.
EngineeringRobo is not licensed nor authorized to provide advice on investing and related matters.
Information on the page is not, nor should it be seen as investment advice.Any trading decisions that you make are solely your responsibility. Clients without sufficient knowledge should seek individual advice from an authorized source.
Crypto and Forex trading entails significant risks and there is a chance that clients lose all of their invested money. Past performance is not a guarantee of future returns. Before trading with any of the Algos, clients should make sure they understand the risks.
EngineeringRobo nor its agents or partners are not registered and do not provide any services on the US territory.
***I have been trading since 2016 . Got my first bitcoin in 2013

NixTrading Margin ZonesCreated by Super55
This one is the most accurate and precise margin zones indicator available. It is fine-tuned for bitcoin trading, but can also be used for all popular assets (XAUUSD , EURUSD , Oil etc.) that have futures traded on Chicago Mercantile Exchange (CME). Margin requirements data for each market is taken from the CME, then a key price for each specific time period is determined. The result is a set of reliable support and resistance zones that are best used for intraday trading. The data should be checked and updated daily.
This is a private, "invite only" indicator. I don't sell nor promote it.
__
For Russian-speaking followers: Предыдущая версия была заблокирована из-за большого количества русских слов. Буду краток: это лучший индикатор маржинальных зон на сегодня. Коэффициенты зон, которые мы используем на биткойне, имеют множитель x2 по сравнению со стандартным процентным обозначением (+50 = +25%). Доступ только для членов нашего сообщества.

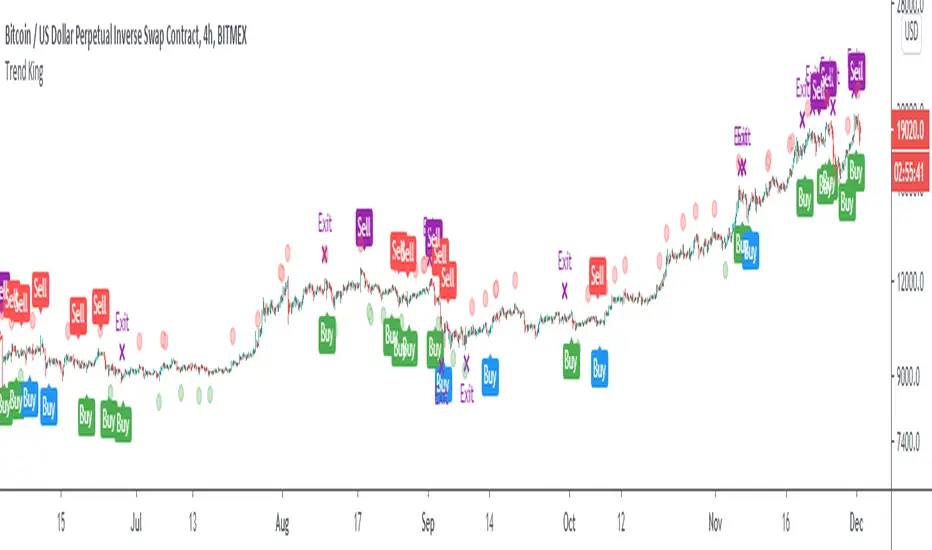
Trend KingIntroducing “Trend King”.
The alpha generating strategy built for Crypto.
“Trend King” combines 4 proprietary indicators. It buys and sells based on:
Short-term momentum
Long-term momentum
Volume compression
Volatility breakouts
The strategy was built on 2 years of BitMEX data (XBTUSD) and backtested on 9 years of Bitcoin data (BLX). Finally, the strategy was validated on multiple large market cap cryptocurrencies, including Ethereum (ETHUSD), without parameter adjustment.
Strategy backtesting checks include:
Used 0.12% fees. 60% more than the actual BitMex/Binance fees of 0.075%.
No Heikin-Ashi Candles (to avoid fake results)
No Stop-losses (to avoid fake order execution)
Market Orders Only (to avoid fake order execution)
The results speak for them self.
See the positive excess return from the “Trend King” strategy returns versus a simple Bitcoin “Buy-and-Hold” strategy. Best functionality on the Daily and 4HR timeframes.
**For Access: Contact me on TradingView or Twitter.
Codex NY|LDN SessionsPRIVATE SCRIPT published strictly for use/testing by close acquaintances for the Bitcoin and cryptocurrency markets.
Study shows London and New York trading sessions to help provide a closer look at how traditional hours/futures can/do effect the market.

NVT Dynamic Colored with Signals [aamonkey]NVT Dynamic
This is the dynamic version of my " Bitcoin Network Value to Transactions " indicator.
The dynamic NVT indicator is based on the Network Value to Transactions.
Definition:
NVT = Network Value / Daily Transaction Volume
Advantages:
Because BTC is a very young asset, it can be a good idea to have relatively high and low NVT values that change over time.
Signals:
When the NVT turns green = buy opportunity
NVT turns red = sell opportunity

HTF Double Logarithmic Curves OscillatorThis a companion indicator for HTF Double Logarithmic Curves
This is an oscillator version of the above. When the indicator is at/near 1 then Bitcoin price is at/near the upper range of it's longterm logarithmic growth trend. When at/near 0 then price is at/near the lower range of that trend.
This indicator only works with the BLX Brave New Coin Index (ticker:BLX) and only on 1 day, 3 day, or 1 week timeframes.

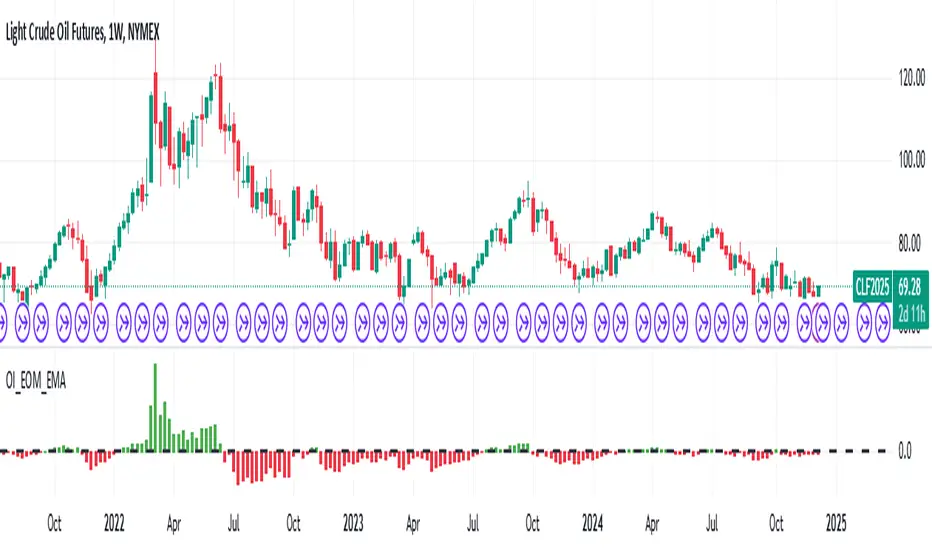
Open Interest Exponential Ease of MovementModified Ease of Movement :
* Open Interests used on Futures instead of Volume (Includes Bitcoin)
* Exponential Moving Average used instead of Simple Moving Average
* Division Number cancelled. (Division Number gives wrong signals inside strong trends.)
NOTE : This code is open source under the MIT License. If you have any improvements or corrections to suggest, please send me a pull request via the github repository github.com
Stay tuned. Best regards !
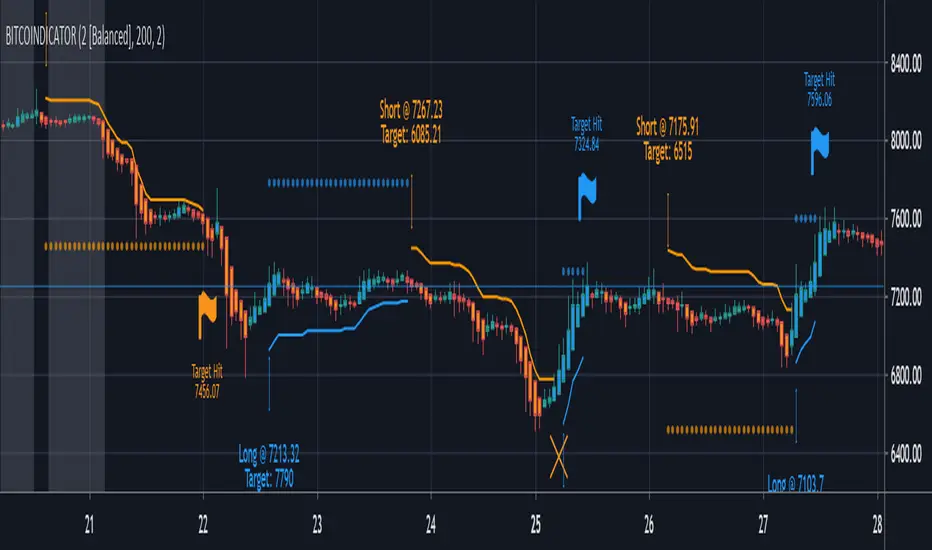
BITCOINDICATORAll-in-one indicator designed for Bitcoin (any BTC/USD pair), and works well for all Crypto/stable coin pairs. It utilizes individual trade signals from price momentum, EMA crossings, periodical VWAP, volume divergences, and market volatility to create a checklist that when filled, generates easy-to-read, real-time trade labels.
For detailed information on Bitcoindicator and how to add it to your charts, please visit:
www.bitcoindicator.com
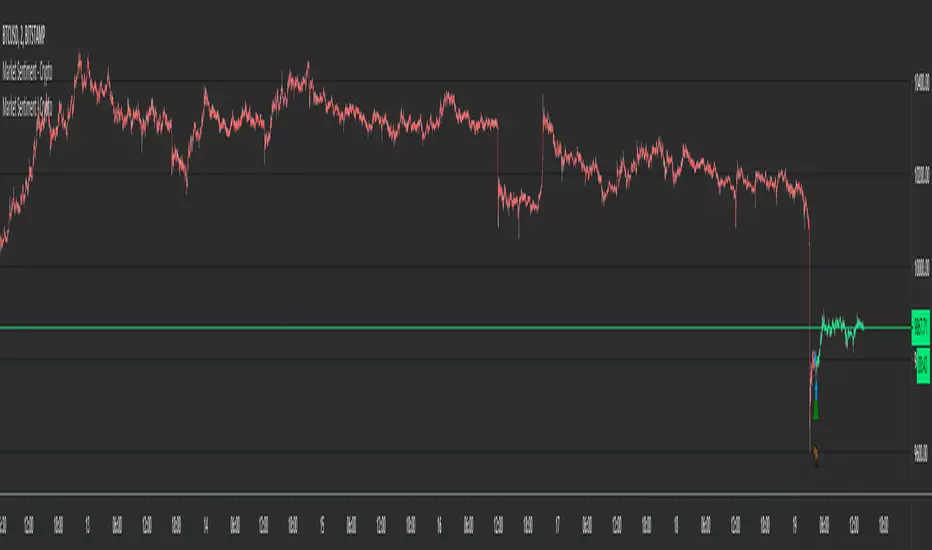
Market Sentiment - CryptoMarket Sentiment - Crypto
This is a market sentiment indicator.
When there is greed - it is good to go Short , when there is fear - go Long .
- The indicator can be used as a trend detection tool, greatly increasing the chance of being on the right side of the market.
- It directly shows the change in trend with Buy and Sell marks on the chart.
- Using it as a standalone is possible, but don't forget about Risk Management .
- Alerts are available.
- It works for Crypto only, showing the change in market sentiment for Bitcoin and Ethereum.
The same results are shown on all timeframes.
Higher timeframes may miss some small changes in trend because they may happen intra-bar. Lower timeframes are good for higher precision.
The indicator can be used on any chart, but it will show data relevant only to Crypto (Bitcoin and Ethereum).
Crypto Multi Exchange Volume (CMEV)Crypto Multi Exchange Volume (CMEV) aggregates and plots trading volumes for supported cryptoasset pairs over multiple different cryptoasset exchanges. For developers looking for more information and for those who want to compile their own version of CMEV, please check out my GitHub (jakobpredin/crypto-multi-exchange-volume).
Configuration
CMEV comes with two configurable settings - whether base volume or quote volume is plotted and the length of the volume's EMA. By default, the base volume is used for plotting and the length of the EMA is set to 12 periods.
Use cases
The indicator was primarily developed in order to be able to chart using the trading pair with the longest available trading history. Due to the fast-changing preferences of where cryptoassets are traded, volumes tend to be very inconsistent and can give a distorted picture of a pairs history. For illustration, check out the SC-BTC pair from Poloniex using their native volume and compare it to the CMEV volume.
The other use case is to be able to spot divergences in volume. A great example here is bitcoin's 2019 rally where volumes from derivatives exchanges are at all time highs but volumes from retail/spot exchanges are not.
Supported exchanges
CMEV currently supports asset pairs from the following exchanges:
Binance
Bitfinex
Bitstamp
Bittrex
Coinbase
Gemini
Kraken
Poloniex
Limitations
Because of the fact that CMEV is pulling data from from multiple different exchanges and is computationally intensive it can take a couple of seconds to load while charting certain cryptoasset pairs.
Additionally, due to Tradingview's various limitations only a certain number of pairs can be supported at a time. By default, only pairs with a BTC or USD quote are supported and many non-unique pairs with consistently low trading volumes have been removed. For a full explanation, please refer to the docs in my GitHub (jakobpredin/crypto-multi-exchange-volume).
Future of the project
I plan on supporting pairs from more exchanges in the future as I see fit and as they become available for charting on Tradingview. Further, I may develop a strategy script using CMEV as its core indicator.
I welcome everybody from the community to help me extend the functionality of CMEV in order to make investing in cryptoassets more transparent for everybody.

A Simple Bitcoin Stock to Flow ModelThis is just a bit of fun. Stock to flow is a hot topic so I thought I'd mess around. Here is a model that is very closely based on the one available here: digitalik.net . I take no credit for the actual model.
It can be tuned with parameters a and b, but this is the best fit imo.
The model is a bit pointless as Tradingview doesn't let us run scripts on future candles, so no predictions.
The blue line is the actual model and the pink line is a 200 MA.
Run this script on the DAILY chart please ;)
Here's a close up of current action. Interesting maybe ;)
