Breakout Trend Follower V2This is a variation on my other Breakout Trend Follower script. In the other script, you can use a moving average to act as a filter for your trades (i.e. if the price is below the moving average, it won't go long). After making the tool that detects trends on higher timeframes, I wanted to see if that might be a better filter than a moving average.
So this script lets you look at higher time frame trends (i.e. are there higher highs and higher lows? If so, this is an uptrend). You only take trades when you are with the trend. You have the ability to select up to two trends to act as a filter. Each trend direction is shown on a table on the chart for easy reference. The current pivot highs and lows are plotted on the chart so you can see when you might be breaking both the current timeframe's trend and higher level trends.
What I found was that in general this does not perform as well as the other strategy, but it does seem to be a lot more picky with trades. Showing higher win rates and a better profit factor. It just takes a lot less trades and the net profit isn't as good.
在脚本中搜索"breakout"

Breakout Reversal Entry on WMA - NG1! Overnight ver 1This script is for learning purposes only
This strategy will plot arrows when price breaks so far above/below WMA. The strategy will enter when the price breaks away from WMA. All entries are reversals. Users can set WMA length and source; also the distance of the price away from WMA to enter. Adjustable bracket orders are placed for exit, with trailing stop or market stop choice. Last, users can set the time of day they want to enter a trade.
My Preference: I am testing this strategy on NG1! over night on 1 minute candle. with .003 on price drop/climb, I get entries almost every night. Also 10 tick stop and 5 tick profit seems backward to most, but with a high win/loss ratio, it performs quite well. Trailing stops generally help out as well.
INPUTS:
Length - The is the WMA length
Source - WMA source (High, Low, Open, Close...)
When Price Drops - This is the distance in ticks when the price drops away from WMA, an arrow is plotted, and reversal entry order is placed
When Price Climbs - Same as price drop, just in the opposite direction
Trailing Stop check box - Check if you want to place a trailing stop so many tick away from entry. Unchecked is Market (hard) stop so many ticks from entry.
Stop - Number of ticks away from entry a the stop or trailing stop is set (for NG 1 tick = $0.001)
Limit Out - Number of ticks away from entry a limit order is placed to take profits
Limit Time of day check box - check to use the time of day to limit what time of day order entry will occur.
Start/Stop Trades (Est Time) - First box is when the strategy will be allowed to start buying and stop is when the strategy will stop being allowed to buy. Sell orders continue until a stop or limit triggers an exit. These times are Eastern time zone
PROPERTIES:
Pyramiding - This feature will allow multiple entries to occur. If set to 1, the strategy should only trade 1 contract at a time. If set to 2, the strategy will enter a second order if entry requirements are met. This allows you to be holding 2 contracts. Basically on a good day, it will multiply your earnings, on a bad day, you'll just lose more. For testing, I keep this on 1.
TIPS:
- If you want to go long only, set "When Price Climbs" to an impossible number, like 10,000. It's not possible for NG to move $10 is a matter of minutes so it will not enter the market with a short order. Also keep in mind you can set different requirements for going long vs going short. If you think there is more pull on the market in a particular direction.

Breakout lineSimple script to find breakout levels. Set your choise of timeframe. (must to be higher then chart)


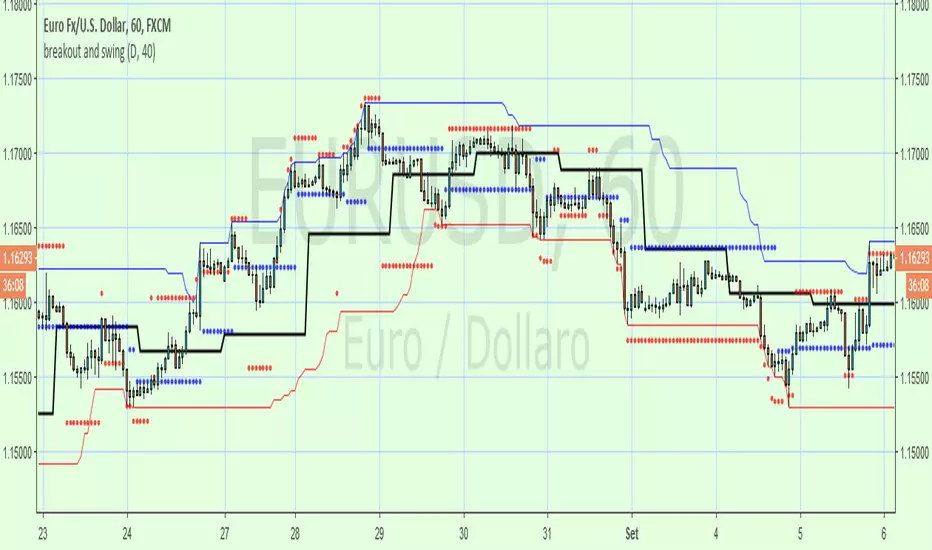
breakout and swingA Price Action system that use swing point and breakout
above the black line (breakout) is long, below short
swing/support/resistance points (blue circles) are displayed after a top or botton, breaking it means an inversion
red circles try to guest a target after a top/bottom or after a swing break.
the main trend is made by the black line that is set on Day period suitable for 1h to 15m time frame , for small TF you can set a smaller period from setting command
By default a set a 40 period channel high/low (the highest and lowest 40 bar back) that is ok for 1 h or smaller tf , but look to long for daily tf, adjust it yourself
Breakout Range LS alert 893 popup trigger ver For Japanese major donchain breakout bot's logic.
it's trigger are price range and highest/lowest price.
this script put on symbol/text in chart when price reach on trigger:)
recommend to use on 1h chart.
include alertcondition for TV alert.

Volatility Breaker Blocks [BigBeluga]The Volatility Breaker Blocks indicator identifies key market levels based on significant volatility at pivot highs and lows. It plots blocks that act as potential support and resistance zones, marked in green (support) and blue (resistance). Even after a breakout, these blocks leave behind shadow boxes that continue to impact price action. The sensitivity of block detection can be adjusted in the settings, allowing traders to customize the identification of volatility breakouts. The blocks print triangle labels (up or down) after breakouts, indicating potential areas of interest.
🔵 IDEA
The Volatility Breaker Blocks indicator is designed to highlight key areas in the market where volatility has created significant price action. These blocks, created at pivot highs and lows with increased volatility, act as potential support and resistance levels.
The idea is that even after price breaks through these blocks, the remaining shadow boxes continue to influence price movements. By focusing on volatility-driven pivot points, traders can better anticipate how price may react when it revisits these areas. The indicator also captures the natural tendency for price to retest broken resistance or support levels.
🔵 KEY FEATURES & USAGE
◉ High Volatility Breaker Blocks:
The indicator identifies areas of high volatility at pivot highs and lows, plotting blocks that represent these zones. Green blocks represent support zones (identified at pivot lows), while blue blocks represent resistance zones (identified at pivot highs).
Support:
Resistance:
◉ Shadow Blocks after Breakouts:
When price breaks through a block, the block doesn't disappear. Instead, it leaves behind a shadow box, which can still influence future price action. These shadow blocks act as secondary support or resistance levels.
If the price crosses these shadow blocks, the block stops extending, and the right edge of the box is fixed at the point where the price crosses it. This feature helps traders monitor important price levels even after the initial breakout has occurred.
◉ Triangle Labels for Breakouts:
After the price breaks through a volatility block, the indicator prints triangle labels (up or down) at the breakout points.
◉ Support and Resistance Retests:
One of the key concepts in this indicator is the retesting of broken blocks. After breaking a resistance block, price often returns to the shadow box, which then acts as support. Similarly, after breaking a support block, price tends to return to the shadow box, which becomes a resistance level. This concept of price retesting and bouncing off these levels is essential for understanding how the indicator can be used to identify potential entries and exits.
The natural tendency of price to retest broken resistance or support levels.
Additionaly indicator can display retest signals of broken support or resistance
◉ Customizable Sensitivity:
The sensitivity of volatility detection can be adjusted in the settings. A higher sensitivity captures fewer but more significant breakouts, while a lower sensitivity captures more frequent volatility breakouts. This flexibility allows traders to adapt the indicator to different trading styles and market conditions.
🔵 CUSTOMIZATION
Calculation Window: Defines the window of bars over which the breaker blocks are calculated. A larger window will capture longer-term levels, while a smaller window focuses on more recent volatility areas.
Volatility Sensitivity: Adjusts the threshold for volatility detection. Lower sensitivity captures smaller breakouts, while higher sensitivity focuses on larger, more significant moves.
Retest Signals: Display or hide retest signals of shadow boxes

Trend Break Targets [MarkitTick]Trend Break Targets
Trend Break Targets is a technical analysis tool designed to assist traders in identifying trendline breakouts and projecting potential price targets based on market geometry. Unlike fully automated indicators that guess trendlines, this tool provides you with precise control by allowing you to manually Pivot Point the trendline to specific points in time, while automating the complex math of target projection and structure mapping.
Theoretical Basis & Concepts
This indicator is grounded in classic technical analysis principles found in foundational trading literature. It automates the following methodology:
Drawing a trend line between two key points to represent dynamic support or resistance.
Identifying a breakout when the price closes above or below this line, potentially signaling a change in trend.
Calculating a price target by measuring the vertical distance between the breakout line and the last high/low (pivot), then projecting that same distance in the direction of the breakout.
This concept is based on methods and "Measured Move" theories explained in classic books such as "Technical Analysis of Stock Trends" by Edwards & Magee, "Technical Analysis of the Financial Markets" by John Murphy, and in Thomas Bulkowski's Price Pattern Studies.
How It Works
Pivot Pointed Trendline Construction The script draws a trendline between two user-defined points in time (Start Date and End Date). It calculates the slope between these points and extends the line infinitely to the right, allowing you to define the exact structure (e.g., a resistance trendline on a wedge).
Breakout Detection The script monitors the "Price Source" (High, Low, or Close) relative to the extended trendline.
A Bullish Breakout (BC) occurs when the Close crosses above a bearish trendline.
A Bearish Breakout (BC) occurs when the Close crosses below a bullish trendline.
Dynamic Target Projection (The Math) Upon a confirmed breakout, the script automatically calculates three distinct targets by identifying the most significant "Swing Point" (Pivot) prior to the breakout.
Distance (D): The vertical distance between the Trendline and the Pivot Price at the specific bar where the pivot occurred.
Target 1 (T1): The Breakout Price +/- (Distance × 1.0). This represents a classic 1:1 measured move.
Target 2 (T2): The Breakout Price +/- (Distance × 1.618). Based on the Golden Ratio extension.
Target 3 (T3): The Breakout Price +/- (Distance × 2.618).
Market Structure (CHOCH) The script includes an optional Change of Character (CHOCH) module. This runs independently of the trendline logic, identifying local Swing Highs and Swing Lows based on the "Swing Detection Length." It plots dashed lines and labels to visualize immediate shifts in market structure.
How to Use This Tool
This is an interactive tool that requires user input to define the setup.
Identify a Setup: Locate a clear trend, wedge, or flag pattern on your chart.
Set Pivot Points: Go to the Indicator Settings. Input the exact Start Date and End Date corresponding to the two main touches of your trendline.
Monitor for Breakout: The script will extend the line. Wait for a "BC" label to appear.
Trade Management: Once "BC" prints, the T1, T2, and T3 lines will instantly render. These can be used as potential take-profit zones or areas to tighten stop-losses.
Settings & Configuration
Indicator Settings
Start/End Date: The timestamp Pivot Points for your trendline.
Price Source: Determines what price (High or Low) Pivot Points the line and triggers the breakout.
Pivot Left/Right: Adjusts the sensitivity for finding the "Pivot Before Break" used for target calculations.
Extend Target Line: How far forward the target lines are drawn.
Visual Style
Colors: Fully customizable colors for the Trendline, Breakout Labels, and each Target level (T1, T2, T3).
Gold Bullish Reversal
This analysis dissects a confirmed bullish reversal on Gold using a custom Trend Break system. The setup identifies a transition from a bearish corrective phase to bullish momentum, validated by a structural break and a geometric target projection.
Trend Identification (The Pivot Points) The descending white trendline serves as the primary dynamic resistance, defining the bearish correction.
Pivot Points: The line is drawn connecting two significant swing highs, marked by Label 1 and Label 2.
Logic: These points represent the "lower highs" characteristic of the previous downtrend. As long as price remained below this trajectory, the bearish bias was intact.
The Trigger: Breakout & Confirmation The transition occurs at the candle marked BC (Breakout Candle).
Breakout Criteria: The indicator logic dictates that a signal is only valid when the bar closes above the trendline. This filters out intraday wicks and ensures genuine buyer commitment.
CHOCH Confluence: Immediately following the breakout, a CHOCH (Change of Character) label appears. This signals a shift in market structure, indicating that the internal lower-high/lower-low sequence has been violated, adding probability to the reversal.
Target Projection: The Measured Move The vertical green lines (T1, T2) represent profit objectives derived from the depth of the prior move. The logic calculates the distance between the breakout line and the lowest pivot prior to the break.
T1 (Standard Target): This is a 1:1 projection of the pre-breakout volatility. We see price action initially stalling near this level, confirming it as a zone of interest.
T2 (Golden Ratio Extension): The second target is calculated as the initial distance multiplied by 1.618 (Fibonacci Golden Ratio). The chart shows the price rallying aggressively through T1 to tap the T2 zone, often considered an exhaustion or major take-profit level in harmonic extensions.
Conclusion Gold has successfully invalidated the 4-hour bearish trendline. The confluence of a confirmed close above resistance (BC) and a structural shift (CHOCH) provided a high-probability long setup. The price has now fulfilled the T2 (1.618) extension, suggesting traders should watch for consolidation or a reaction at this key Fibonacci resistance level.
Bearish Trendline Breakdown
The image displays a Bearish Trendline Breakdown on the Gold (XAUUSD) 4-hour chart. The indicator is actually functioning in "Low" mode here (connecting swing lows to form support), which triggers the bearish logic found in the code. Here is the step-by-step breakdown:
The Setup: Pivot Points & Trendline
Visual: The Blue Labels "1" and "2" connected by a white diagonal line.
Code Logic: These are the user-defined start and end points.
Pivot Point 1 (startDate): The starting pivot of the trendline.
Pivot Point 2 (endDate): The ending pivot.
Trendline: The code draws a line between these two points and extends it to the right (extend.right). In this specific image, the line acts as a Support Trendline.
The Trigger: Break Candle (BC)
Visual: The Red Label "BC" appearing just below the white trendline.
Code Logic: This is the execution signal. The code detects a "Down Break" (dnBreak) because the Price Source was likely set to "Low" and the candle's Close was lower than the Trendline Price at that specific bar (close < currLinePrice). This confirms the support level has been breached.
The Projection: Targets (T1 & T2)
Visual: The Green Labels "T1" and "T2" with dotted horizontal lines projected downward.
Code Logic: These are profit targets based on a "Measured Move."
Pivot Calculation: The script looks back for a recent "Pivot High" (the peak before the crash) to calculate the volatility/distance (dist) between that peak and the trendline.
T1 (Conservative): The price is projected downward by 1x that distance (currLinePrice - dist).
T2 (Extended): The price is projected downward by 1.618x that distance (Golden Ratio extension).
Market Context: CHOCH
Visual: The small Red/Orange "CHOCH" labels appearing above the price action.
Code Logic: This is a secondary confirmation system running independently of the trendline. It detects a Change of Character (structural shift). The red labels indicate a "Bearish CHOCH," meaning the price broke below a significant prior swing low (last_swing_low). This supports the bearish bias of the trendline break.
Disclaimer This tool is for educational and technical analysis purposes only. Breakouts can fail (fake-outs), and past geometric patterns do not guarantee future price action. Always manage risk and use this tool in conjunction with other forms of analysis.

RSI Volatility Suppression Zones [BigBeluga]RSI Volatility Suppression Zones is an advanced indicator that identifies periods of suppressed RSI volatility and visualizes these suppression zones on the main chart. It also highlights breakout dynamics, giving traders actionable insights into potential market momentum.
🔵 Key Features:
Detection of Suppression Zones:
Identifies periods where RSI volatility is suppressed and marks these zones on the main price chart.
Breakout Visualization:
When the price breaks above the suppression zone, the box turns aqua, and an upward label is drawn to indicate a bullish breakout.
If the price breaks below the zone, the box turns purple, and a downward label is drawn for a bearish breakout.
Breakouts accompanied by a "+" label represent strong moves caused by short-lived, tight zones, signaling significant momentum.
Wave Labels for Consolidation:
If the suppression zone remains unbroken, a "wave" label is displayed within the gray box, signifying continued price stability within the range.
Gradient Intensity Below RSI:
A gradient strip below the RSI line increases in intensity based on the duration of the suppressed RSI volatility period.
This visual aid helps traders gauge how extended the low volatility phase is.
🔵 Usage:
Identify Breakouts: Use color-coded boxes and labels to detect breakouts and their direction, confirming potential trend continuation or reversals.
Evaluate Market Momentum: Leverage "+" labels for strong breakout signals caused by short suppression phases, indicating significant market moves.
Monitor Price Consolidation: Observe gray boxes and wave labels to understand ongoing consolidation phases.
Analyze RSI Behavior: Utilize the gradient strip to measure the longevity of suppressed volatility phases and anticipate breakout potential.
RSI Volatility Suppression Zones provides a powerful visual representation of RSI volatility suppression, breakout signals, and price consolidation, making it a must-have tool for traders seeking to anticipate market movements effectively.

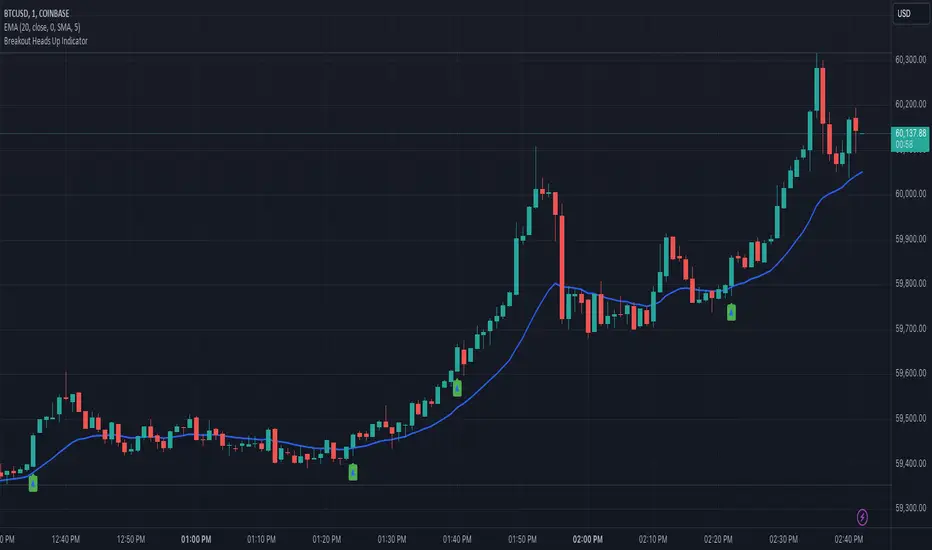
Heads UpAn indicator that gives you the "heads up" that that bullish/ bearish strength is increasing.
I wanted an indicator that could give me the "heads up" that bullish/ bearish strength is increasing. This would help me get into a breakout early or avoid entering a breakout that had a high probability of failure.
Here are my definitions for this indicator:
My bull bar definition:
- A green candle that closes above 75% of it's candle range.
- The candle's body does not overlap the previous candle's body. Tails/ wicks CAN overlap.
My bear bar definition:
- A red candle that closes below 75% of it's candle range.
- the candle's body does not overlap the previous candle's body. Tails/ ticks CAN overlap.
Bullish strength increasing (arrow up):
- Bull bars are increasing in size (the candle's range) compared to previous 5 bars.
- 2 consecutive bull bars.
Bearish strength increasing (arrow down):
- Bear bars are increasing in size (the candle's range) compared to previous 5 bars.
- 2 consecutive bear bars.
You will not see this indicator trigger very often but when it does - it's because there is a change in bullish bearish strength.
Things to be aware of:
Use the indicator in line with the context of the previous trend. You will get triggers that fail. These are usually because they appear counter trend. When in doubt zoom out.
It will not call every successful breakout. If you understand the definitions you'll understand why it appears.
This is my first indicator and used for my personal use. Feedback and other ideas are welcome.
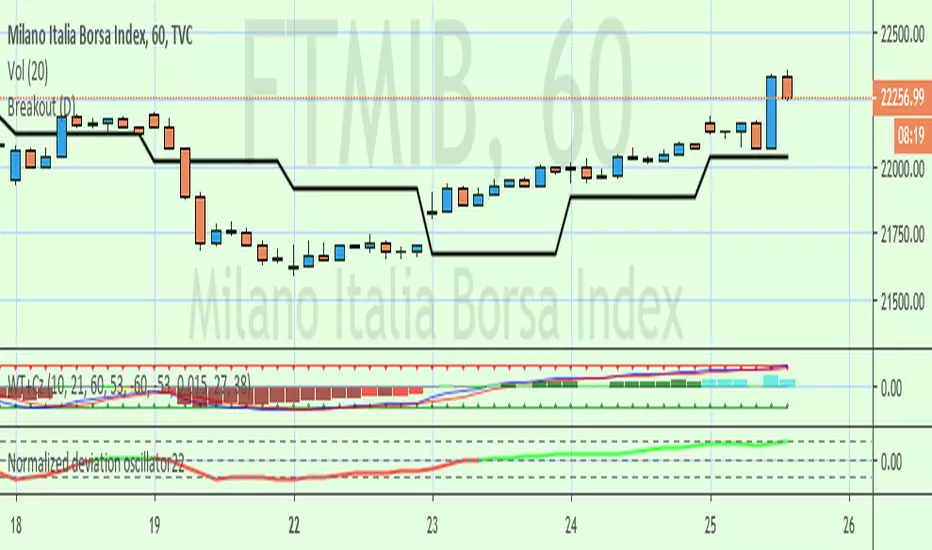
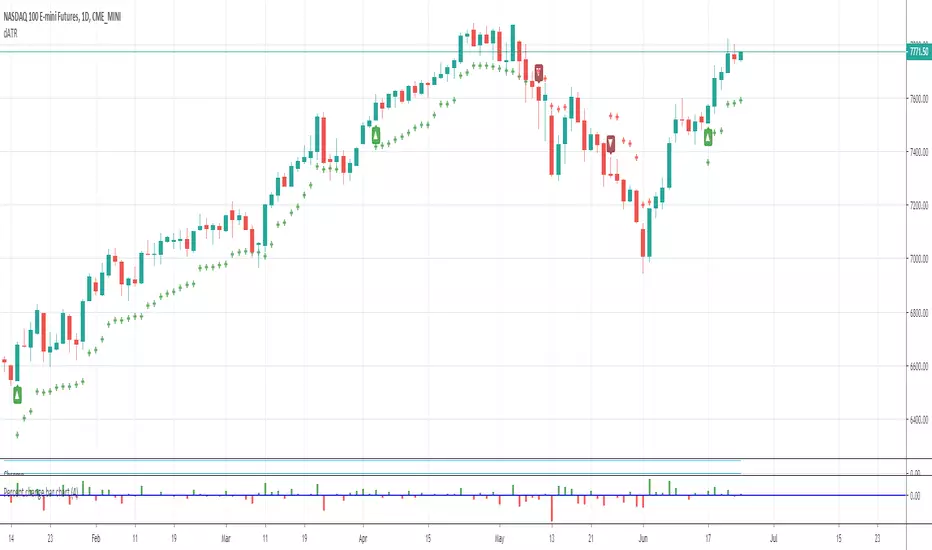
Main Market Opener Breakout [RH]Based on my observations while analyzing the crypto and forex charts, particularly BTCUSDT and EURUSD, I have noticed that the prices exhibit significant movements during most stock market sessions, particularly during New York main market session.
With the aim of capturing these moves, I embarked on extensive research. Through this research, I discovered that by considering the very first "15m" or "30m" candle of the main market trading session and marking that first candle's high and low points, we can create potential trigger points.
A break above the high point indicates a bullish signal, while a break below the low point suggests a bearish signal. To further refine our analysis and filter out some noise, we can incorporate the Average True Range (ATR) value of that candle.
Candle time is very important here. We will mark the candle when the actual trading begins in New York stock exchange. The trading hours for the New York Stock Exchange (NYSE) typically begin at 9:30 AM and end at 4:00 PM Eastern Time (ET), Monday through Friday. This is known as the "NYSE Regular Trading Session." However, it's important to note that there are also pre-market and after-hours trading sessions that occur outside of these core hours. We will not consider these pre and after-hours.
Example:
First break-above and break-below is marked automatically and alerts are also available for first breaks.
Example:
I have also added the option to add the, London Stock Exchange Main Market and Tokyo Stock Exchange Regular Trading Session. You can add those sessions also and test with different symbols.
Stocks symbols from different stock exchanges just mark the very first candle of the day(main market trading session).
Alerts are available.

Luxy BIG beautiful Dynamic ORBThis is an advanced Opening Range Breakout (ORB) indicator that tracks price breakouts from the first 5, 15, 30, and 60 minutes of the trading session. It provides complete trade management including entry signals, stop-loss placement, take-profit targets, and position sizing calculations.
The ORB strategy is based on the concept that the opening range of a trading session often acts as support/resistance, and breakouts from this range tend to lead to significant moves.
What Makes This Different?
Most ORB indicators simply draw horizontal lines and leave you to figure out the rest. This indicator goes several steps further:
Multi-Stage Tracking
Instead of just one ORB timeframe, this tracks FOUR simultaneously (5min, 15min, 30min, 60min). Each stage builds on the previous one, giving you multiple trading opportunities throughout the session.
Active Trade Management
When a breakout occurs, the indicator automatically calculates and displays entry price, stop-loss, and multiple take-profit targets. These lines extend forward and update in real-time until the trade completes.
Cycle Detection
Unlike indicators that only show the first breakout, this tracks the complete cycle: Breakout → Retest → Re-breakout. You can see when price returns to test the ORB level after breaking out (potential re-entry).
Failed Breakout Warning
If price breaks out but quickly returns inside the range (within a few bars), the label changes to "FAILED BREAK" - warning you to exit or avoid the trade.
Position Sizing Calculator
Built-in risk management that tells you exactly how many shares to buy based on your account size and risk tolerance. No more guessing or manual calculations.
Advanced Filtering
Optional filters for volume confirmation, trend alignment, and Fair Value Gaps (FVG) to reduce false signals and improve win rate.
Core Features Explained
### 1. Multi-Stage ORB Levels
The indicator builds four separate Opening Range levels:
ORB 5 - First 5 minutes (fastest signals, most volatile)
ORB 15 - First 15 minutes (balanced, most popular)
ORB 30 - First 30 minutes (slower, more reliable)
ORB 60 - First 60 minutes (slowest, most confirmed)
Each level is drawn as a horizontal range on your chart. As time progresses, the ranges expand to include more price action. You can enable or disable any stage and assign custom colors to each.
How it works: During the opening minutes, the indicator tracks the highest high and lowest low. Once the time period completes, those levels become your ORB high and low for that stage.
### 2. Breakout Detection
When price closes outside the ORB range, a label appears:
BREAK UP (green label above price) - Price closed above ORB High
BREAK DOWN (red label below price) - Price closed below ORB Low
The label shows which ORB stage triggered (ORB5, ORB15, etc.) and the cycle number if tracking multiple breakouts.
Important: Signals appear on bar close only - no repainting. What you see is what you get.
### 3. Retest Detection
After price breaks out and moves away, if it returns to test the ORB level, a "RETEST" label appears (orange). This indicates:
The original breakout level is now acting as support/resistance
Potential re-entry opportunity if you missed the first breakout
Confirmation that the level is significant
The indicator requires price to move a minimum distance away before considering it a valid retest (configurable in settings).
### 4. Failed Breakout Detection
If price breaks out but returns inside the ORB range within a few bars (before the breakout is "committed"), the original label changes to "FAILED BREAK" in orange.
This warns you:
The breakout lacked conviction
Consider exiting if already in the trade
Wait for better setup
Committed Breakout: The indicator tracks how many bars price stays outside the range. Only after staying outside for the minimum number of bars does it become a committed breakout that can be retested.
### 5. TP/SL Lines (Trade Management)
When a breakout occurs, colored horizontal lines appear showing:
Entry Line (cyan for long, orange for short) - Your entry price (the ORB level)
Stop Loss Line (red) - Where to exit if trade goes against you
TP1, TP2, TP3 Lines (same color as entry) - Profit targets at 1R, 2R, 3R
These lines extend forward as new bars form, making it easy to track your trade. When a target is hit, the line turns green and the label shows a checkmark.
Lines freeze (stop updating) when:
Stop loss is hit
The final enabled take-profit is hit
End of trading session (optional setting)
### 6. Position Sizing Dashboard
The dashboard (bottom-left corner by default) shows real-time information:
Current ORB stage and range size
Breakout status (Inside Range / Break Up / Break Down)
Volume confirmation (if filter enabled)
Trend alignment (if filter enabled)
Entry and Stop Loss prices
All enabled Take Profit levels with percentages
Risk/Reward ratio
Position sizing: Max shares to buy and total risk amount
Position Sizing Example:
If your account is $25,000 and you risk 1% per trade ($250), and the distance from entry to stop loss is $0.50, the calculator shows you can buy 500 shares (250 / 0.50 = 500).
### 7. FVG Filter (Fair Value Gap)
Fair Value Gaps are price inefficiencies - gaps left by strong momentum where one candle's high doesn't overlap with a previous candle's low (or vice versa).
When enabled, this filter:
Detects bullish and bearish FVGs
Draws semi-transparent boxes around these gaps
Only allows breakout signals if there's an FVG near the breakout level
Why this helps: FVGs indicate institutional activity. Breakouts through FVGs tend to be stronger and more reliable.
Proximity setting: Controls how close the FVG must be to the ORB level. 2.0x means the breakout can be within 2 times the FVG size - a reasonable default.
### 8. Volume & Trend Filters
Volume Filter:
Requires current volume to be above average (customizable multiplier). High volume breakouts are more likely to sustain.
Set minimum multiplier (e.g., 1.5x = 50% above average)
Set "strong volume" multiplier (e.g., 2.5x) that bypasses other filters
Dashboard shows current volume ratio
Trend Filter:
Only shows breakouts aligned with a higher timeframe trend. Choose from:
VWAP - Price above/below volume-weighted average
EMA - Price above/below exponential moving average
SuperTrend - ATR-based trend indicator
Combined modes (VWAP+EMA, VWAP+SuperTrend) for stricter filtering
### 9. Pullback Filter (Advanced)
Purpose:
Waits for price to pull back slightly after initial breakout before confirming the signal.
This reduces false breakouts from immediate reversals.
How it works:
- After breakout is detected, indicator waits for a small pullback (default 2%)
- Once pullback occurs AND price breaks out again, signal is confirmed
- If no pullback within timeout period (5 bars), signal is issued anyway
Settings:
Enable Pullback Filter: Turn this filter on/off
Pullback %: How much price must pull back (2% is balanced)
Timeout (bars): Max bars to wait for pullback (5 is standard)
When to use:
- Choppy markets with many fake breakouts
- When you want higher quality signals
- Combine with Volume filter for maximum confirmation
Trade-off:
- Better signal quality
- May miss some valid fast moves
- Slight entry delay
How to Use This Indicator
### For Beginners - Simple Setup
Add the indicator to your chart (5-minute or 15-minute timeframe recommended)
Leave all default settings - they work well for most stocks
Watch for BREAK UP or BREAK DOWN labels to appear
Check the dashboard for entry, stop loss, and targets
Use the position sizing to determine how many shares to buy
Basic Trading Plan:
Wait for a clear breakout label
Enter at the ORB level (or next candle open if you're late)
Place stop loss where the red line indicates
Take profit at TP1 (50% of position) and TP2 (remaining 50%)
### For Advanced Traders - Customized Setup
Choose which ORB stages to track (you might only want ORB15 and ORB30)
Enable filters: Volume (stocks) or Trend (trending markets)
Enable FVG filter for institutional confirmation
Set "Track Cycles" mode to catch retests and re-breakouts
Customize stop loss method (ATR for volatile stocks, ORB% for stable ones)
Adjust risk per trade and account size for accurate position sizing
Advanced Strategy Example:
Enable ORB15 only (disable others for cleaner chart)
Turn on Volume filter at 1.5x with Strong at 2.5x
Enable Trend filter using VWAP
Set Signal Mode to "Track Cycles" with Max 3 cycles
Wait for aligned breakouts (Volume + Trend + Direction)
Enter on retest if you missed the initial break
### Timeframe Recommendations
5-minute chart: Scalping, very active trading, crypto
15-minute chart: Day trading, balanced approach (most popular)
30-minute chart: Swing entries, less screen time
60-minute chart: Position trading, longer holds
The indicator works on any intraday timeframe, but ORB is fundamentally a day trading strategy. Daily charts don't make sense for ORB.
DEFAULT CONFIGURATION
ON by Default:
• All 4 ORB stages (5/15/30/60)
• Breakout Detection
• Retest Labels
• All TP levels (1/1.5/2/3)
• TP/SL Lines (Detailed mode)
• Dashboard (Bottom Left, Dark theme)
• Position Size Calculator
OFF by Default (Optional Filters):
• FVG Filter
• Pullback Filter
• Volume Filter
• Trend Filter
• HTF Bias Check
• Alerts
Recommended for Beginners:
• Leave all defaults
• Session Mode: Auto-Detect
• Signal Mode: Track Cycles
• Stop Method: ATR
• Add Volume Filter if trading stocks
Recommended for Advanced:
• Enable ORB15 + ORB30 only (disable 5 & 60)
• Enable: Volume + Trend + FVG
• Signal Mode: Track Cycles, Max 3
• Stop Method: ATR or Safer
• Enable HTF Daily bias check
## Settings Guide
The settings are organized into logical groups. Here's what each section controls:
### ORB COLORS Section
Show Edge Labels: Display "ORB 5", "ORB 15" labels at the right edge of the levels
Background: Fill the area between ORB high/low with color
Transparency: How see-through the background is (95% is nearly invisible)
Enable ORB 5/15/30/60: Turn each stage on or off individually
Colors: Assign colors to each ORB stage for easy identification
### SESSION SETTINGS Section
Session Mode: Choose trading session (Auto-Detect works for most instruments)
Custom Session Hours: Define your own hours if needed (format: HHMM-HHMM)
Auto-Detect uses the instrument's natural hours (stocks use exchange hours, crypto uses 24/7).
### BREAKOUT DETECTION Section
Enable Breakout Detection: Master switch for signals
Show Retest Labels: Display retest signals
Label Size: Visual size for all labels (Small recommended)
Enable FVG Filter: Require Fair Value Gap confirmation
Show FVG Boxes: Display the gap boxes on chart
Signal Mode: "First Only" = one signal per direction per day, "Track Cycles" = multiple signals
Max Cycles: How many breakout-retest cycles to track (6 is balanced)
Breakout Buffer: Extra distance required beyond ORB level (0.1-0.2% recommended)
Min Distance for Retest: How far price must move away before retest is valid (2% recommended)
Min Bars Outside ORB: Bars price must stay outside for committed breakout (2 is balanced)
### TARGETS & RISK Section
Enable Targets & Stop-Loss: Calculate and show trade management
TP1/TP2/TP3 checkboxes: Select which profit targets to display
Stop Method: How to calculate stop loss placement
- ATR: Based on volatility (best for most cases)
- ORB %: Fixed % of ORB range
- Swing: Recent swing high/low
- Safer: Widest of all methods
ATR Length & Multiplier: Controls ATR stop distance (14 period, 1.5x is standard)
ORB Stop %: Percentage beyond ORB for stop (20% is balanced)
Swing Bars: Lookback period for swing high/low (3 is recent)
### TP/SL LINES Section
Show TP/SL Lines: Display horizontal lines on chart
Label Format: "Short" = minimal text, "Detailed" = shows prices
Freeze Lines at EOD: Stop extending lines at session close
### DASHBOARD Section
Show Info Panel: Display the metrics dashboard
Theme: Dark or Light colors
Position: Where to place dashboard on chart
Toggle rows: Show/hide specific information rows
Calculate Position Size: Enable the position sizing calculator
Risk Mode: Risk fixed $ amount or % of account
Account Size: Your total trading capital
Risk %: Percentage to risk per trade (0.5-1% recommended)
### VOLUME FILTER Section
Enable Volume Filter: Require volume confirmation
MA Length: Average period (20 is standard)
Min Volume: Required multiplier (1.5x = 50% above average)
Strong Volume: Multiplier that bypasses other filters (2.5x)
### TREND FILTER Section
Enable Trend Filter: Require trend alignment
Trend Mode: Method to determine trend (VWAP is simple and effective)
Custom EMA Length: If using EMA mode (50 for swing, 20 for day trading)
SuperTrend settings: Period and Multiplier if using SuperTrend mode
### HIGHER TIMEFRAME Section
Check Daily Trend: Display higher timeframe bias in dashboard
Timeframe: What TF to check (D = daily, recommended)
Method: Price vs MA (stable) or Candle Direction (reactive)
MA Period: EMA length for Price vs MA method (20 is balanced)
Min Strength %: Minimum strength threshold for HTF bias to be considered
- For "Price vs MA": Minimum distance (%) from moving average
- For "Candle Direction": Minimum candle body size (%)
- 0.5% is balanced - increase for stricter filtering
- Lower values = more signals, higher values = only strong trends
### ALERTS Section
Enable Alerts: Master switch (must be ON to use any alerts)
Breakout Alerts: Notify on ORB breakouts
Retest Alerts: Notify when price retests after breakout
Failed Break Alerts: Notify on failed breakouts
Stage Complete Alerts: Notify when each ORB stage finishes forming
After enabling desired alert types, click "Create Alert" button, select this indicator, choose "Any alert() function call".
## Tips & Best Practices
### General Trading Tips
ORB works best on liquid instruments (stocks with good volume, major crypto pairs)
First hour of the session is most important - that's when ORB is forming
Breakouts WITH the trend have higher success rates - use the trend filter
Failed breakouts are common - use the "Min Bars Outside" setting to filter weak moves
Not every day produces good ORB setups - be patient and selective
### Position Sizing Best Practices
Never risk more than 1-2% of your account on a single trade
Use the built-in calculator - don't guess your position size
Update your account size monthly as it grows
Smaller accounts: use $ Amount mode for simplicity
Larger accounts: use % of Account mode for scaling
### Take Profit Strategy
Most traders use: 50% at TP1, 50% at TP2
Aggressive: Hold through TP1 for TP2 or TP3
Conservative: Full exit at TP1 (1:1 risk/reward)
After TP1 hits, consider moving stop to breakeven
TP3 rarely hits - only on strong trending days
### Filter Combinations
Maximum Quality: Volume + Trend + FVG (fewest signals, highest quality)
Balanced: Volume + Trend (good quality, reasonable frequency)
Active Trading: No filters or Volume only (many signals, lower quality)
Trending Markets: Trend filter essential (indices, crypto)
Range-Bound: Volume + FVG (avoid trend filter)
### Common Mistakes to Avoid
Chasing breakouts - wait for the bar to close, don't FOMO into wicks
Ignoring the stop loss - always use it, move it manually if needed
Over-leveraging - the calculator shows MAX shares, you can buy less
Trading every signal - quality > quantity, use filters
Not tracking results - keep a journal to see what works for YOU
## Pros and Cons
### Advantages
Complete all-in-one solution - from signal to position sizing
Multiple timeframes tracked simultaneously
Visual clarity - easy to see what's happening
Cycle tracking catches opportunities others miss
Built-in risk management eliminates guesswork
Customizable filters for different trading styles
No repainting - what you see is locked in
Works across multiple markets (stocks, forex, crypto)
### Limitations
Intraday strategy only - doesn't work on daily charts
Requires active monitoring during first 1-2 hours of session
Not suitable for after-hours or extended sessions by default
Can produce many signals in choppy markets (use filters)
Dashboard can be overwhelming for complete beginners
Performance depends on market conditions (trends vs ranges)
Requires understanding of risk management concepts
### Best For
Day traders who can watch the first 1-2 hours of market open
Traders who want systematic entry/exit rules
Those learning proper position sizing and risk management
Active traders comfortable with multiple signals per day
Anyone trading liquid instruments with clear sessions
### Not Ideal For
Swing traders holding multi-day positions
Set-and-forget / passive investors
Traders who can't watch market open
Complete beginners unfamiliar with trading concepts
Low volume / illiquid instruments
## Frequently Asked Questions
Q: Why are no signals appearing?
A: Check that you're on an intraday timeframe (5min, 15min, etc.) and that the current time is within your session hours. Also verify that "Enable Breakout Detection" is ON and at least one ORB stage is enabled. If using filters, they might be blocking signals - try disabling them temporarily.
Q: What's the best ORB stage to use?
A: ORB15 (15 minutes) is most popular and balanced. ORB5 gives faster signals but more noise. ORB30 and ORB60 are slower but more reliable. Many traders use ORB15 + ORB30 together.
Q: Should I enable all the filters?
A: Start with no filters to see all signals. If too many false signals, add Volume filter first (stocks) or Trend filter (trending markets). FVG filter is most restrictive - use for maximum quality but fewer signals.
Q: How do I know which stop loss method to use?
A: ATR works for most cases - it adapts to volatility. Use ORB% if you want predictable stop placement. Swing is for respecting chart structure. Safer gives you the most room but largest risk.
Q: Can I use this for swing trading?
A: Not really - ORB is fundamentally an intraday strategy. The ranges reset each day. For swing trading, look at weekly support/resistance or moving averages instead.
Q: Why do TP/SL lines disappear sometimes?
A: Lines freeze (stop extending) when: stop loss is hit, the last enabled take-profit is hit, or end of session arrives (if "Freeze at EOD" is enabled). This is intentional - the trade is complete.
Q: What's the difference between "First Only" and "Track Cycles"?
A: "First Only" shows one breakout UP and one DOWN per day maximum - clean but might miss opportunities. "Track Cycles" shows breakout-retest-rebreak sequences - more signals but busier chart.
Q: Is position sizing accurate for options/forex?
A: The calculator is designed for shares (stocks). For options, ignore the share count and use the risk amount. For forex, you'll need to adapt the lot size calculation manually.
Q: How much capital do I need to use this?
A: The indicator works for any account size, but practical day trading typically requires $25,000 in the US due to Pattern Day Trader rules. Adjust the "Account Size" setting to match your capital.
Q: Can I backtest this strategy?
A: This is an indicator, not a strategy script, so it doesn't have built-in backtesting. You can visually review historical signals or code a strategy script using similar logic.
Q: Why does the dashboard show different entry price than the breakout label?
A: If you're looking at an old breakout, the ORB levels may have changed when the next stage completed. The dashboard always shows the CURRENT active range and trade setup.
Q: What's a good win rate to expect?
A: ORB strategies typically see 40-60% win rate depending on market conditions and filters used. The strategy relies on positive risk/reward ratios (2:1 or better) to be profitable even with moderate win rates.
Q: Does this work on crypto?
A: Yes, but crypto trades 24/7 so you need to define what "session start" means. Use Session Mode = Custom and set your preferred daily reset time (e.g., 0000-2359 UTC).
## Credits & Transparency
### Development
This indicator was developed with the assistance of AI technology to implement complex ORB trading logic.
The strategy concept, feature specifications, and trading logic were designed by the publisher. The implementation leverages modern development tools to ensure:
Clean, efficient, and maintainable code
Comprehensive error handling and input validation
Detailed documentation and user guidance
Performance optimization
### Trading Concepts
This indicator implements several public domain trading concepts:
Opening Range Breakout (ORB): Trading strategy popularized by Toby Crabel, Mark Fisher and many more talanted traders.
Fair Value Gap (FVG): Price imbalance concept from ICT methodology
SuperTrend: ATR-based trend indicator using public formula
Risk/Reward Ratio: Standard risk management principle
All mathematical formulas and technical concepts used are in the public domain.
### Pine Script
Uses standard TradingView built-in functions:
ta.ema(), ta.atr(), ta.vwap(), ta.highest(), ta.lowest(), request.security()
No external libraries or proprietary code from other authors.
## Disclaimer
This indicator is provided for educational and informational purposes only. It is not financial advice.
Trading involves substantial risk of loss and is not suitable for every investor. Past performance shown in examples is not indicative of future results.
The indicator provides signals and calculations, but trading decisions are solely your responsibility. Always:
Test strategies on paper before using real money
Never risk more than you can afford to lose
Understand that all trading involves risk
Consider seeking advice from a licensed financial advisor
The publisher makes no guarantees regarding accuracy, profitability, or performance. Use at your own risk.
---
Version: 3.0
Pine Script Version: v6
Last Updated: October 2024
For support, questions, or suggestions, please comment below or send a private message.
---
Happy trading, and remember: consistent risk management beats perfect entry timing every time.

Multi-Timeframe S/R & Breakout Projection1) What This Script Does
Collects S/R levels from the 15-minute and 1-hour timeframes, using each timeframe’s pivot detection.
Sorts those pivot-based levels by their distance from the current price, so you see the nearest levels first.
Draws up to a user-defined number of those levels as horizontal rays on the current chart.
Checks breakouts at the nearest S/R line (the one with the smallest distance from price):
Real Breakout: price breaks above a level and sustains above it for the specified number of bars.
False Breakout: price breaks above but quickly closes back below within the specified lookback.
On confirmation of a real or false breakout, that S/R line changes color to green if price is going higher, or red if price is going lower.
Displays a small table in the corner with:
Daily Trend: bullish or bearish, using an SMA on a 30-minute timeframe.
Sentiment: bullish or bearish, using RSI on the same 30-minute timeframe.
2) How It Works
Multi-Timeframe Pivot Detection
The script uses request.security() to fetch pivot highs/lows from two higher timeframes (15m and 60m).
It collects up to a user-specified number of these pivots (numRecent) from each TF.
Sorting & Plotting S/R Lines
Once pivot values are gathered, the script calculates their “distance” from current price.
It sorts them so that the S/R lines drawn on your chart are the nearest ones first.
Each line is drawn with a color and style you can customize:
srRayColor sets the overall color (e.g. yellow).
srRayStyleOptions can be Solid, Dashed, or Dotted.
Breakout Determination
After drawing the lines, the script looks at the nearest line and applies two specialized checks (f_isFalseBreakout & f_isRealBreakout):
A real breakout occurs if price closes above (or below) and remains on that side for breakLook bars.
A false breakout occurs if price closes above (or below) but quickly returns.
When a breakout is confirmed, that nearest line changes color to:
Green if price is ultimately going up,
Red if price is going down.
Daily Trend & Sentiment Table
A small table in the bottom-right corner shows:
Daily Trend: uses a 30-minute SMA to see if your price is above/below on that timeframe.
Sentiment: uses the RSI (also on 30m). A value over 50 suggests bullish sentiment; under 50 suggests bearish.
3) How to Use It
Timeframes & Pivots
Choose how many pivots (numRecent) from each TF to fetch (up to 10 total). A higher number means you’ll see more historical S/R lines.
Customize pivotLeft & pivotRight for how “wide” the pivot detection is.
Line Customization
In the script’s Inputs tab, you’ll find:
S/R Rays Color – sets the hue of the lines.
S/R Line Style – pick from Solid, Dashed, or Dotted.
Liquidity Lines Color – color for the smaller pivot lines from your chart timeframe’s pivot detection.
Breakout Lookback
breakLook determines how many bars must confirm or refute the breakout. Adjust it based on how conservative or aggressive you want the breakout detection.
Check the Table
In the bottom-right, watch the script’s “Daily Trend” & “Sentiment”. This can be a quick filter for trades:
“Bullish” daily trend with a bullish sentiment is often more favorable for long trades.
Conversely, “Bearish” daily trend & sentiment can confirm short ideas.
Scenarios
If you see a “Real Breakout” label near the line, the script recolors that line green or red, indicating a possible continuous move.
A “False Breakout” label suggests the price has quickly retraced.
4) Originality & Concepts
Multi-Timeframe Approach: Many S/R indicators fetch only local pivot lines; here, we explicitly gather pivot points from two separate TFs (15m & 60m) and project them onto your lower timeframe chart.
Distance-Based Sorting ensures you only see the nearest lines on the chart, preventing clutter from excessive lines.
Breakout Logic used is straightforward but effective: it checks if price truly holds beyond a level (real breakout) or fails to hold (false breakout).
Line Recoloring provides immediate visual feedback on the success or failure of the breakout.
5) Chart Usage
Plot this script on a relatively low timeframe chart (like the 1m, 5m, or 15m) to see the higher timeframe S/R lines.
Select how many S/R lines you want to show, choose the line style, set your pivot detection parameters, then watch for breakouts.
Tips:
Start with fewer lines (maxLevels=3 or 5) so the chart remains clear.
You can experiment with a small breakLook if you want more immediate breakout signals, or a higher breakLook if you need stronger confirmation.
Enjoy using the “Multi-Timeframe S/R & Breakout Projection” script! It simplifies the manual process of spotting higher timeframe pivot lines and helps you quickly assess potential breakouts or fakes on your intraday charts, all while giving you a snapshot of the higher timeframe’s trend and sentiment.

Pivot Channel Breaks [BigBeluga]Pivot Channel Break
The Pivot Channel Break indicator identifies key pivot points and creates a dynamic channel based on these pivots. It detects breakouts from this channel, providing potential entry and exit signals for traders.
🔵 How to Use
Channel Identification:
- Upper and lower channel lines drawn based on pivot highs and lows
- Channel width dynamically adjusted using ATR-like calculation
Breakout Signals:
- Upward breakout: Price closes above upper channel line
- Downward breakout: Price closes below lower channel line
- Signals shown as X marks on the chart
Pivot Points:
- High pivots marked with "H" triangles
- Low pivots marked with "L" triangles
Support & Resistance:
- Optional signals when price touches but doesn't break channel lines
Trend Visualization:
- Optional bar coloring based on the most recent breakout direction
🔵 Customization
• Pivot Right: Lookback period for pivot detection (default: 10)
• Pivot Left: Forward period for pivot confirmation (default: 40)
• Channel Width: Multiplier for channel width calculation (default: 1.0)
• Support & Resistance Signals: Toggle additional touch signals
• Bar Color: Enable/disable trend-based bar coloring
Calculation:
Detect pivot highs and lows using specified lookback periods
Calculate channel basis using 10-period SMA of close prices
Determine channel width using ATR-like calculation: RMA(high - low, 10) * width multiplier
Set channel lines based on pivot points and calculated deviations
Identify breakouts when price crosses beyond channel lines
The Pivot Channel Break indicator offers a dynamic approach to identifying potential trend changes and breakout opportunities. It combines pivot point analysis with a flexible channel calculation, providing traders with a visual tool for market structure analysis. Use this indicator in conjunction with other technical analysis methods to confirm signals and manage risk effectively.

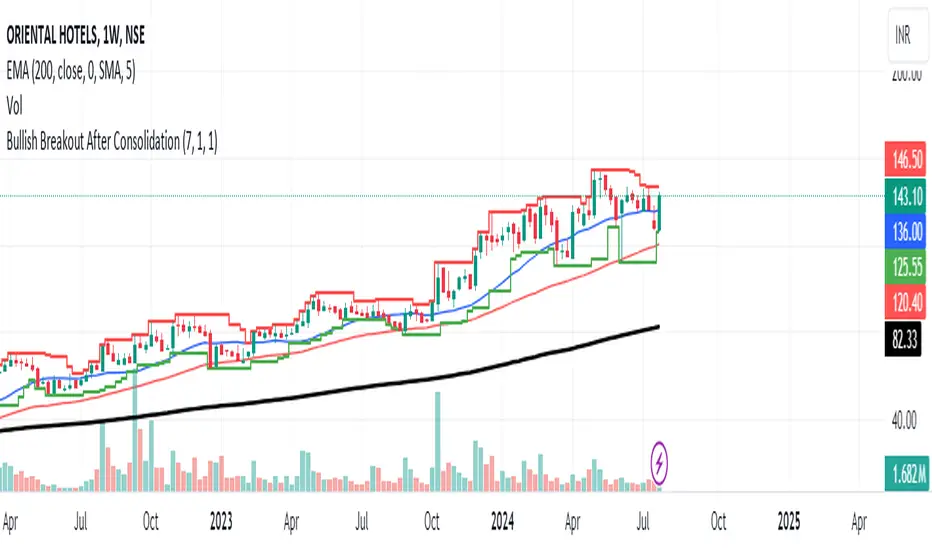
Bullish Breakout After ConsolidationDescription:
The Bullish Breakout After Consolidation Indicator is designed to help traders identify potential bullish breakout opportunities following a period of tight price consolidation. This indicator combines price action and volume analysis to signal when a stock may experience a significant upward movement.
Features:
Consolidation Range Tightness: The indicator identifies periods where the stock price consolidates within a narrow range, defined as a range less than 2% of the lowest low during the consolidation period. This tight consolidation is often a precursor to strong price movements.
Breakout Detection: Once the price breaks above the highest high of the consolidation range, and this breakout occurs after a specified number of days post-consolidation, the indicator marks it as a potential breakout opportunity.
Volume Confirmation: To avoid false breakouts, the indicator requires increased trading volume during the breakout. This ensures that the breakout is supported by substantial market activity.
Visual Cues:
Breakout Label: A "Breakout" label appears above the bar where a valid breakout occurs, making it easy to spot potential entry points.
Support and Resistance Lines: Horizontal lines plot the highest high (resistance) and lowest low (support) during the consolidation period, helping traders visualize the breakout levels.
Moving Averages: Optional 20-day and 50-day simple moving averages are plotted for additional trend confirmation.
How to Use:
Apply the Indicator: Add the indicator to your chart in TradingView to start analyzing potential breakouts.
Observe Consolidation: Look for tight consolidation periods where the price trades within a narrow range.
Identify Breakouts: Watch for breakouts where the price moves above the highest high of the consolidation range, supported by increased volume.
Confirm with Labels: The "Breakout" label will help you quickly identify valid breakout signals.
Parameters:
Consolidation Length: Number of days to consider for consolidation.
Range Percentage: Maximum percentage range for consolidation tightness.
Days After Consolidation: Number of days post-consolidation to check for the breakout.
Note: As with any trading tool, it is important to use this indicator as part of a broader trading strategy and in conjunction with other forms of analysis.
Disclaimer: This indicator is provided for educational purposes and should not be construed as financial advice. Trading involves risk and may not be suitable for all investors.
Lakshmi - Low Volatility Range Breakout (LVRB)⚡️ Overview
The Low Volatility Range Breakout (LVRB) indicator is designed to identify consolidation phases characterized by suppressed volatility and generate actionable signals when price breaks out of these ranges. The underlying premise is rooted in the market principle that periods of low volatility often precede significant directional moves—volatility contraction leads to expansion.
Important Note on Optimization: The default parameter settings of this indicator have been specifically optimized for BTCUSDT on the 2-hour (2H) timeframe. While the indicator can be applied to other instruments and timeframes, users are encouraged to adjust the parameters accordingly to suit different trading conditions and asset characteristics.
This indicator automates the detection of "quiet" accumulation/distribution zones and provides clear visual cues and alerts when a breakout occurs.
⚡️ How to Use
1. Add the indicator to your chart. Default settings are optimized for BTCUSDT 2H.
2. Wait for a gray box to appear—this indicates a qualified low-volatility range is forming.
3. Monitor for breakout signals:
• LONG (green triangle below bar): Price broke above the range. Consider entering a long position.
• SHORT (red triangle above bar): Price broke below the range. Consider entering a short position.
4. Set alerts using "LVRB LONG" or "LVRB SHORT" to receive notifications on confirmed breakouts.
5. Adjust parameters as needed for different instruments or timeframes.
Tip: Combine with volume analysis or trend filters for higher-probability setups.
⚡️ How It Works
1. Low Volatility Bar Detection
A bar is classified as "low volatility" when it meets the following criteria:
• True Range (TR) is at or below the average TR (Simple Moving Average) multiplied by a user-defined threshold.
• (Optional) Candle Body is at or below the average body size multiplied by a separate threshold.
This dual-filter approach helps isolate bars that exhibit genuine compression in both range and directional commitment.
2. Range Box Formation
When consecutive low-volatility bars are detected, the indicator begins constructing a consolidation box:
• The box expands to encompass the high and low of qualifying bars.
• A minimum number of bars and a minimum fraction of low-volatility bars are required for the box to become "qualified" (active).
• A configurable tolerance allows for a limited number of consecutive non-low-vol bars within the sequence, accommodating minor noise without invalidating the range.
• If the box height exceeds a maximum threshold (defined as a multiple of the base ATR at sequence start), the range is invalidated.
3. Breakout Detection
Once a qualified range is established, the indicator monitors for breakouts:
• Wick Mode: Requires both a wick pierce beyond the range boundary AND a close outside the range.
• Close Mode: Requires only a close beyond the range boundary.
• (Optional) Breakout Body Filter: The breakout candle's body must exceed a multiple of the average body size at range formation.
• (Optional) Candle Direction Filter: Bullish breakouts require a green candle; bearish breakouts require a red candle.
Signals are displayed in real-time and confirmed upon bar close.
⚡️ Inputs & Parameters
• Volatility Window: Lookback period for calculating average TR and average body size.
• TR Multiplier: A bar's TR must be ≤ avgTR × this value to qualify as low-vol.
• Body Multiplier: A bar's body must be ≤ avgBody × this value (if body filter is enabled).
• Use Body Filter: Toggle the body size filter on/off.
• Min Bars in Box: Minimum number of bars required for a range to become qualified.
• Min Low-Vol Fraction: Minimum proportion of bars in the sequence that must be low-vol.
• Allowed Consecutive Non-Low-Vol Bars: Tolerance for consecutive bars that do not meet low-vol criteria.
• Max Box Height: Maximum allowed range height as a multiple of the base ATR.
• Breakout Mode: Choose between "Wick" (pierce + close) or "Close" (close only).
• Breakout Body Multiplier: Require breakout candle body ≥ avgBody × this value (1.0 = OFF).
• Require Candle Direction: Enforce green candle for LONG, red candle for SHORT.
⚡️ Visual Features
• Consolidation Boxes: Displayed in neutral (gray) color during formation. Upon a confirmed breakout, the box is colored green for bullish breakouts or red for bearish breakouts.
• Breakout Signals:
• LONG: Green upward triangle displayed below the price bar with "LONG" label.
• SHORT: Red downward triangle displayed above the price bar with "SHORT" label.
• Range Levels: Optional horizontal plots for the active range's high and low.
• Invalidated Boxes: Optionally retained in neutral (gray) color or deleted from the chart.
• Full Customization: Colors, transparency, and border width are all adjustable.
⚡️ Alerts
Two alert conditions are available:
• LVRB LONG: Triggered on a confirmed bullish breakout (bar close).
• LVRB SHORT: Triggered on a confirmed bearish breakout (bar close).
⚡️ Use Cases
• Breakout Trading: Enter positions when price escapes a well-defined low-volatility range.
• Volatility Expansion Plays: Anticipate increased volatility following periods of compression.
• Filtering Choppy Markets: Avoid trading during extended consolidation; wait for confirmed breakouts.
• Multi-Timeframe Analysis: Use on higher timeframes to identify major consolidation zones.
⚡️ Notes
• Best used in conjunction with volume analysis, trend context, or support/resistance levels for confirmation.
• Performance varies across instruments and timeframes; backtesting and parameter optimization are recommended.
⚡️ Credits
Developed by Lakshmi. Inspired by volatility contraction principles and range breakout methodologies.
⚡️ Disclaimer
This indicator is provided for educational and informational purposes only. It does not constitute financial advice, investment recommendations, or a guarantee of profits. Trading financial instruments involves substantial risk, and you may lose more than your initial investment. Past performance, whether indicated by backtesting or historical analysis, does not guarantee future results. The use of this indicator does not ensure or promise any profits or protection against losses. Users are solely responsible for their own trading decisions and should conduct their own research and/or consult with a qualified financial advisor before making any investment decisions. By using this indicator, you acknowledge and accept that you bear full responsibility for any trading outcomes.

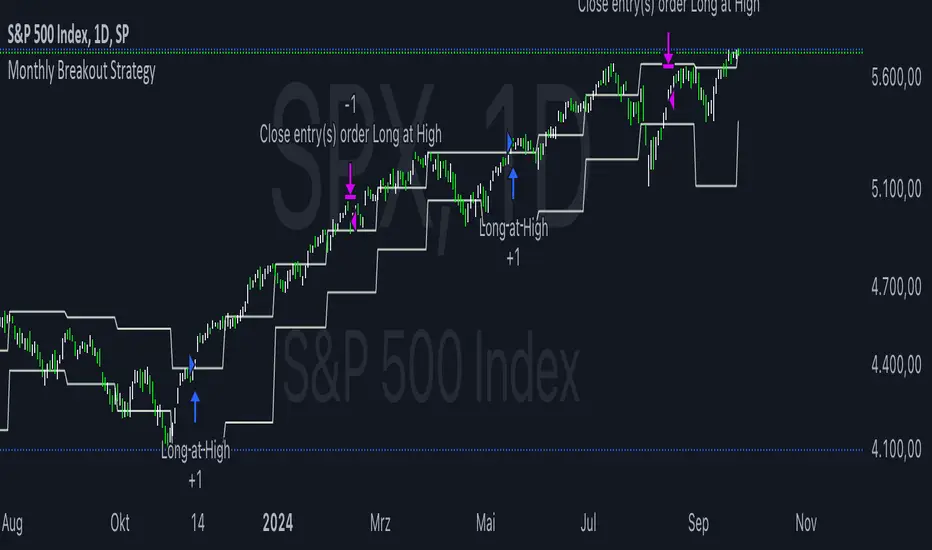
Monthly Breakout StrategyThis Monthly High/Low Breakout Strategy is designed to take long or short positions based on breakouts from the high or low of the previous month. Users can select whether they want to go long at a breakout above the previous month’s high, short at a breakdown below the previous month’s low, or use the reverse logic. Additionally, it includes a month filter, allowing trades to be executed only during user-specified months.
Breakout strategies, particularly those based on monthly highs and lows, aim to capitalize on price momentum. These systems rely on the assumption that once a significant price level is breached (such as the previous month's high or low), the market is likely to continue moving in the same direction due to increased volatility and trend-following behaviors by traders. Studies have demonstrated the potential effectiveness of breakout strategies in financial markets.
Scientific Evidence Supporting Breakout Strategies:
Momentum in Financial Markets:
Research on momentum-based strategies, which include breakout trading, shows that securities breaking key levels of support or resistance tend to continue their price movement in the direction of the breakout. Jegadeesh and Titman (1993) found that stocks with strong performance over a given period tend to continue performing well in subsequent periods, a principle also applied to breakout strategies.
Behavioral Finance:
The psychological factor of herd behavior is one of the driving forces behind breakout strategies. When prices break out of a key level (such as a monthly high), it triggers increased buying or selling pressure as traders join the trend. Barberis, Shleifer, and Vishny (1998) explained how cognitive biases, such as overconfidence and sentiment, can amplify price trends, which breakout strategies attempt to exploit.
Market Efficiency:
While markets are generally efficient, periods of inefficiency can occur, particularly around the breakouts of significant price levels. These inefficiencies often result in temporary price trends, which breakout strategies can exploit before the market corrects itself (Fama, 1970).
Risk Considerations:
Despite the potential for profit, the Monthly Breakout Strategy comes with several risks:
False Breakouts:
One of the most common risks in breakout strategies is the occurrence of false breakouts. These happen when the price temporarily moves above (or below) a key level but quickly reverses direction, causing losses for traders who entered positions too early. This is particularly risky in low-volatility environments.
Market Volatility:
Monthly breakout strategies rely on momentum, which may not be consistent across different market conditions. During periods of low volatility, price breakouts might lack the follow-through required for the strategy to succeed, leading to poor performance.
Whipsaw Risk:
The strategy is vulnerable to whipsaw markets, where prices oscillate around key levels without establishing a clear direction. This can result in frequent entry and exit signals that lead to losses, especially if trading costs are not managed properly.
Overfitting to Past Data:
If the month-selection filter is overly optimized based on historical data, the strategy may suffer from overfitting—performing well in backtests but poorly in real-time trading. This happens when strategies are tailored to past market conditions that may not repeat.
Conclusion:
While monthly breakout strategies can be effective in markets with strong momentum, they are subject to several risks, including false breakouts, volatility dependency, and whipsaw behavior. It is crucial to backtest this strategy thoroughly and ensure it aligns with your risk tolerance before implementing it in live trading.
References:
Jegadeesh, N., & Titman, S. (1993). Returns to Buying Winners and Selling Losers: Implications for Stock Market Efficiency. Journal of Finance, 48(1), 65-91.
Barberis, N., Shleifer, A., & Vishny, R. (1998). A Model of Investor Sentiment. Journal of Financial Economics, 49(3), 307-343.
Fama, E. F. (1970). Efficient Capital Markets: A Review of Theory and Empirical Work. Journal of Finance, 25(2), 383-417.
Swing Failure Pattern SFP [TradingFinder] SFP ICT Strategy🔵 Introduction
The Swing Failure Pattern (SFP), also referred to as a "Fake Breakout" or "False Breakout," is a vital concept in technical analysis. This pattern is derived from classic technical analysis, price action strategies, ICT concepts, and Smart Money Concepts.
It’s frequently utilized by traders to identify potential trend reversals in financial markets, especially in volatile markets like cryptocurrencies and forex. SFP helps traders recognize failed attempts to breach key support or resistance levels, providing strategic opportunities for trades.
The Swing Failure Pattern (SFP) is a popular strategy among traders used to identify false breakouts and potential trend reversals in the market. This strategy involves spotting moments where the price attempts to break above or below a previous high or low (breakout) but fails to sustain the move, leading to a sharp reversal.
Traders use this strategy to identify liquidity zones where stop orders (stop hunt) are typically placed and targeted by larger market participants or whales.
When the price penetrates these areas but fails to hold the levels, a liquidity sweep occurs, signaling exhaustion in the trend and a potential reversal. This strategy allows traders to enter the market at the right time and capitalize on opportunities created by false breakouts.
🟣 Types of SFP
When analyzing SFPs, two main variations are essential :
Real SFP : This occurs when the price breaks a critical level but fails to close above it, then quickly reverses. Due to its clarity and strong signal, this SFP type is highly reliable for traders.
Considerable SFP : In this scenario, the price closes slightly above a key level but quickly declines. Although significant, it is not as definitive or trustworthy as a Real SFP.
🟣 Understanding SFP
The Swing Failure Pattern, or False Breakout, is identified when the price momentarily breaks a crucial support or resistance level but cannot maintain the movement, leading to a rapid reversal.
The pattern can be categorized as follows :
Bullish SFP : This type occurs when the price dips below a support level but rebounds above it, signaling that sellers failed to push the price lower, indicating a potential upward trend.
Bearish SFP : This pattern forms when the price surpasses a resistance level but fails to hold, suggesting that buyers couldn’t maintain the higher price, leading to a potential decline.
🔵 How to Use
To effectively identify an SFP or Fake Breakout on a price chart, traders should follow these steps :
Identify Key Levels: Locate significant support or resistance levels on the chart.
Observe the Fake Breakout: The price should break the identified level but fail to close beyond it.
Monitor Price Reversal: After the breakout, the price should quickly reverse direction.
Execute the Trade: Traders typically enter the market after confirming the SFP.
🟣 Examples
Bullish Example : Bitcoin breaks below a $30,000 support level, drops to $29,000, but closes above $30,000 by the end of the day, signaling a Real Bullish SFP.
Bearish Example : Ethereum surpasses a $2,000 resistance level, rises to $2,100, but then falls back below $2,000, forming a Bearish SFP.
🟣 Pros and Cons of SFP
Pros :
Effective in identifying strong reversal points.
Offers a favorable risk-to-reward ratio.
Applicable across different timeframes.
Cons :
Requires experience and deep market understanding.
Risk of encountering false breakouts.
Should be combined with other technical tools for optimal effectiveness.
🔵 Settings
🟣 Logical settings
Swing period : You can set the swing detection period.
SFP Type : Choose between "All", "Real" and "Considerable" modes to identify the swing failure pattern.
Max Swing Back Method : It is in two modes "All" and "Custom". If it is in "All" mode, it will check all swings, and if it is in "Custom" mode, it will check the swings to the extent you determine.
Max Swing Back : You can set the number of swings that will go back for checking.
🟣 Display settings
Displaying or not displaying swings and setting the color of labels and lines.
🟣 Alert Settings
Alert SFP : Enables alerts for Swing Failure Pattern.
Message Frequency : Determines the frequency of alerts. Options include 'All' (every function call), 'Once Per Bar' (first call within the bar), and 'Once Per Bar Close' (final script execution of the real-time bar). Default is 'Once per Bar'.
Show Alert Time by Time Zone : Configures the time zone for alert messages. Default is 'UTC'.
🔵 Conclusion
The Swing Failure Pattern (SFP), or False Breakout, is an essential analytical tool that assists traders in identifying key market reversal points for successful trading.
By understanding the nuances between Real SFP and Considerable SFP, and integrating this pattern with other technical analysis tools, traders can make more informed decisions and better manage their trading risks.

Williams Volatility Channel (Full Range Breakout)Overview
This indicator implements a volatility breakout system inspired by legendary trader Larry Williams. It plots daily breakout levels calculated as the previous day’s close ± the full previous day’s range (high – low). These levels act as extreme volatility expansion thresholds:
- Upper Level: Previous close + previous day’s range
- Lower Level: Previous close – previous day’s range
A price move beyond these levels signals a strong directional breakout driven by expanded volatility — a classic Larry Williams concept for identifying potential trend continuation or acceleration days.
This version uses the full prior range (multiplier = 1.0), making it more aggressive than Williams’ original examples (which often used smaller fractions like 0.25–0.5 × range). It is particularly useful on instruments with clear daily sessions and visible overnight gaps or volatility spikes.
Key Features
Daily breakout levels plotted as horizontal lines that update at the start of each new trading day.
Optional semi-transparent fill between upper and lower levels for better visual channel perception.
Subtle background shading on the first bar of each new day and new week for easier time orientation.
Configurable colors and visibility toggles.
Generic session duration input (informational only) to help estimate candles per day on non-standard markets (e.g., European indices ≈ 8.5h, US stocks ≈ 6.5h, crypto ≈ 24h).
How to Use the Indicator
Breakout Signals
Bullish Breakout: Price closes or sustains above the Upper Level → potential strong upward momentum. Consider long entries or adding to existing longs.
Bearish Breakout: Price closes or sustains below the Lower Level → potential strong downward momentum. Consider short entries or adding to existing shorts.
These breakouts often occur on news events, earnings, or when the market “wakes up” after low-volatility periods.
Trend Confirmation
Use the direction of the breakout to confirm the prevailing trend: In an uptrend, focus primarily on upside breakouts.
In a downtrend, focus primarily on downside breakouts.
Breakouts against the trend can signal potential reversals (use with caution and additional confirmation).
Support & Resistance
Once price has broken a level, that level often flips role: A broken Upper Level can act as support on pullbacks.
A broken Lower Level can act as resistance on bounces.
Risk Management
Place stops beyond the opposite level or use ATR-based stops.
Consider partial profit-taking at 1× or 2× the prior day’s range from entry.
Best Markets & Timeframes
Works well on: Stock indices (DAX, FTSE MIB, CAC, S&P 500 futures, etc.)
Individual stocks
Commodities and futures with defined daily sessions
Cryptocurrencies (adjust session hours to 24 for continuous markets)
Recommended intraday timeframes: 5–60 minutes. On higher timeframes (4H, daily), the levels still appear but are less frequently tested intraday.
Important Notes
This is a trend-following / momentum tool, not a mean-reversion or gap-fading strategy (unlike Larry Williams’ famous “OOPS” pattern).
False breakouts can occur in low-volatility or ranging markets — always use additional confluence (volume, trend filters, higher-timeframe context).
The session duration input is informational and allows definition of how many candles per day should be used in the calculation.
This indicator provides a clean, visually intuitive way to spot high-volatility breakout opportunities based on one of Larry Williams’ timeless volatility concepts. Add it to your charts and combine it with your existing trading system for enhanced entry timing on strong momentum days.

Sentinel 5 — OHL daybreak signals [KedArc Quant]Overview
Sentinel 5 plots the first-bar high/low of each trading session and gives clean, rules-based signals in two ways:
1) OHL Setups at the close of the first bar (Open equals/near High for potential short; Open equals/near Low for potential long).
2) Breakout Signals later in the session when price breaks the first-bar High/Low, with optional body/penetration filters.
Basic workflow
1. Wait for the first session bar to finish.
*If O≈H (optionally by proximity) → short setup. •
*If O≈L → long setup. • If neither happens, optionally allow later breakouts.
2. Optional: Act only on breakouts that penetrate a minimum % of that bar’s range/body.
3. Skip the day automatically if the first bar is abnormally large (marubozu-like / extreme ATR / outsized vs yesterday).
Signals & Markers
Markers on the chart:
▲ O=L (exact) / O near L (proximity) – long setup at first-bar close.
▼ O=H (exact) / O near H (proximity) – short setup at first-bar close.
▲ Breakout Long – later bar breaks above first-bar High meeting your penetration rule.
▼ Breakout Short – later bar breaks below first-bar Low meeting your penetration rule.

Pivot Breakouts with MA FilterPivot Breakouts with MA Filter
This script identifies pivot breakouts (both bullish and bearish) using support and resistance levels and overlays breakout labels, arrows, and customizable Moving Averages. It allows traders to fine-tune their analysis with multiple options to customize the display and behavior of the breakout signals.
Key Features:
Pivot Support and Resistance:
Support is defined by the lowest low in a given range (using the lookback period).
Resistance is defined by the highest high in a given range (using the lookback period).
The script draws support and resistance boxes on the chart when these levels change, providing clear visual markers for potential breakout areas.
Breakout Detection:
Bullish Breakout: A breakout above resistance and the price is above the selected moving average (MA).
Bearish Breakout: A breakdown below support and the price is below the selected MA.
Breakout events trigger labels indicating "Resistance Breakout" (for bullish) and "Support Breakout" (for bearish).
The option to show Breakout Labels (with customizable colors) is available in the settings.
Moving Average Filter:
You can select the type of moving average (SMA or EMA) to use for filtering breakout signals.
MA Filter Length: This input allows you to set the period of the moving average to act as a filter for breakout conditions. This helps ensure the breakout aligns with the broader trend.
Multiple Moving Averages (Optional):
You can add up to four different moving averages (SMA or EMA), each with its own length and color.
You have the option to toggle each moving average on or off and adjust their appearance settings (color and length).
The script supports dynamic plots for each moving average, helping to visualize multiple trends at once.
Breakout Arrows:
The script can display arrows (or other shapes) below the bar for bullish breakouts and above the bar for bearish breakouts.
Arrows are optional and can be turned on/off in the settings.
You can customize the shape of the arrows (e.g., arrow, circle, square, or even a large or small triangle).
Customizable Colors and Labels:
The color of the breakout labels and arrows can be customized in the settings to make them fit your chart's style and personal preferences.
Alerts:
Alerts can be set for new support and resistance levels, as well as when breakouts occur (either bullish or bearish).
The alert system helps to notify traders when significant price action takes place without needing to constantly monitor the chart.
Settings:
Select Moving Average Type (SMA or EMA)
MA Filter Length: Length of the moving average used for filtering breakout conditions.
Lookback Range: Determines the range over which the pivot points (support and resistance) are calculated.
Breakout Labels: Option to turn on/off breakout labels, and customize label colors.
Show Breakout Arrows: Enable or disable breakout arrows with shape options (arrow, circle, square, large triangle, small triangle).
Multiple Moving Averages: Option to show up to 4 MAs with customizable colors and lengths.
