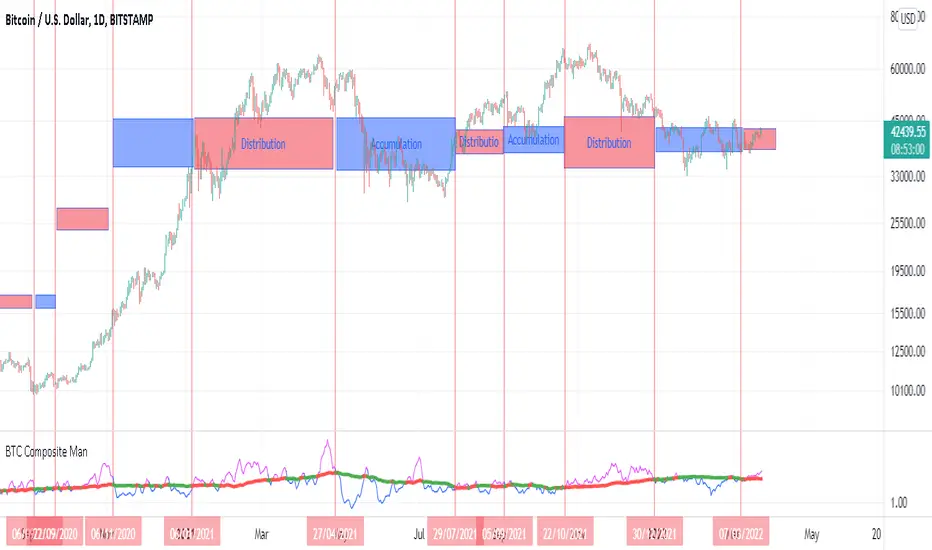
BTC Composite Man V.1Wyckoff's theory t is one of the most influential theories of market expression, and the most important components of which are lateral movement areas and trends. This theory turns the graph into something like Dots and lines (stations and paths).
After getting acquainted with Wyckoff's theory, I read several books on the subject, hoping that they could help me identify this area of lateral movement, the area of accumulation, or distribution. But there was a fundamental drawback. It is challenging to diagnose this issue. The rules discussed in these books are highly interpretive and subjective, and two different individual traders may come to exactly opposite conclusions based on their interpretation.
But as I became more familiar with the onchain analysis, an idea came to my mind that might be useful for more objectively recognizing charts based on Wyckoff's theory.
Composite Man: Wyckoff proposed a theory to help understand stock price movements. this is the “Composite Man” theory. (The same concept of whales or strong hands.)
he said: “…all the fluctuations in the market and all the various stocks should be studied as if they were the result of one man’s operations. Let us call him the Composite Man, who, in theory, sits behind the scenes and manipulates the stocks to your disadvantage if you do not understand the game as he plays it; and to your great profit if you do understand it.” (The Richard D. Wyckoff Course in Stock Market Science and Technique, section 9, p. 1-2)
Composite Man is a hypothetical man who has so much money and stocks that when he wants he can gradually increase the price by buying stocks and creating demand, and when the price goes high enough he sells his stock and lower the price. The composite man is the main player in the market. Wyckoff says that if you want to make a good profit from the market, figure out what a composite man game is.
Having a way of showing us where the Composite Man is in the market, can help us understand future trends
Who are the strong hands in the cryptocurrency market? (I use the strong hand word here instead of the composite man)
Some buy or sell more per capita than other market participants (retailers).
To understand this in the bitcoin market, I have used 3 charts and concepts:
1- Sending Addresses: The number of coins addresses making inflow transactions to the exchange.
Indicates the number of sellers' wallets (number of sellers)
2- buyers Addresses: The number of coins addresses making outflow transactions from the exchange.
Indicates the number of buyers' wallets (number of buyers)
3- Pay attention to this issue: the volume of transactions shows both the volume of sales and the buy ( Volume of buy and sale is equal in the market)
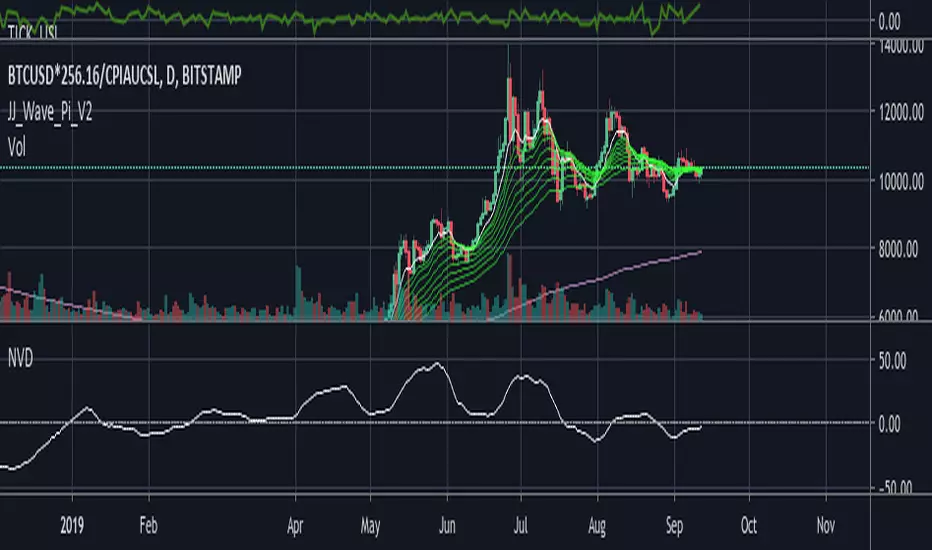
The Composite Man indicator is created by dividing the Receiving Addresses of bitcoin by the Sending Addresses. After dividing these addresses, the moving average of Alma was calculated for them and compared with the moving average of 100 days.
Considering the above 3 issues, it can be concluded:
- If the number of Receiving Addresses is higher than the Sending Addresses (the number of people who bought compared to the number of those who sold), it indicates that more people bought and fewer people sold (given that the volume of sales and buys are the same) So the sellers were stronger hands. In such a situation, the composite man is on the sales side.
- If the number of Sending Addresses is higher than the Receiving Addresses (number of people who have sold more than the number of people who have bought), it indicates that more people have been sellers and fewer people have been buyers (given that the volume of sales and buys are the same) so the buyers were stronger hands. In such a situation, the Composite man is on the buying side.
Accordingly, if the swing line is above the 100-day moving average line, it indicates that stronger addresses are being sold and retailers are buying, and vice versa.
在脚本中搜索"btc期权交割时间"
BTC buy/sell effectivenessDescribing how much bitcoin price moves due to active buy/sell orders, using price data from BINANCE:BTCUSDT but summing up the volume data from BINANCE:BTCUSDT, COINBASE:BTCUSD, BITHUMB:BTCKRW, BITFLYER:BTCJPY, KRAKEN:BTCEUR, FTX:BTCUSD, BITSTAMP:BTCUSD, BITFINEX:BTCUSD. The script is based on another script in the following
The recommended setting is 1m resolution with 1H time frame, EMA lengths 12 and 18. The upper and lower dashed lines show regions of high and low volatility of price.

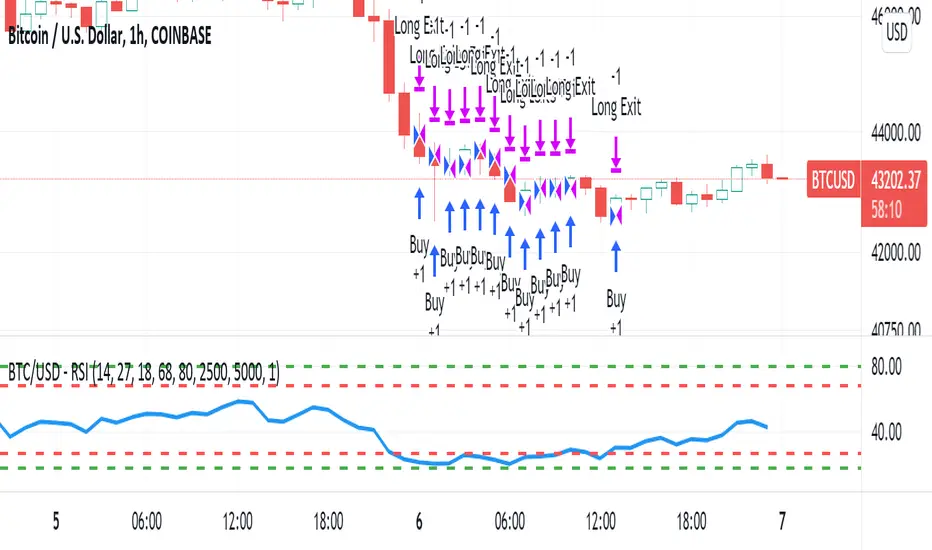
BTC/USD - RSIIF RSI (14) reaches 68 ... sell 1 lot size ( with TP 250 points and SL 500 points)
IF RSI (14) reaches 27 ... buy 1 lot size ( with TP 250points and SL 500 points)
IF RSI (14) reaches 80 ... sell 1 lot size ( with TP 250 points and SL 500 points)
IF RSI (14) reaches 18 ... buy 1 lot size ( with TP 250points and SL 500 points)
BTC Golden Bottom with Adaptive Moving AverageIntroduction:
This study uses Adaptive Moving Average with 1 year of length to plot on all time history Index Calculated by Tradingview . All previous $BTC bear runs bottomed on this curve which makes it important enough. Use this only on " "
Default Values:
AMA length is 1 year
Minor length is 50
Major length is 100

BTC Risk MetricThis script provides a general risk level for buying Bitcoin that historically ranges from 0-1.

BTC onchain Wallet Number of Transaction Per DayOnchain data showing the number of transactions made by per wallet users per day for Bitcoin

BTC > bull market supportPlots the natural log of the price divided by the 20w SMA and 21w EMA, color coded by the Bitcoin price (green if above, red if below). Use this when comparing Altcoins to Bitcoin's performance. Works in daily & weekly timeframes only!

BTC Power-law CorridorInspired by @hcburger1 Bitcoin’s natural long-term power-law corridor of growth.

Binance Z VolumeBTC perpetual volume on Binance is about 4x spot volume.
Comparing spot and perpetual volumes could provide useful insights into market sentiment.
Abnormal increases in the spot market could be associated with accumulation. Abnormal increases in the perpetual market, on the other hand, could predict volatility as well lows and highs.
This script represents a Z-score of the volume of perpetual and 4xspot on Binance.
High values above 0 mean that the volume is skewed towards perpetual contracts. Values below 0 mean that the volume is skewed towards spot contracts.
Feel free to suggest changes and improvements of this script.
Translated with www.DeepL.com (free version)
BIO

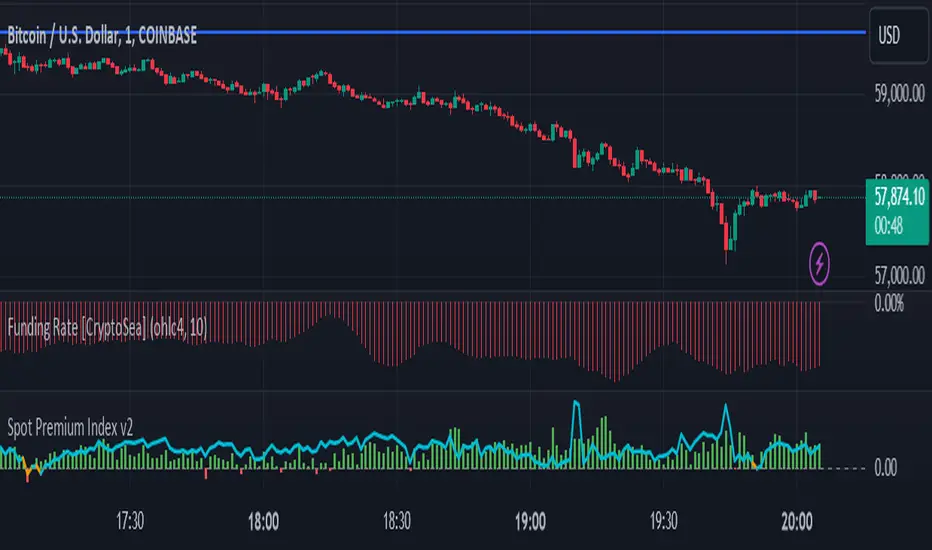
BTC Coinbase PremiumThis script is base on another script by oh 92.
It basically shows you where the price of Bitcoin (in USD) on Coinbase trades at a premium against an average of several futures exchanges.
Coinbase premium shows spot interest on bitcoin which happens either when futures are shorting heavily but spot holds the price up (often bullish especially when price is at a support level).
Negative premium shows that futures are leading price during an uptrend or spot is leading price during a downtrend.
Strong positive premium is often considered bullish.
Strong negative premium is often considered bearish even if price goes up.
The histogramm coinbase premium vs an average of several futures exchanges (Bitmex, Bitfinex, Binance, FTX, Phemex and Bitstamp).
The line diagramm shows coinbase premium vs Bybit.
In contrast to the script by oh92 this script uses different exchages (especially Bybit as a lot of former Bitmex traders changed to Bybit during september and october 2020).
All values are in percent because differences in USD only are not suitable for historic prices. This means if CB-premium is -0.1 then futures trade 0.1% lower than coinbase.
BTC VIP EMA CROSS Buy/Sell (GC & DC)EMA cross 5&10 standard-setting with add on of BUY/SELL signal ( GC & DC) which will make the traders have an indication of buy and sell easily and clearly.
An exponential moving average strategy, or EMA strategy, is used to identify the predominant trend in the market. It can also provide the support and resistance level to execute your trade. Indicators: v4 (default setting), EMA 5 10 Crossover (default setting)
Preferred Time Frame(s):15-Minute, 30-Minute, 1-Hour, 4-Hour, 1-Day
Strategy
Long Entry Rules
Enter a buy in the market if the following indicator or chart pattern takes center stage:
If the blue upward pointing arrow of the EMA 5 10 Crossover custom indicator gets aligned just somewhat below the candlesticks as seen in Fig. 1.0, the market sentiment is said to be bullish, hence a trigger to go long on the pair of interest.
If the light blue line of the custom indicator gets outlined just below price bars as illustrated in Fig. 1.0, price is said to be pushed somewhat higher i.e. a trigger to buy the asset of focus.
Exit Strategy/Take Profit for Buy Entry
Exit or take profit if the following rules or conditions takes precedence:
If the red downward pointing arrow of the EMA 5 10 Crossover custom indicator forms above price bars as depicted in Fig. 1.0 while a buy signal is ongoing in the market, a possible price dip is said to be looming, as such an exit or take profit is advised.
If the red line of the custom indicator forms above the candlestick during a bullish trend, it is a pointer to a possible price dip, hence an exit or take profit is advised.

BTC Contango IndexInspired by a Twitter post by Byzantine General:
This is a script that shows the contango between spot and futures prices of Bitcoin to identify overbought and oversold conditions. Contango and backwardation are terms used to define the structure of the forward curve. When a market is in contango, the forward price of a futures contract is higher than the spot price. Conversely, when a market is in backwardation, the forward price of the futures contract is lower than the spot price.
The aggregate prices on top exchanges are taken and then averaged to obtain a Spot Average and a Futures Average. The script then plots (Futures Average/Spot Average) - 1 to illustrate the percent difference (contango) between spot and futures prices of Bitcoin.
When in contango, Bitcoin may be overbought.
When in backwardation, Bitcoin may be oversold.

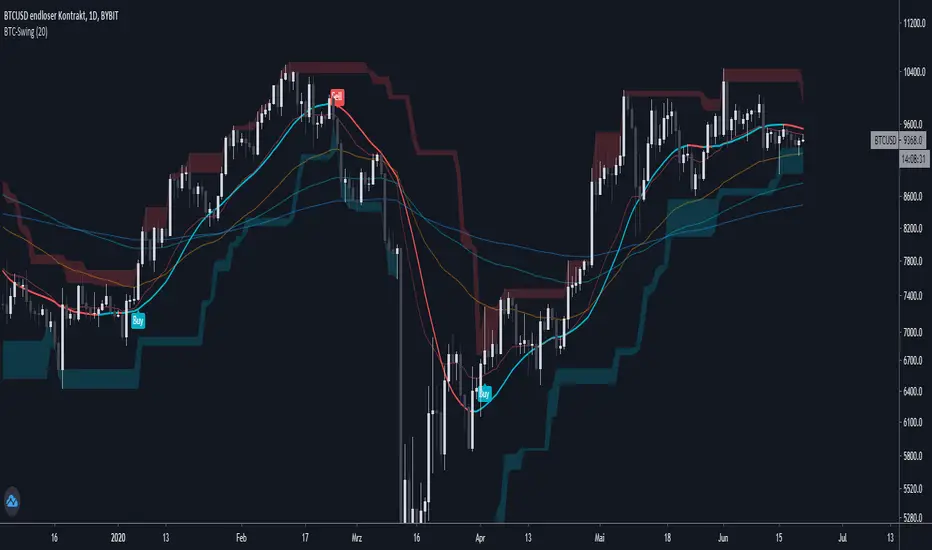
BTC-SwingScript is based on SuperRange - evo @EvoCrypto
It's based on highest and lowest candle close from a few bars back.
Removed + added some minor stuff, added alerts and signals
dded a signal line (ALMA)
added options to display EMA 20/50/100/200
use higher timeframe (1D)
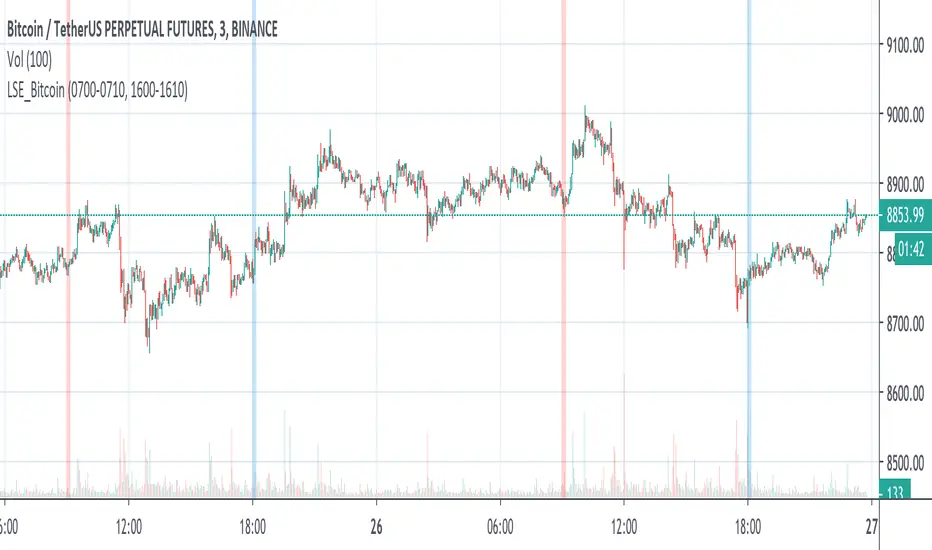
LSE_Bitcoin pump and flush at the London SE opening and closingBTC recently decoupled from SPX but now it is using London Exchange opening and closing hour to pump and flush.
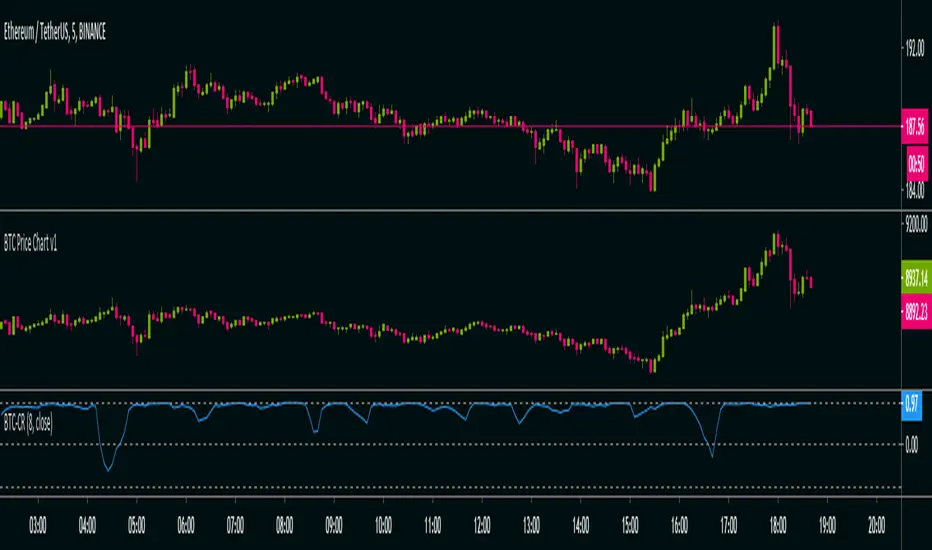
BTC Co-Relation v1Calculate Pearson-correlation-coefficient of selected cryptocurrency with Bitcoin average price of 10 different exchanges.
This is helpful in scalping(at least for me), by using this we can find co-relation between a cryptocurrency and Bitcoin .
Here we are using Bitcoin average price of 10 different exchanges.
It is an oscillator with minimum value -1 and maximum value +1.
👉-1 means current selected cryptocurrency price is completely out of relation with Bitcoin price, means Bitcoin price increasing and it's price decreasing or Bitcoin price decreasing and it's price increasing in selected time-frame.
👉+1 means current selected cryptocurrency price is completely in co-relation with Bitcoin price, means Bitcoin price increasing and it's price also increasing or Bitcoin price decreasing and it's price also decreasing in selected time-frame.
Happy trading 👍.
BTC Correlation CoefficientAn indicator that only calculates and displays the correlation coefficient with bitfinex:BTCUSD close.
By changing the settings, you can calculate any chart and correlation coefficient
0.7 to 1.0 There is a fairly strong positive correlation
0.4 to 0.7 Positive correlation
0.2 to 0.4 with a weak positive correlation
-0.2 ~ 0 ~ 0.2 Little correlation
-0.4 to -0.2 Weak negative correlation
-0.7 to -0.4 Negative correlation
-1 to -0.7 Significantly negative correlation
bitfinex:BTCUSDのcloseとの相関係数を計算して表示するだけのインジケーターです。
設定を変更すれば任意のチャートと相関係数の計算ができます
0.7 ~ 1.0 かなり強い正の相関がある
0.4 ~ 0.7 正の相関がある
0.2 ~ 0.4 弱い正の相関がある
-0.2 ~ 0 ~ 0.2 ほとんど相関がない
-0.4 ~ -0.2 弱い負の相関がある
-0.7 ~ -0.4 負の相関がある
-1 ~ -0.7 かなり強い負の相関がある

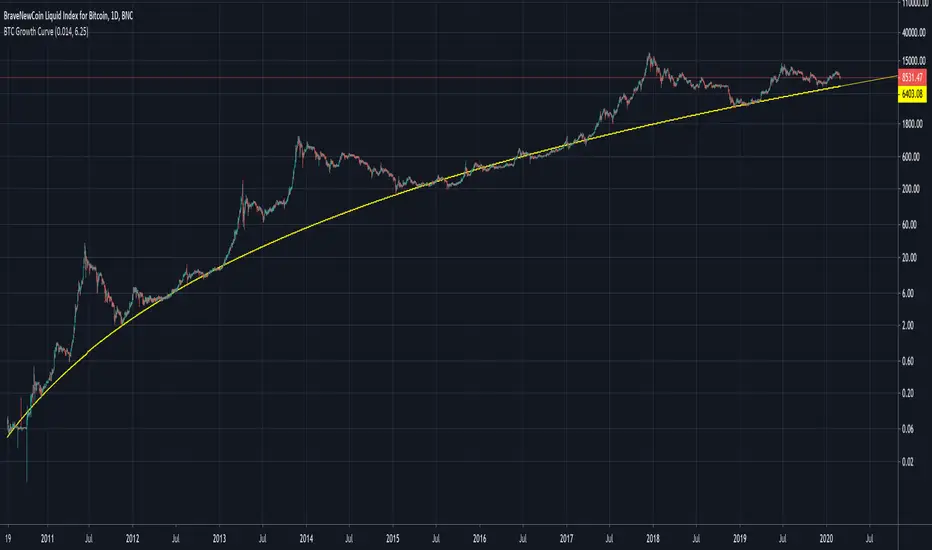
BTC Growth CurveA function which maps Bitcoin supply fundamentals to an estimated demand growth model via price.
BTC Power Law HistogramBased on "Bitcoin’s natural long-term power-law corridor of growth" by Harold Christopher Burger

BTC Bear Market Identifier [ChuckBanger]I have never find a use case for Line Break chart before. But I stumbled on the fact that if bitcoin dumps below the low of a big down move. It is very likely Bitcoin is heading for a new bear market. So this script is based on that idea and developed to this. It is intended to be used as a bear market identifier only with Line Break daily or higher time frame chart. If someone find a different use case for this script let me know
2014:
2018:

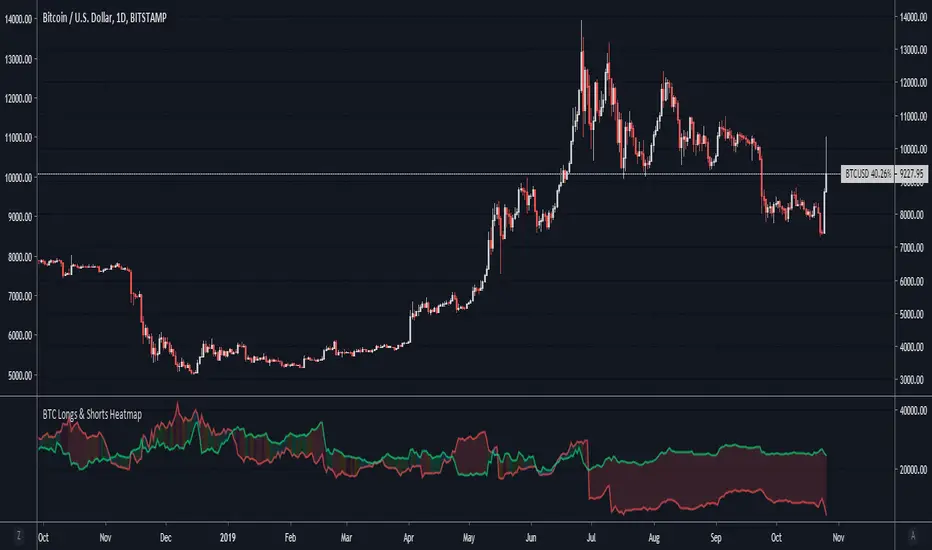
BTC Longs & Shorts HeatmapBitfinex Bitcoin Long and Short positions visualization with colored background.
Original author: @autemox
BTC Daily Strategy BFStrategy based on code by @CredibleHulk so thanks for that.
This is a strategy for the Daily Bitcoin chart which uses the MACD, RSI, Stochastic RSI and a moving average.
The conditions for long or short signals depend on the indicators above crossing user-defined thresholds.
Long signal = (Stochastic RSI k value is below Stochastic Sell Threshold) AND EITHER (MACD delta crosses above MACD Threshold OR RSI crosses above RSI Threshold)
Short signal = (MACD delta crosses below 0) AND EITHER (Close Price - an SMA of the ohlc4 values crosses below the DMA threshold OR Stochastic RSI k value is above Stochastic Sell Threshold)
INSTRUCTIONS
Green background = go long
Red background = go short
You can adjust stop loss values for long or short signals in settings as well as all parameters for the indicators.

BTC Halvening 3 Bull Peak CrossThe 350dma x2 and 111dma Cross Predicting Bitcoin Halvening #3 Bull market end.
Don't change any settings Except the colors. Bitcoin Halvening #4 will require a slight adjustment as noted in the script notes.
This has been brought to you by the time traveller.
