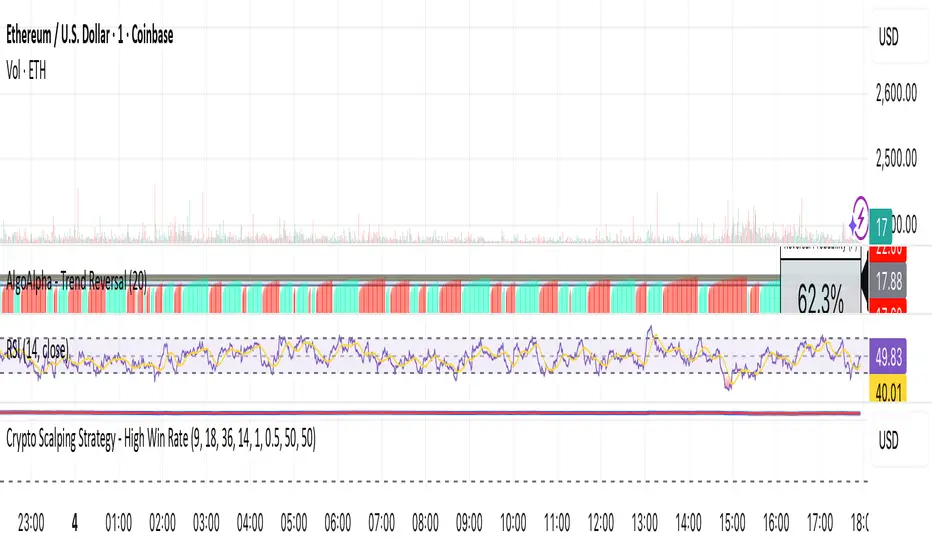
Crypto Scalping Strategy - High Win Rategrok first try. I used grok to create a scalping strategy that is automated for crypto scalp trading on 5-15 min intervals
在脚本中搜索"crypto"
Crypto Early Momentum — Screener v6 (robust)Screens Crypto Pairs for momentum and assigns a momentum score.

Crypto Market Dominance Stacked with LabelsA professional stacked area chart showing the dominance of major crypto market segments: BTC, ETH, Top 100 Altcoins, and #101+ Altcoins. Each layer is color-coded for clarity and includes dynamic labels with the current dominance percentage. Provides a clear visual representation of market share trends for traders, analysts, and crypto enthusiasts.
Features:
Stacked visualization of BTC, ETH, Top 100, and small-cap altcoins (#101+).
Color-coded areas for easy identification.
Dynamic labels showing each category’s current dominance percentage.
Horizontal reference lines for percentage levels.
Approximates top 100 and #101+ altcoins using TOTAL2 and TOTAL3 market cap tickers.
Use Case:
Track how market share shifts between BTC, ETH, large altcoins, and smaller altcoins over time. Ideal for analyzing trends, spotting dominance changes, and visualizing overall crypto market structure.

Crypto Breakout Buy/Sell Sequence
⚙️ Components & Sequence Multiple Timeframe (What It Does)
1. Bollinger Bands – Form the foundation by measuring volatility and creating the dynamic range where squeezes and breakouts occur.
2. Squeeze Dots – Show when price compresses inside the bands, signaling reduced volatility before expansion.
3. Breakout Event (Brk Dot) – Fires when price expands beyond the squeeze zone, confirming volatility expansion. (This paints Intra, before candle close)
4. Buy Signal – Confirms entry after a breakout is validated. (This paints at candle close)
5. Pump Signal – Flags sudden surges that extend sharply from the bands, often linked to strong inflows.
6. Momentum Stream – Tracks the strength of movement following the breakout, from continuation (🟢) to slowing (🟡) to exhaustion (🔴). (Resets at Pump Signal)
7. Overbought Indicator – Confirms when momentum has reached overheated conditions, often aligning with band extremes.
8. Sell Signal – Prints when exhaustion/reversal conditions are met, closing the trade cycle.
The Crypto Breakout Buy/Sell Sequence is a no-repaint event indicator that maps a full trade cycle using Bollinger-band-based volatility states: Bollinger Bands → Squeeze → Breakout → Buy → Pump → Momentum → Top Test → Overbought → Sell. Each stage is rule-based and designed to be read on standard candlesticks.
How It Works (System Logic)
Volatility framework: Bollinger Bands define dynamic range and compression/expansion.
Initiation: Squeeze → Breakout confirms expansion; Buy validates participation after expansion begins.
Management: Pump highlights unusual acceleration; Momentum stream tracks continuation → slowing → exhaustion.
Exhaustion/Exit: Top Testing + Overbought build the exhaustion case; Sell marks the sequence end.
How To Use (Quick Guide)
Wait for Squeeze → Breakout → Buy to establish a structured start.
Manage with Momentum:
🟢 continuation, 🟡 slowing, 🔴 exhaustion pressure.
Monitor extremes: Top Testing and/or Overbought = tighten risk.
Exit on Sell or on your risk rules when exhaustion builds.
Limitations & Good Practice
Signals reflect price/volatility behavior, not certainty.
Strong trends can remain extended; Overbought/Top Test ≠ instant reversal.
Always confirm with your own risk rules, position sizing, and market context.
Initial public release: integrated Squeeze/Breakout/Buy → Momentum → Exhaustion → Sell cycle; improved label clarity; cleaned defaults.
Disclaimer
For educational purposes only. Not financial advice. Past performance does not guarantee future results. Test before live use.
Thank You

Crypto Position Size CalculatorPosition Size Calculator for Crypto.
This indicator uses the current price and a selected stop loss to calculate your position size without having to work it out elsewhere!
Simply set your account size, desired risk percentage and stop loss level and it will work out how many lots and the dollar value of your desired position.
Hope you enjoy!

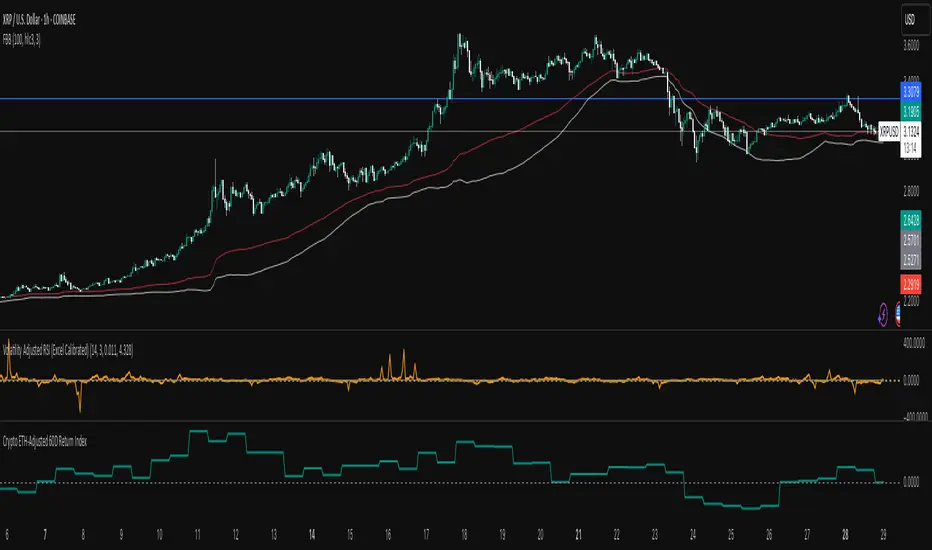
Crypto Weighted 60 Day Return Index60 Day Return of Crypto Index (Volatility Adjusted) weightings based on Holdings
BTC
ETH
SOL
AAVE
XRP
Crypto Narratives: Relative Strength V2Simple Indicator that displays the relative strength of 8 Key narratives against BTC as "Spaghetti" chart. The chart plots an aggregated RSI value for the 5 highest Market Cap cryopto's within each relevant narrative. The chart plots a 14 period SMA RSI for each narrative.
Functionality:
The indicator calculates the average RSI values for the current leading tokens associated with ten different crypto narratives:
- AI (Artificial Intelligence)
- DeFi (Decentralized Finance)
- Memes
- Gaming
- Level 1 (Layer 1 Protocols)
- AI Agents
- Storage/DePin
- RWA (Real-World Assets)
- BTC
Usage Notes:
The 5 crypto coins should be regularly checked and updated (in the script) by overtyping the current values from Rows 24 - 92 to ensure that you are using the up to date list of highest marketcap coins (or coins of your choosing).
The 14 period SMA can be changed in the indicator settings.
The indicator resets every 24 hours and is set to UTC+10. This can be changed by editing the script line 19 and changing the value of "resetHour = 1" to whatever value works for your timezone.
There is also a Rate of Change table that details the % rate of change of each narrative against BTC
Horizontal lines have been included to provide an indication of overbought and oversold levels.
The upper and lower horizontal line (overbought and oversold) can be adjusted through the settings.
The line width, and label offset can be customised through the input options.
Alerts can be set to triggered when a narrative's RSI crosses above the overbought level or below the oversold level. The alerts include the narrative name, RSI value, and the RSI level.

Crypto Cycle Projection📈 Crypto Cycle Projection – Indicator Description
This indicator is designed to visually track and forecast repeating price cycles in the crypto market. It highlights a defined time-based cycle starting from a chosen date or the latest bar on the chart. By identifying cycle Start, Midpoint, and End zones, traders can gain insights into timing-based market structure and possible pivot periods.
⚙️ User Settings Explained
Start Point
Start from Last Candle (useLastCandle) – When enabled, the cycle begins from the most recent candle on the chart.
Manual Date (Year / Month / Day) – If Start from Last Candle is disabled, you can manually set a specific start date for the cycle.
Display Options
- Show Projection (showZone) – Toggles the display of the main cycle projection.
- Show Outer Bars (showOuter) – Adds faded edge bars around the key cycle zones for better visual emphasis.
- Show Previous Cycle (showPreviousCycle) – Adds the prior cycle to the chart, going one full cycle period back from the main start point.
Show Next Cycle (showNextCycle) – Projects one additional cycle forward beyond the current.
Cycle Parameters
Cycle Period (cyclePeriod) – Defines the number of bars in a full cycle (e.g., 60 = 60 bars). This sets the spacing between Start → Midpoint → End.
Each cycle section is color-coded:
Start = White
Midpoint = Yellow
End = Green
These reference lines and zones help you align trades with cycle timing for potential reversals, continuations, or volatility expansions.
Co-author Credit:
Matthew Hyland @ParabolicMatt

Crypto Strategy SUSDT 10 minThis strategy is designed to trade the **SUSDT** pair on a **10-minute time frame**, using a combination of an Exponential Moving Average (EMA) and percentage-based Stop Loss (SL) and Take Profit (TP) levels.
### How the strategy works:
1. **EMA Calculation**:
- The strategy calculates a 24-period Exponential Moving Average (EMA) based on the closing price.
- This EMA serves as the primary trend indicator.
2. **Entry Conditions**:
- **Long Position**: A long position is entered when the closing price is above the EMA and the opening price is below the EMA. This indicates a potential upward trend.
- **Short Position**: A short position is entered when the closing price is below the EMA and the opening price is above the EMA. This indicates a potential downward trend.
3. **Stop Loss and Take Profit**:
- Both Stop Loss (SL) and Take Profit (TP) are calculated based on the entry price of the position.
- **For Long Positions**:
- Stop Loss is set as a percentage below the entry price.
- Take Profit is set as a percentage above the entry price.
- **For Short Positions**:
- Stop Loss is set as a percentage above the entry price.
- Take Profit is set as a percentage below the entry price.
- The percentage values for SL and TP can be adjusted in the strategy's settings (default: SL = 2%, TP = 4%).
4. **Exit Conditions**:
- The position is closed automatically when either the Stop Loss or Take Profit level is reached.
5. **Visualization**:
- The 24-period EMA is plotted on the chart as a blue line, helping visualize the trend direction.
### Key Features:
- **Pair and Time Frame**: The strategy is optimized for the SUSDT pair on a 10-minute time frame.
- **Customizable Parameters**: Users can adjust the Stop Loss and Take Profit percentages to suit their risk tolerance and trading style.
- **Trend-Following Approach**: The strategy uses the EMA to identify and follow the current market trend.
This strategy is simple yet effective for capturing trends while managing risk through predefined Stop Loss and Take Profit levels.

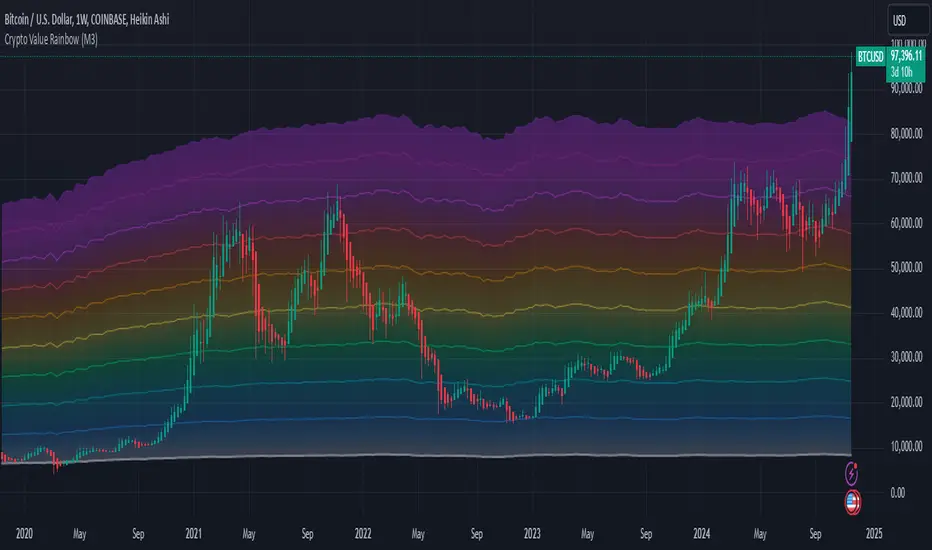
Crypto Value RainbowThe best way to value Crypto value is comparing Crypto price against the available money supply circulating in the economy. There are 3 different 4 different type of money supply M0/M1/M2/M3 which denotes the level of money printed by central government to the final credit lend out to the economy via fractional banking system. This rainbow valuation measures the relative Crypto price against the M0/M1/M2/M3 from most popular currency that account for more than 75% of money supply in the world.
CV = US MS + EU MS + CN MS + JP MS + UK MS
CV = Crypto Value
MS = Money Supply
This can only be applied to a few crypto currency:
- BTCUSD Bitcoin
- ETHUSD Ehereum
- BNBUSD BNB
- SOLUSD Solana
- XRPUSD XRP
- TONUSD Toncoin
- DOGEUSD Dogecoin
- TRXUSD Tron
- ADAUSD Cardano
- AVAXUSD Avalanche
The rainbow color is the multiplier for the total Crypto Value by 1x,2x,3x,...,10x
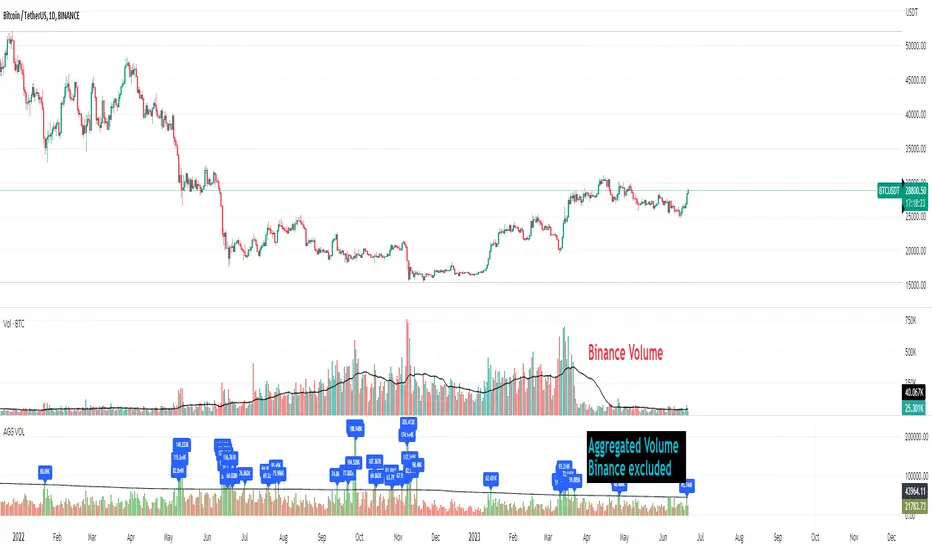
Crypto Aggregated Volume «NoaTrader»If you use volume in your crypto analysis, you may have encountered the situation which an exchange's policy change can affect your judgement falsely. For example, you can see the huge difference of volume on the given chart since binance transferred its fee discount from USDT to TUSD pair.
This script sums up volume of all major centralized exchanges ( according to coinmarketcap ) on the symbol you are visiting and has an option to exclude Binance's volume which can give you a more stable understanding for judgement when needed (and you can see the difference on the chart).
The colors also give a good vision about the relative volume in the area which can show the interest of market in trading.
The script only aggregates the same symbol on different exchanges and does not get the volume from other pairs.
Included CEXs are:
binance
bitstamp
coinbase
huobi
kraken
bitfinex
bybit
okx
kucoin
bithumb
Crypto Index Percentage GainThis script calculates the percentage gain from the left-most visible candle for multiple cryptocurrency symbols and plots all of them on the chart.
Description:
The "Crypto Index Percentage Gain" indicator calculates the percentage gain from the left-most visible candle for a selection of cryptocurrency symbols. It utilizes the PineCoders VisibleChart library to access the high, low, close, and open prices of the visible chart range.
The user can customize the symbols to include in the calculation by enabling or disabling the corresponding input options. `_open` represents the open price, `_close` represents the close price, and `_gain` represents the calculated percentage gain. The formula used is (close - open) / open * 100 to calculate the percentage change between the open and close prices.
The calculated percentage gains for each symbol are plotted on the chart using different colors and line widths, providing an overview of the relative performance of the symbols.
Usage:
Add the "Crypto Index Percentage Gain" indicator to your trading view chart by searching it in indicator search bar or star it , it will show on your favourite indicators .
Configure the symbols and visibility options using the input parameters.
The indicator will calculate and display the percentage gain for each selected symbol based on the left-most visible candle on the chart.
Code Explanation:
The script imports the PineCoders VisibleChart library for accessing the visible chart range.
It defines a function `f_pcr()` to calculate the percentage gain for a given symbol.
Input options are provided to enable or disable symbols and set their visibility.
Symbols are defined using `input.symbol()` and the percentage gains are calculated using `request.security()`.
The calculated percentage gains for each symbol are plotted on the chart using different colors and line widths.
thanks to @PineCoders for VisibleChart library.

Crypto BTC Correlation Scalper Gaps StrategyThis strategy is based on the gaps theory.
In this case we have the BTC futures from CME, which acts in a way similar to stocks, and we can have gaps present between close/open session, and also sometimes between same candle due to huge movements intra candle.
At the same time I have combined this with a daily moving average, to help out a bit with the trend, since we are looking at small timeframe like 1-15/30min .
On top of that we have a reverse option, where long = short and viceversa, which can be used with against BTC pairs .
Rule are simple:
For long, we have a long gap and the close of the correlated candle is above daily sma
For short, we have a short gap and the close of the correlated candle is below daily sma
For exit:
For exit, we take the highest highest values for short entry TP, meaning we get the different from the HH and rest the current open candle distance, and use that distance as a TP.
At the same time for long entry, we take the lowest low value and rest current close of the candle to that value, and we get the TP.
Can also be applied this logic for SL aswell but from the test I have found out that exiting based on a reverse condition(when tp is not being hit), gives better results/dd overall.
If you have any questions, please let me know !

Crypto Force IndexIntroduction
The Crypto Force Index (CFI) indicator helps us understand the current strength and weakness of the price. It is very useful when used on high timeframes for investment purposes and not for short term trading.
To determine the strength and weakness of the price, a level grid based on the RSI indicator is used.
Based on the RSI value, red circles (oversold condition) and green circles (overbought condition) appear under the price candles. The more intense the color of the circles, the more that the current price is in an overbought or oversold condition.
The signal levels are all configurable to adapt the indicator across multiple instruments and markets.
The default configuration have been designed to obtain more accurate signals on Ethereum and Bitcoin, using the weekly timeframe.
Why Crypto Force Index?
The Crypto Force Index (CFI) is the consequence of my study of investments based on the accumulation plan. I wanted to demonstrate that I am improving the returns of the classic DCA ( dollar cost averaging ) and VA ( value averaging ).
After finding my own model of an accumulation plan, I decided to create the Crypto Force Index to help me visually enter the market.
The formulas of the indicator are very simple, but my studies confirm the power of this tool.
How are the signals to be interpreted?
The Crypto Force Index helps us to highlight the overbought and oversold areas, with the use of circles under the price of candles and with a thermometer inserted at the base of the graph, where all the phases of strength and weakness are highlighted.
As soon as the red circles start to appear on the chart, that may be a good time to enter LONG to the market and start accumulating. If the circles are green, we can consider decreasing the current exposure by selling part of your portfolio, or decide to stay flat.
I personally use these signals on the weekly timeframe, to decide to feed my accumulation plan at the beginning of each month.
I hope it can be of help to you! Please help me improve the Crypto Force Index! :)

Crypto addict 7 Accurate Buy & Sell indicators
The below indicators are recommended on the daily chart only.
Yellow Diamond - Possible bottom of the market. This diamond will only flash a few times in a cycle on the BTC chart. This is actually one the BEST buying signal
Green Buy – Buy
Red Sell - Sell / take profits
BIG red cross – Possible top and best signal to sell or take profits
BIG green cross – possible bottom and the best signal to buy
Silver Line – 111 MA
The modified 111 moving average is also a very good indicator. The market will test this support/resistance before the 200 moving average.
Purple line – 200 MA
The modified 200 moving average is a very good indicator. You will get a feel if the markets are in a up or down trend and identifying support and resistance areas. A daily candle close above the line is support and markets can move upwards. A daily close below indicate resistance and markets will move downwards
Red line – Confirmed bullish / bearish cycle!!
Green Line - This MA line indicate the bottom of the cycle - your absolute best entry point for the next cycle. This MA got a 10-year accurate record.
Remember that past history does not guarantee future results.

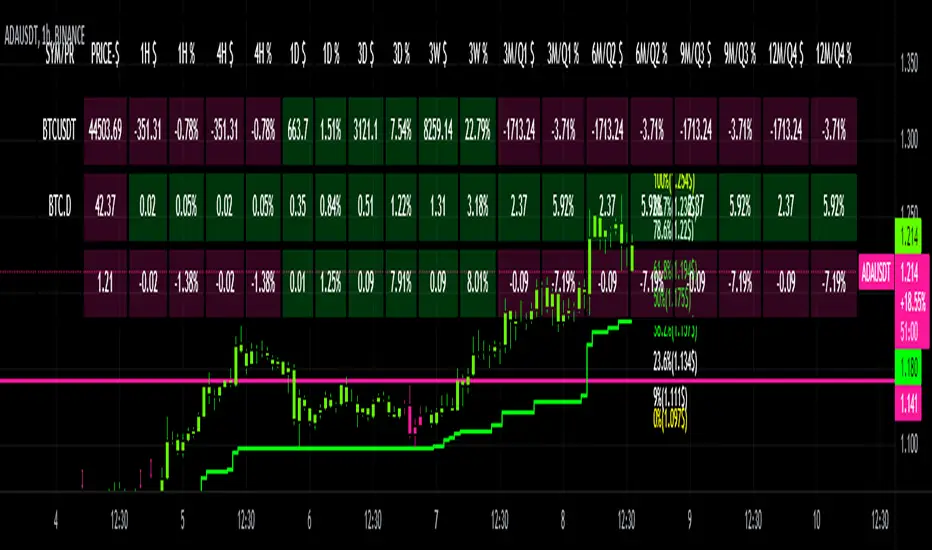
CRYPTO DASHBOARD Gs₿A Simple Crypto Dashboard/Screener which indicates the Price and percentage changes for the Given Period of time i.e for 1 Hr ,4 Hrs, 1 Day, 3 Days, 3 Weeks and 3 - 12 Months. By Default it displays #BTC and its Dominance and current trading pair Price and % changes.
Crypto Volume/Strength ComparatorHello Traders,
Here is an attempt to perform comparative analysis between top cryptos based on strength (oscillator) and volume. Methodology used here is similar to Magic Number formula described in the post : Enhanced Magic Formula for fundamental analysis . But, instead of using fundamentals, we are making use of few technicals to derive similar outcome. Usage of the available stats will not be same as Magic number since we are using technicals.
⬜ Process
▶ Get crypto exchange based on prefix of instrument being used.
▶ For the given exchange, get data for all the tickers available in input fields.
▶ Calculate Oscillator, Momentum based on price for each tickers.
▶ Calculate Oscillator, Momentum based on volume for each tickers.
▶ Calculate Volatility for each tickers.
▶ Rank Price-Oscillator, Price-Momentum, Volume-Oscillator, Volume-Momentum, Volatility for each tickers.
▶ Calculate combined rank by adding up individual ranks.
▶ Calculate movement of rankings from bar to bar
▶ Sort tickers based on rank and populate them on table. Display direction of rankings.
⬜ Components
Display components are as follows:
⬜ Settings
Settings are pretty simple and straightforward
⬜ Calculations
▶ Oscillators : High values of oscillators are considered as ideal as the process is intended towards finding trend.
▶ Momentum : Momentum is calculated on the basis of Squeeze Momentum Indicator by @LazyBear.
▶ Volatility : Volatility is calculated on the basis of Williams Vix Fix by @ChrisMoody. Here too since we are in trend following mode, lower vix fix is considered ideal.
⬜ Few Notes
Tickers will show data only if selected exchange has them. Some tickers are not available in all exchanges. In that case, it will show NAN. This is kind of unavoidable as we need to have fixed size arrays for any calculations.
Indicator works only on crypto tickers which has valid exchange.
Tickers move through the rankings in real time. Background of all stats are based on gradient from green to red.
Tickers on top may not always have better long opportunity or tickers at bottom may not always be optimal for shorting. We need to consider how long the instrument may stay in the position or how fast it is moving in opposite direction. Hence, directions of the ranking movement are also shown on the table.

Crypto Scannner for Traffic Lights StrategyI allways try to make trading easier. Developing Scripts for a quick backtest and improvement of a strategy, getting alerts for entry and exit a position. Loading data to a spreadsheet is also important and takes time.
In this case finding good parameters in different markets or assets to enter in a position, is a bit exhausting. It is something you have to do everyday, and sometimes in different moments of the day.
So I manage to develop a Screener, to take a quick look at specific hours, and tell if I have a buy or sell condition in an specific asset. Obviously this is not an alert to make a trade instantaneusly, but this help you filter a lot of information in matters of seconds. Then open those specific charts and make a better analisys.
A few weeks ago, I published a scrpipt called "Traffic Lights Strategy", that uses 4 emas to get a buy or a sell condition.
It is easy to understand and use, but if you don´t want to missed some opportunities, and don't want to be look at the screen in all the time looking for them, I have here a simple solution.
This script works plotting 2 labels. The first one plots all the assets in which the condition is true (fastema > medema > slowema > filterema or fastema < medema < slowema < filterema)
The second one plots the assets were the condition is true only if happened up to 5 candles back, so you can be in time to enter a trade.
You can take the script and customize it for a different strategy or assets. I coded like this because I backtested this strategy in this specific assets, and statistics suggest that it might be profitable.
I hope this works for you. In other time I'll try to code a script for the others strategies I published.

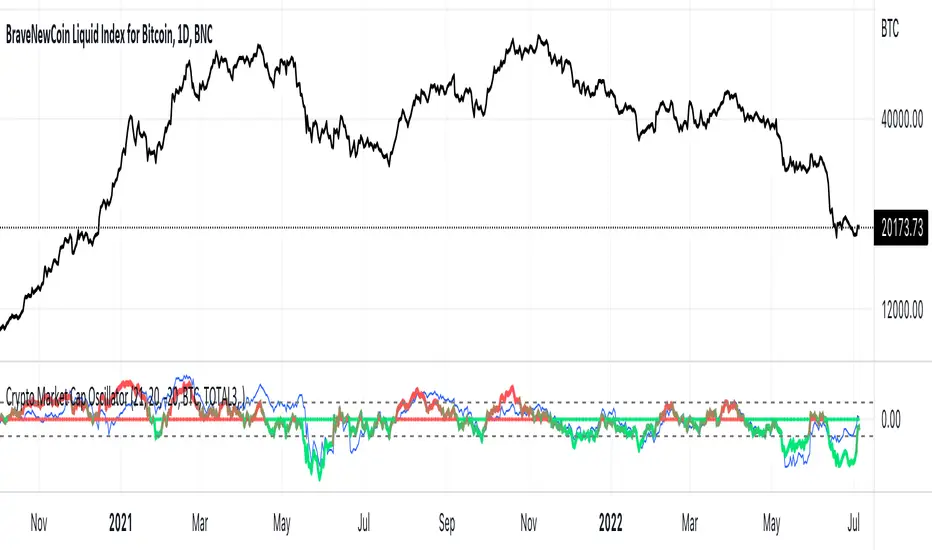
Crypto Market Cap Oscillatorthis oscillator gives helps you to select the right buy or sell moment based on the market cap of the token of your choice
It is based on a base 100 oscillator
Black plot is BTC marketcap
Gray plot is total ALT marketcap
Coloured is based on the coin of your choice
The greener the plot, the best buy opportunity
The more red the plot, the best sell opportunity
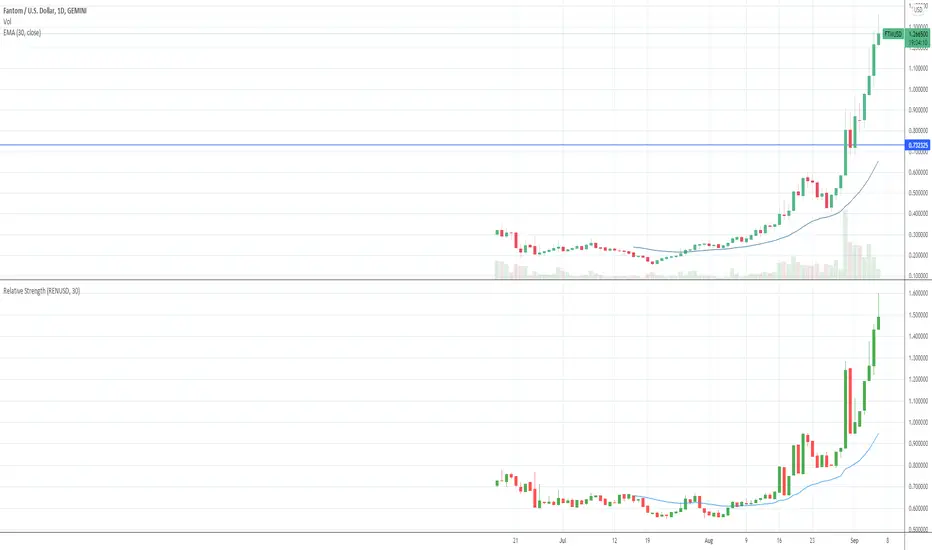
Crypto Relative StrengthIndicator meant for crypto markets. Computes the relative strength of the current ticker against a target ticker and plots a candlestick chart. Also, plots an exponential moving average of the relative strength.
Crypto Total Market Cap, Exclude Tether, (USD)Total cryptocurrency market capitalization without tether, with alerts for chosen value thresholds.
The rationale is that tether is a printed supply stable coin with a fixed value; there is no need to include its value in a combined market cap. It's debatable if that's true, but that doesn't explain what this indicator is.
The second part of this indicator is highlighted when the aforementioned adjusted market cap is above or below certain values. They are round numbers; a psychological factor. A psyop, if you will.
Options to configure are the lower and upper bound and colors. The alerts must be manually turned on, as usual.

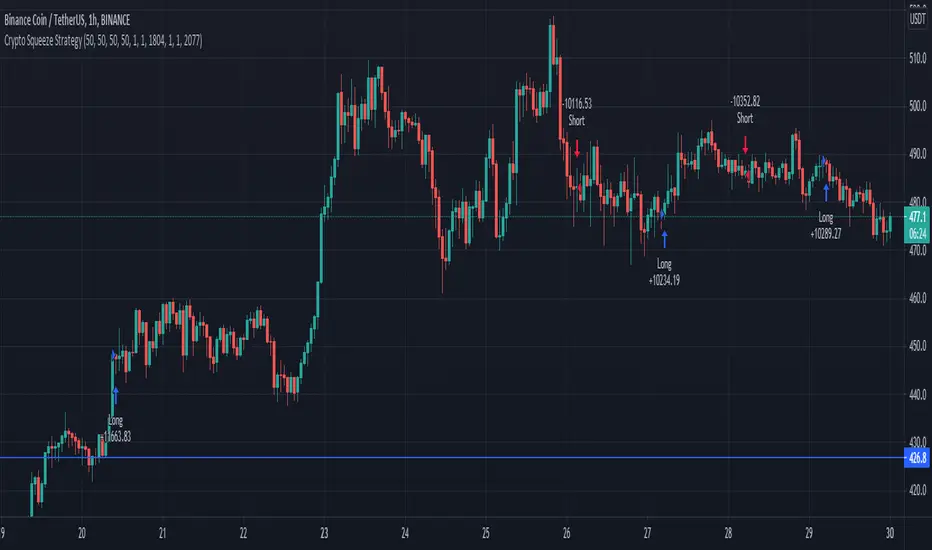
Crypto Squeeze StrategyThis strategy was inspired by two famous Trading View contributors. Shout out to Lazy Bear and Crypto Face!
The strategy includes a similar replication of the blue wave, and MFI indicator. The point of the strategy is to buy when the blue wave crosses up the zero value, and the MFI is greater than zero value. This indicates that there is strong bullish momentum and money flowing into the market.
Crypto EMA Trend Reversal StrategyThis is an EMA crossover strategy which involves 5 EMAs to trigger trades. The strategy has two take profit settings and uses a stop loss.
TP1 and SL are based on ATR and TP2 is an EMA crossover.
The strategy goes both long and short and the default settings work particularly well as a scalping strategy for ETHUSDT on the 5M time frame.
I have also created another version with tweaked settings for scalping LINKUSDT on the 5M with very similar results.
There is an option to add a volume condition parameter within the script on lines 26-28 which can be added to the end of lines 34-35 in the following format: and vol_cond
I personally don't currently use the volume condition parameter.
