QQQ Daily Expected Move • Manual VIXQQQ Daily Expected Move • Manual VIX — Description 📈⚡
This indicator calculates the daily expected move (EM) for QQQ using a manual VIX input, then draws the projected high and low boundaries for the session.
It automatically pulls the previous day’s closing price (or today’s open if selected) and applies a volatility-based formula to estimate the range QQQ is statistically likely to stay within. 📊
How the Expected Move Is Calculated 🧮
The formula uses a simplified volatility model:
\text{Expected % Move} = \frac{\text{VIX}}{\sqrt{252}}
This percentage is then applied to your selected baseline price:
📘 Previous Close (recommended — most accurate)
🌅 Today’s Open
✏️ Custom Price
The indicator automatically plots:
🔼 Expected High
🔽 Expected Low
🏷️ Optional labels + info panel for quick reference
Choosing the Correct Baseline 🎯
The baseline matters — a lot. Using the correct anchor improves accuracy dramatically.
Previous Day’s Close (Best Practice) ✔️
This is the institutional standard used by:
🏦 Market makers
📉 Options desks
📚 Professional volatility models
Because EM reflects full-day volatility, the prior close is mathematically the most accurate anchor.
Using the VIX Input 🌡️
Enter the current VIX manually (from /VX or ^VIX).
⬆️ When VIX rises → EM widens
⬇️ When VIX falls → EM tightens
Suggested VIX-Based Adjustments 🔧
Use the multiplier to fine-tune the expected move.
VIX Level Market Condition Recommended Multiplier
🟦 < 13 Very low volatility 0.9 – slightly tighter EM
🟩 13–18 Normal conditions 1.0 (default)
🟨 18–25 Elevated volatility 1.05 – 1.1
🟧 25–35 High volatility 1.2 – 1.3
🟥 > 35 Extreme volatility 1.4 – 1.6
Multipliers help the EM adapt to different volatility regimes so the ranges remain realistic.
Why This Indicator Matters 🚀
Market makers price daily options around the expected move.
Because of this:
🧲 EM boundaries often behave like dynamic support & resistance
📛 Breaks of EM commonly trigger gamma-driven trend days
🔄 Sweeps around EM often create high-probability reversals
This tool gives traders a statistically grounded framework to anticipate where QQQ is most likely to move, stall, reverse, or expand, with clean auto-updating levels every trading day.
Adjusting the previous day’s close, opening price, and VIX input lets you model the market like a volatility desk — but in a simple, transparent format. 📘✨
在脚本中搜索"daily"

SPY Downside Risk - Bond Flow Indicator (Daily)## **SPY Downside Risk - Bond Flow Indicator**
### 📊 **Overview**
A professional bond market risk monitoring indicator that assesses SPY (S&P 500 ETF) downside risk by tracking Treasury yield spreads and credit spreads. The indicator provides two complementary display modes for comprehensive market analysis.
---
### 🎯 **Key Features**
#### **Mode 1: Spreads Analysis**
Monitor critical fixed-income risk indicators:
- **10Y-2Y Treasury Spread**
- 🔵 Blue Line (> 20bp): Normal economic expansion
- 🟠 Orange Line (0-20bp): Flight-to-safety sentiment emerging
- 🔴 Red Line (< 0bp): **Yield curve inversion - Recession warning**
- **HY-IG Credit Spread** (High Yield - Investment Grade)
- 🟣 Purple Line: Credit spread widening - Rising default risk
- 🟢 Green Line: Credit spread tightening - Risk appetite improving
#### **Mode 2: Bond ETFs Capital Flow**
Track capital movements across four major bond ETFs:
- **SHY** (🔴 Red): 1-3 Year Treasury - Short-term safety
- **TLT** (🟠 Orange): 20+ Year Treasury - Long-term safety
- **LQD** (🟡 Yellow): Investment Grade Bonds - Quality credit
- **HYG** (🔵 Blue): High Yield Bonds - Risk appetite
---
### 🔧 **Input Parameters**
| Parameter | Default | Description |
|-----------|---------|-------------|
| **Display Mode** | Spreads | Choose between "Spreads" or "Bond ETFs" view |
| **ROC Period** | 10 | Rate of change period (for Bond ETFs mode smoothing) |
| **10Y-2Y Threshold** | 20 bp | Spread narrowing threshold indicating safe-haven flows |
| **VIX Filter Level** | 18 | Volatility threshold for heightened market stress |
---
### 📈 **How to Use**
#### **Yield Curve Inversion Signal**
When 10Y-2Y spread inverts (< 0bp):
- Historically precedes recession within 6-24 months
- Equity markets may face correction in 3-12 months
- Consider defensive positioning (bonds, gold, utilities)
#### **Credit Spread Expansion**
When HY-IG spread rapidly widens:
- Corporate default risk increasing
- Capital flowing from risky assets to safety
- Potential equity market pullback ahead
#### **Capital Flow Analysis**
- **SHY ⬆️ + HYG ⬇️** = Risk-off mode, equity pressure mounting
- **HYG ⬆️ + SHY ⬇️** = Risk-on sentiment, bullish for equities
- **TLT surge** = Long rates falling, economic slowdown expected
- **LQD + HYG divergence** = Credit quality differentiation
---
### 📊 **Real-Time Debug Table**
Upper-right corner displays key metrics:
**Spreads Mode:**
- **10Y-2Y Spread**: Current yield curve spread (basis points)
- **Credit Spread**: HY-IG spread (basis points)
- **VIX**: Market volatility index
**Bond ETFs Mode:**
- **SHY Flow**: Short-term Treasury momentum (%)
- **HYG Flow**: High-yield bond momentum (%)
- **VIX**: Market volatility index
**Color Coding:**
- 🔴 Red = High risk / Inverted
- 🟠 Orange = Caution / Elevated
- 🔵 Blue/Gray = Normal conditions
---
### ⚠️ **Trading Signals**
#### **High Risk Scenarios**
1. **Yield curve inverted** (Red line < 0) + **VIX > 18** (Orange)
- Action: Reduce equity exposure, increase cash/bonds
2. **Credit spread widening** + **HYG Flow negative**
- Action: Avoid high-yield debt, favor quality bonds
3. **SHY Flow positive** + **SPY declining**
- Action: Flight-to-safety confirmed, defensive positioning
#### **Bullish Scenarios**
1. **Steep yield curve** (Blue line > 50bp) + **HYG Flow > 3%**
- Action: Risk-on environment, equity allocation appropriate
2. **Credit spread tightening** + **Low VIX** (< 15)
- Action: Favorable credit conditions, growth exposure
---
### 🔔 **Alert System**
**Built-in Alert:**
- **Treasury Spread Inversion Alert**: Triggers when 10Y-2Y spread crosses below 0
**How to Set Up:**
1. Click "Create Alert" in TradingView
2. Select condition: "Treasury Spread Inversion Alert"
3. Configure notification preferences
---
### 📚 **Data Sources**
**Treasury Yields** - Federal Reserve Economic Data (FRED):
- `DGS2`: 2-Year Treasury Constant Maturity Rate
- `DGS10`: 10-Year Treasury Constant Maturity Rate
**Credit Spreads** - FRED:
- `BAMLC0A1CAAAEY`: ICE BofA US Corporate Index Option-Adjusted Spread
- `BAMLH0A0HYM2`: ICE BofA US High Yield Index Option-Adjusted Spread
**ETF Data** - AMEX/NASDAQ:
- iShares 1-3 Year Treasury Bond ETF (SHY)
- iShares 20+ Year Treasury Bond ETF (TLT)
- iShares iBoxx $ Investment Grade Corporate Bond ETF (LQD)
- iShares iBoxx $ High Yield Corporate Bond ETF (HYG)
**Volatility** - CBOE:
- VIX Index (Volatility Index)
**Update Frequency**: Daily (FRED data typically 1-2 day lag)
---
### 💡 **Best Practices**
1. **Timeframe**: Use on **Daily charts** for optimal signal quality
2. **Confirmation**: Combine with SPY price action, volume, and momentum indicators
3. **Risk Management**: Signals are early warnings - adjust positions gradually
4. **Mode Switching**: Toggle between modes weekly to understand both spread dynamics and flow patterns
5. **Historical Context**: Review past inversion periods (2000, 2007, 2019) for signal validation
---
### 📖 **Interpretation Guide**
#### **Recession Probability Matrix**
| 10Y-2Y Spread | Credit Spread | VIX | Risk Level |
|---------------|---------------|-----|------------|
| < -20bp | Widening | > 25 | 🔴 Very High |
| -20bp to 0 | Widening | > 18 | 🟠 High |
| 0-20bp | Stable | 15-18 | 🟡 Moderate |
| > 20bp | Tightening | < 15 | 🟢 Low |
#### **Lead Times (Historical Average)**
- Yield curve inversion → Recession: **12-18 months**
- Credit spread surge → Equity peak: **3-6 months**
- Safe-haven flows → Volatility spike: **1-4 weeks**
---
### 🎓 **Educational Notes**
**Why Monitor Treasury Spreads?**
- Long-term rates reflect growth expectations
- Short-term rates reflect Fed policy
- Inversion = Market expects Fed to cut rates (recession ahead)
**Why Track Credit Spreads?**
- Measures corporate borrowing stress
- Leading indicator of credit cycle turns
- High correlation with equity risk premiums
**Why Bond ETF Flows Matter?**
- Real-time capital allocation signals
- Faster than spread movements
- Shows risk sentiment shifts
---
### ⚙️ **Technical Specifications**
- **Version**: PineScript v5
- **Type**: Indicator (Non-overlay)
- **Calculation**: Daily timeframe only
- **Lookback Period**: 10 bars (customizable for ETF mode)
---
### 🚨 **Risk Disclaimer**
**IMPORTANT NOTICES:**
1. **Historical Performance**: Past yield curve inversions don't guarantee future recession timing
2. **False Signals**: Brief inversions (<30 days) may not indicate recession
3. **Data Lag**: FRED economic data has 1-2 business day delay
4. **Complementary Tool**: Use alongside fundamental and technical analysis
5. **Not Financial Advice**: For educational and research purposes only
**This indicator does not:**
- Provide specific buy/sell signals
- Guarantee trading profits
- Replace professional financial advice
- Account for individual risk tolerance
---
### 📞 **Support & Updates**
- **Questions**: Contact via TradingView private message
- **Bug Reports**: Describe issue with screenshot and chart settings
- **Feature Requests**: Suggestions welcome for future versions
---
### 📋 **Version History**
**v1.0** (December 2025)
- Initial release
- Dual-mode display (Spreads + Bond ETFs)
- Real-time debug table
- Yield curve inversion alert
- VIX filter integration
---
### 📄 **License**
**Protected Script** - Source code is not publicly available. Authorized users only.
---
**DISCLAIMER**: This indicator is provided "as-is" for educational purposes. Trading and investing involve substantial risk of loss. Always conduct your own research and consult with a licensed financial advisor before making investment decisions.
---
**© 2025 | SPY Downside Risk Indicator | All Rights Reserved**

Scan daily IndiaSetup scan for daily to enter for swing trades.
There is lot to improve here. Just a test script

VIX Expected Daily Move [SPY/SPX] VIX Expected Daily Move Indicator
This indicator helps traders anticipate the expected daily trading range for the current chart's asset (e.g., SPY, ES, SPX) based on the CBOE Volatility Index (VIX), using the widely recognized "Rule of 16" method.
Key Features:
VIX-Based Range: Calculates the implied daily high and low targets by applying the formula:
$$\text{Expected Move} = \text{Open Price} \times \frac{\text{VIX}}{100} \times \frac{1}{\sqrt{252}}$$
(where $\sqrt{252} \approx 16$)
Anchor Time: The calculation is anchored to a user-defined time (default: market open at 09:30 Exchange Time) for reliable, non-repainting levels.
Persistent Levels: Levels are calculated once per day and plotted as lines and labels that persist and extend throughout the trading session.
Historical Backtesting: Includes an option to display the expected range for historical days, making it excellent for backtesting volatility strategies.
Customization: Easily adjust the VIX symbol, anchor time, and line colors/styles.
How to Use:
Set the VIX Symbol to your preferred volatility source (default: CBOE:VIX).
Set the Anchor Time to the market open or another time when you wish to lock in the day's expected volatility reading.
Use the plotted Expected High (red line) and Expected Low (green line) as potential support and resistance targets for intraday trading decisions.

Nifty Daily Movement Filter with DaysThis indicator provides detailed statistical analysis of NIFTY 50's daily percentage movements, categorized into four distinct volatility ranges with complete weekday distribution tracking.
Features:
Analyzes daily price movements from January 1, 2024 to November 28, 2025
Categorizes volatility into 4 ranges:
0.01-0.25% (Very Low - Blue)
0.26-0.50% (Low - Green)
0.51-0.75% (Medium - Orange)
0.76%+ (High - Red)
Visual Elements:
Color-coded background highlights for each volatility range
Distinct marker shapes below bars (circles, triangles, squares, diamonds)
Labels showing day of week and exact percentage change
Comprehensive statistics table with:
Total count per volatility range
Complete Monday-Friday breakdown for each range
Overall totals by day of week
Use Cases:
Identify volatility patterns across different days of the week
Track frequency of calm vs volatile trading sessions
Analyze if specific weekdays tend toward higher/lower movements
Historical volatility distribution analysis for strategy development
Risk assessment and position sizing based on historical volatility patterns

Gold Master: Swing + Daily Scalp (Fixed & Working)How to use it correctly
Daily chart → Focus only on big green/red triangles (Swing trades)
5m / 15m / 1H chart → Focus on small circles (Scalp trades)
You can turn each system on/off independently in the settings
Works perfectly on XAUUSD, GLD, GC futures, and even DXY (inverse signals).

Triple Moving Averages Daily on Timeframe (10/20/50 with LabelsUnlike other MA's this give me on daily time frame irrespective of chart time

SPY - VPIN [VWAP] - 195min/DailyVolume Synchronized Probability of INformed Trading (VPIN) modified with VWAP and extended to be applicable to higher timeframes (195min/daily).
The buy/sell signal theoretically based on the informed decisions of smart money. For individual stocks, there is too much noise as a large fund liquidating can create false signals on the longer timeframe.
Recommend to use on SPY to follow the movement of macro-based institutional funds. A sell signal here could mean, and this "could" is doing a lot of heavy lifting, a consensus among big players of impending systematic risk, and vice versa for buy signal. Institutions could be selling for whatever reason, and they usually sell over large periods. Also remember that this doesn't include dark pool data so it is half-baked.
Signal basically showing when smart money smarts to buy during crash, or starts to sell during melt-up phase.
This is not a complete buy/sell signal, it ONLY tries to show signals from the movement of large players so no red signal does not mean there isn't systematic risk and no green signal does not mean there is systematic risk. Combine this with other indicators.
***Remember that institutions also could be retarded, and their "informed" decision might just be them acting like a retard***
Best used on SPY on 195min timeframe. Use this signal on SPY on 195min timeframe to buy/sell high beta stocks indirectly.

Green13 - Watermark with Daily ATRWatermark with custom texts and with Daily ATR and the name of the week

Income Engine - Daily Supertrend Covered Call SignalsWhat This Indicator Does
1. Identifies the safest time to sell a 1-week covered call
The script uses the Daily Supertrend as a primary trend filter.
When the trend turns bearish or weak, the indicator highlights a Sell Zone, signaling a statistically safer window to sell a covered call.
Covered calls perform best when price is:
Sideways
Weak
Trending down
Not likely to surge upward
The Sell Zone captures exactly this behavior.
Green line=Let the stock run.
Red line=safe to sell calls without assignment. Gererate income while stock falters.

z8u Daily & Weekly Key Levels (Extended)1. OVERVIEW
------------------------------------------------------------------------
The "Daily & Weekly Key Levels" indicator is a charting tool designed to
visualize critical auction market structures. It overlays automated
historical price data (Previous Day/Week Highs and Lows) with manual
inputs for Volume Profile levels (VAH, VAL, POC) and Institutional
"Kickoff" levels.
It is designed to replicate specific institutional styling, allowing
traders to see where the market is balancing relative to previous sessions.
2. FEATURES
------------------------------------------------------------------------
Automated Lookback:
Automatically calculates previous Day's High/Low/Settlement and
previous Week's High/Low.
Hybrid Input System:
Allows manual entry for data points that require specific feed
accuracy (Value Area High, Value Area Low, POC).
Clean Charting:
Manual levels default to '0.0'. If no price is entered in the
settings, the lines remain invisible to keep the chart clean.
Custom Styling:
Colors and line weights are pre-configured to match standard
Volume Profile aesthetics.
4. CONFIGURATION (INPUTS TAB)
------------------------------------------------------------------------
To see the Volume Profile and Kickoff lines, you must enter prices
manually in the indicator settings.
1. Double-click the indicator line on the chart (or the gear icon).
2. Go to the "Inputs" tab.
3. Enter the price levels for the current session:
- Yesterday's Value Area High Price
- Yesterday's VPOC Price
- Yesterday's Value Area Low Price
- Weekly Kickoff Low Price
- Weekly Kickoff High Price
*Note: If you leave a value as 0.0, that specific line will not be drawn.*
5. COLOR LEGEND (STYLE TAB)
------------------------------------------------------------------------
The lines are color-coded as follows:
Last Week's High
Yesterday's High
Yesterday's Value Area High (VAH)
Yesterday's VPOC (Volume Point of Control)
Settlement (Previous Close)
Yesterday's Value Area Low (VAL)
Yesterday's Low
Weekly Kickoff Low
Weekly Kickoff High
Last Week's Low
6. DISCLAIMER
------------------------------------------------------------------------
This tool is for informational and educational purposes only. It does not
constitute financial advice. Trading futures and financial markets
involves substantial risk of loss.
14 minutes ago
Release Notes
UPDATE
*Added Extend Levels to the Right Toggle

HybridWhales DAY TRADINGThis indicator offers a streamlined view of prevailing market trends on lower timeframes, empowering day traders to execute their strategies with greater precision
It incorporates two widely used exponential moving averages (EMAs)—the 50-period and 200-period—alongside an 800-period EMA, which effectively mirrors the 200-period EMA on the next higher timeframe. This setup provides enhanced flexibility, delivering multi-timeframe insights without the need to switch charts manually.
In addition, the indicator highlights essential intraday levels for quick reference:
Daily Open, denoted in yellow
Monday Highs, marked in red
Monday Lows, indicated in green
The indicator's core strength lies in its ability to detect market maker activity through color-coded candlesticks, based on volume analysis. Candles exhibiting significantly higher volume than the average of the prior eight candles are colored green (for bullish closes) or red (for bearish closes), signaling active market maker positioning—either entering shorts or longs.
Candles with moderately elevated volume (above average but not extreme) are shaded blue (bullish) or pink (bearish), suggesting market makers are accumulating short or long positions.
Interpretation is key: Red or pink candles (bearish) imply that market makers have initiated long positions, with price likely to revisit and fill these areas in the future. Conversely, green or blue candles (bullish) indicate market makers establishing shorts, anticipating a eventual pullback to these levels
To pinpoint the precise zones where price may return, the indicator places a white marker on each colored candle at its 50% retracement level, representing a fair value gap or imbalance.
Overall, this tool enables traders to spot market maker footprints, identify critical support and resistance zones, gauge weekly ranges, and assess potential momentum. While it fosters stronger confluence in analysis, results are not guaranteed and depend on individual trading execution.

Custom Daily Close Line Ver2Plots a line for the Daily closing price for Futures intraday charts.
Default closing price is 16:15 Eastern time.
Plot Line can be customized for different times based on the market.

The Operator Schedule (Daily/Repeating) - Time-Based AlertsKKRESULT PLAYBOOK SUCCES FORMULA
DAILY ROUTINE — THE OPERATOR SCHEDULE
• 5 AM wake-up. (5-6hrs)
• Pre-workout meal.
• Boxing or conditioning.
• Fuel + hydration.
• Morning silence.
• Chart prep.
• Trade 9:30 AM – 3 PM.
• Journal.
• Shutdown routine to reset. A consistent routine builds a consistent trader.
• Edit YouTube Video
• 12 PM Fuel + hydration

Futures EMA 9×20 Scanner (Daily + 4H + 15m)This script is to facilitate the swing trading in 15min TF using the Daily and 4H.

RSI Divergence on Daily with 4hr & 1hr CorrectionRSI Divergence on Daily chart viewed in 4 hr timeframe to identifty 4 hr/1hr rsi corrections inside of the identified, Daily RSI level (source high)

ADR Daily Range + Volatility + KZs — SMC/ICT (@PueblaATH)ADR Daily Range + Volatility + KZs — SMC/ICT (@PueblaATH) is a complete intraday context and volatility HUD that plots market opens, killzones, previous period highs/lows, and a dynamic ADR/volatility dashboard. It is built to give SMC/ICT traders an at-a-glance view of when and where price is moving: sessions, overlaps, ranges, and distance to key levels, all on a single clean overlay.
What the Indicator Does
Market Opens (Tokyo, London, New York)
Professional-grade session open lines with:
Individually configurable open times per session and timezone.
Infinite vertical lines or height-limited extensions (custom tick offsets).
Fully styled labels: size, alignment, auto-background, manual background, and vertical offset.
Killzones & Session Overlaps
Precision-timed shaded boxes for:
Tokyo Killzone
London Killzone
New York Killzone
London–New York Overlap
Previous Period Levels (PDH/PWH/PMH & PDL/PWL/PML)
Robust daily/weekly/monthly high/low engine:
Accurate Previous Day / Week / Month Highs & Lows (Europe/Madrid reference).
Line length modes: infinite, N bars, or end-of-day projection.
Per-level colors + labeled markers placed to the right of price with custom horizontal/vertical spacing.
Timeframe & Weekend Filters
Keep charts clean by hiding components based on:
Custom timeframe ranges (hide opens or killzones on HTFs).
Weekend filters for opens, killzones, and ADR/table.
Optional override to display the HUD table across all timeframes.
Session Comparison Table (Top-Right HUD)
A compact, institutional-style session dashboard comparing:
Tokyo, London, New York — current open vs previous session and previous day.
Bullish/Bearish state with color-coded logic (+ optional ▲/▼ arrows).
Optional Δ% change column relative to previous day’s open.
ADR / Volatility Panel (24h Rolling Window)
A powerful real-time volatility module providing:
True 24-hour rolling high–low range.
SMA-based ADR calculation with automatic bar-count safety limits.
ADR% expansion metric with two thresholds + blinking color logic for volatility extremes.
Directional bias vs price 24 hours ago (Bullish/Bearish).
Optional metrics: distance to PDH/PDL (in price units) and absolute H–L / ADR values.
How to Use It
Set each session’s open time and killzone window according to your broker or desired timezone alignment.
Enable or disable session opens and killzones to frame the trading windows you prioritize (e.g., LDN Killzone or NY session expansion).
Activate key previous period levels (PDH/PDL, PWH/PWL, PMH/PML) and tune the line-length mode and label spacing to match your workflow.
Use timeframe & weekend filters to keep higher-timeframe charts clean while maintaining precise intraday visibility on lower timeframes.
Monitor the session comparison table to understand directional behavior relative to previous sessions and previous day opens.
Watch the ADR panel to classify the day as compressed, normal, or expanded—and anticipate potential reversion or continuation.
Originality & Credits Disclaimer
This indicator is an original work by @PueblaATH , created specifically for the tool ADR Daily Range + Volatility + KZs — SMC/ICT (@PueblaATH) and distributed under the MPL 2.0 license.
While the concepts implemented—session opens, killzones, ADR, and previous highs/lows—are public and widely known in the trading community, this script introduces a uniquely integrated framework that combines:
Multi-timezone session scheduling with dynamic TF/weekend filtering.
A modular PDH/PWH/PMH + PDL/PWL/PML engine with versatile projection and labeling controls.
A precise 24-hour volatility model tied to an ADR panel with extension thresholds, blinking alerts, and distance-to-PD metrics.
A multi-session comparative table that unifies Tokyo, London, and New York open data in real time.
This work does not reuse or repackage code from other authors. Any future adaptations from public sources will always include full, transparent credit and documentation.

First Historical Candle Date daily intervalIndicator that displays a first historical candle on daily interval as a table at a top-right corner

Monthly, Weekly Open + Daily Pivot (Broken Lines, fixed)monthly open line weekly open and daily pivot
This TradingView indicator plots three key reference levels on your chart:
Monthly Open Line – shows the current month’s opening price.
Weekly Open Line – shows the current week’s opening price.
Daily Pivot Line – shows the pivot level based on the previous day’s high, low, and close.
Each line resets at the start of its new period (month, week, or day), so the lines are broken, not continuous.
You can fully customize visibility, color, and thickness for each line.
It helps traders quickly see market bias and important support/resistance levels for better intraday or swing trading decisions.

Midnight ET + Daily H/L (vertical midnight + HL lines)This script provides midnight EST dividers for each day and marks each daily high and low during each True day. Credits go to my mentor ICT for the idea behind this script.

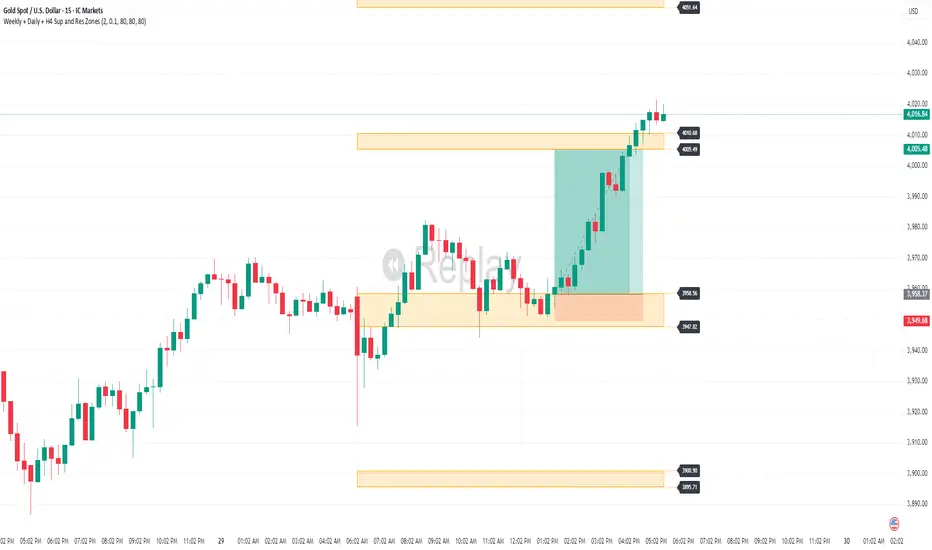
Weekly + Daily + H4 Sup and Res ZonesEveryday price move at a set range. Just wait at the zone for candle reversal/continuation pattern formation before entry. Always keep it simple. Patience is key. Just Pick your preferred tf zone. Daily zone highly recommended for less than 100 pips target. H4 for scalpers and Weekly for swingers.
Goldencross & Deathcross Highlights (50/200 SMA) - Fixed dailyThis indicator visualizes major long-term trend shifts in the market
by tracking the daily 50-day and 200-day Simple Moving Averages (SMAs)
— regardless of your current chart timeframe.
🟩 A green flash (Golden Cross) appears when the 50-day SMA crosses
above the 200-day SMA — signaling potential long-term bullish momentum.
🟥 A red flash (Death Cross) appears when the 50-day SMA crosses
below the 200-day SMA — suggesting potential long-term bearish pressure.
Unlike typical SMA overlays, this script:
• Pulls daily data directly (fixed to daily timeframe)
• Works cleanly on any chart timeframe (5m, 1h, 4h, etc.)
• Avoids clutter by hiding moving average lines
• Shows only short, subtle flashes and one clean marker per event

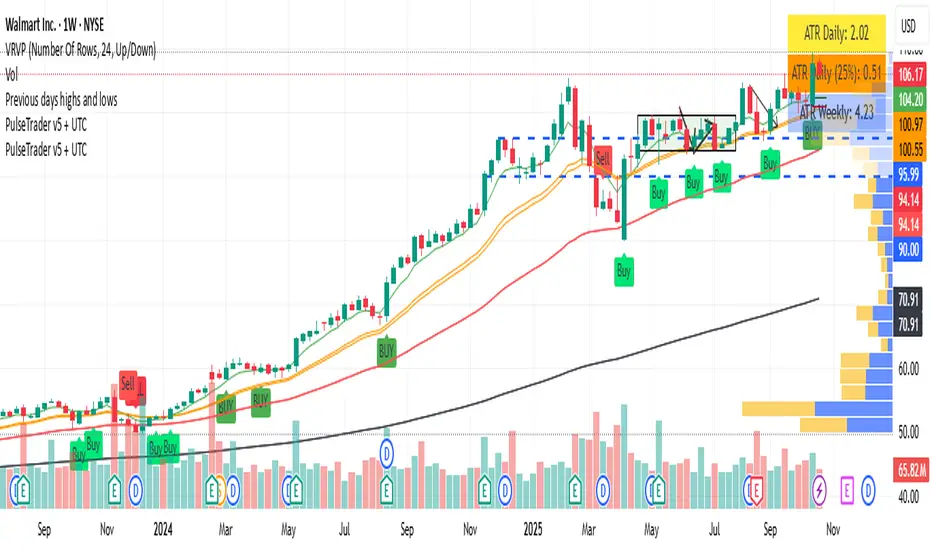
PulseTrader: Daily Momentum Catcher v6 TF + UTCtimeframe awareness (monthly / weekly / daily / intraday logic) into your full strategy script