在脚本中搜索"daily"
Daily Moving Average to Intraday Chart BradleyRUses Robertob's Script with Mike's colors for Warrior Pro Students.


BTC Swinger v1Daily interval swing trading algorithm based on momentum techniques using ATR Stops. Made by Kory Hoang from Stably.
Shout out to the Advanced Crypto Asset Trading crew! ;)

MY_CME eod OI vs CFTC eow OIDaily e-o-d Open Interest as published by CME.
As CFTC COT Open Interest relates to last Tuesday, here you can have an idea how things evolved day-by-day since then.
As CME total OI is not accessibl as data, here I sum OI of the next 9 outstanding contracts, which gives a fair idea of the trend in OI


MTF EMA Combo with Background ColorDaily/Weekly EMA combo for longer term trend direction, with combo background color for varying trend direction.


Daily Average True Range OverlayPlots the upper and lower average true range away from the previous days close on all time frames.

Daily Deviations (Lazy Edition)
Plots the standard deviation resistance/support lines.
Uses Previous days close and the VIX as the volatility factor.
credit to u/UberBotMan and u/Living_Granger for the idea and formulas

Daily Deviations (Self Input Version)
Plots the standard deviation resistance/support levels.
Input the previous settlement price and the implied volatility.
credit to u/UberBotMan and u/Living_Granger for the idea and formulas
(preview example is using settlement of 2420 and IV of 11)


Daily Returns & STDWhat happened last time when xx increased by xx%? - Start collecting some stats!
You can choose the ticker and the timeframe you're interested in

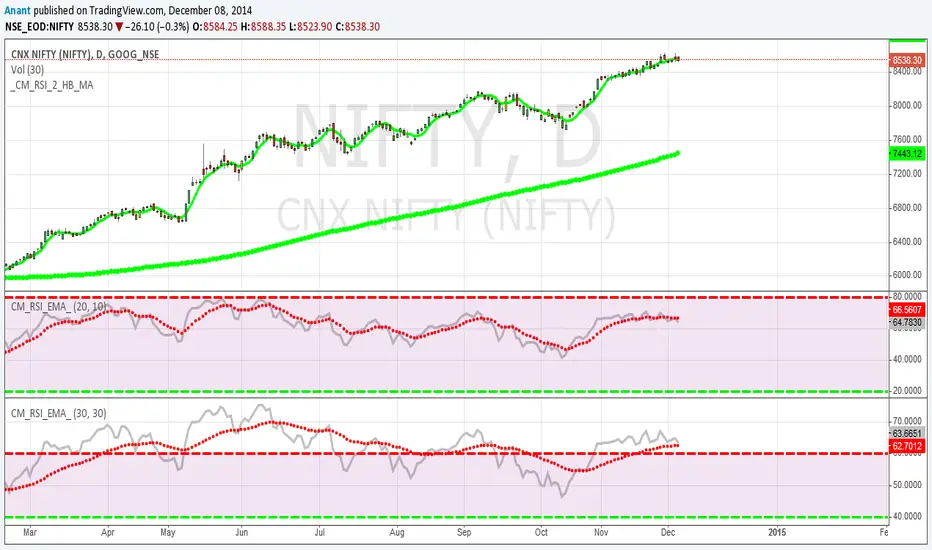
RSI Oversold/UndersoldThe study script will place GREEN BUY arrows BELOW oversold conditions and RED SHORT arrows ABOVE overbought conditions. You can configure the period
Most RSI(14) indicators use a 14-period, I prefer a 5-period. The period, overbought and oversold periods are settings that can easily be changed by adding this study to your chart and clicking the "gear" icon next to the study inside your chart.


Daily SMAThis pine script on intraday chart is exactly the same SMA as built-in MovingAverage on a 1Day chart (with the same lengths)


3 Period Momentum CompositeThis indicator calculates a 3‑period equal‑weighted momentum score using the asset’s 3‑month, 6‑month, and 12‑month percentage returns. Each return is measured from today’s closing price back to its respective lookback period, and the three values are averaged to produce a single composite momentum percentage.
When applied to the daily timeframe, the indicator automatically uses the correct trading‑day equivalents (63, 126, and 252 days). This gives you a clean, consistent way to measure medium‑ and long‑term momentum across any asset.
The composite score makes comparison extremely simple. For example, if you want to compare the Magnificent 7 stocks, you can pull up each chart on the daily timeframe and instantly see which one has the highest 3‑period composite percentage. The asset with the strongest score is the current momentum leader. This removes guesswork and gives you a fast, objective way to rank ETFs, stocks, or rotation candidates using one unified metric.

3 Period Momentum Composite3‑Period Momentum Composite Script
This indicator calculates a 3‑period equal‑weighted momentum score using the asset’s 3‑month, 6‑month, and 12‑month percentage returns. Each return is measured from today’s closing price back to its respective lookback period, and the three values are averaged to produce a single composite momentum percentage.
When applied to the daily timeframe, the indicator automatically uses the correct trading‑day equivalents (63, 126, and 252 days). This gives you a clean, consistent way to measure medium‑ and long‑term momentum across any asset.
The composite score makes comparison extremely simple. For example, if you want to compare the Magnificent 7 stocks, you can pull up each chart on the daily timeframe and instantly see which one has the highest 3‑period composite percentage. The asset with the strongest score is the current momentum leader. This removes guesswork and gives you a fast, objective way to rank ETFs, stocks, or rotation candidates using one unified metric.

Gold Professional MacrosMacro Window Descriptions
London Opening Sweep (08:00 – 08:30 CET)
Purpose: The "Judas Swing" window. It captures the initial surge of European liquidity, often creating a false move to sweep Asian Session highs or lows before establishing the true London trend.
London LOD/HOD (09:30 – 10:00 CET)
Purpose: The "Maturity" window. This is where the morning trend often establishes its Low of Day (LOD) or High of Day (HOD) before entering a mid-day consolidation.
Pre-NY News Window (13:30 – 14:00 CET)
Purpose: The "High-Impact" window. Corresponds to 07:30–08:00 NY Time, aligning with major US economic data releases (CPI, Jobless Claims) that trigger immediate repricing in Gold.
NY Open Power Surge (15:15 – 15:45 CET)
Purpose: The "Volatility" window. Marks the official New York open. This is the prime time for ICT Silver Bullet setups as heavy institutional volume enters the market.
The Gold Fix Liquidation (16:00 – 16:30 CET)
Purpose: The Master Macro. This is the London Gold Fix. It is the most critical period for Gold, often resulting in massive reversals or final daily expansions as central banks and bullion dealers settle prices globally.
PM Reversal (19:30 – 20:00 CET)
Purpose: The "Correction" window. Often sees Gold retracing to fill Fair Value Gaps (FVG) or imbalances created during the violent NY morning session.
Key Features of the Script
Visual Time-Boxing: Color-coded background zones for instant recognition.
Automated Labeling: Clearly identifies each macro at the moment of inception.
Multi-Timeframe Compatible: Optimized for M1, M5, and M15 execution charts.
Timezone Synchronized: Hard-coded to Europe/Paris (CET) to align perfectly with European and US market overlaps.

